ABB can be Buy on dips for 12000+ Targets in next 5 YearsABB can be Buy on dips for 12000+ Targets in next 5 Years
Fundamentals:
Company is almost debt free.
Company has delivered good profit growth of 40% CAGR over last 5 years
Promoter holding has increased by 75.0%
Technical:
Stock has corrected to 50% Levels from last upmove & ideally should consolidate at current levels to start new Uptrend Rally.
LTP - 4694
Breakout levels - 6100 - Aggressive accumulation above this levels can be started.
Targets = 12000+
Timeframe - 4-5 Years.
Happy investing.
Trend Analysis

Tata Steel Ltd The chart exhibits a Cup and Handle pattern on Tata Steel’s daily timeframe.
1. Pattern structure:
Cup: Formed from Nov to early Jan, with a rounded decline and recovery, creating the “U” shape.
Handle: A tighter consolidation from mid‑Jan to Feb, retracing ~10–15% of the cup’s advance, which is typical for a healthy handle.
2. Breakout:
The price has pierced the handle’s resistance (≈₹178) with decent volume (26 M shares), confirming the bullish signal.
The breakout candle is relatively strong, suggesting momentum behind the move.
3. Volume analysis:
Volume spikes during the cup’s formation and at the breakout, indicating institutional interest.
Handle volume is lower, showing reduced selling pressure and consolidation.
4. Target calculation:
Measured move: The depth of the cup (≈₹26.05) is projected upward from the breakout point, giving a target of ₹212 (13.93% upside).
Intermediate target: +₹9.32 (4.99%) to ₹197, often hit first in a gradual climb.
5. Support & resistance:
Immediate support now lies at the handle’s base (≈₹168–172).
Strong resistance is the previous high near ₹212.
6. Trading considerations:
Entry: Confirm close above ₹178 with volume > average; enter long.
Stop‑loss: Place below the handle’s low (≈₹168) to limit risk.
Position sizing: Allocate based on risk tolerance and the ~13% target upside.

GOLD SPOT VIEWGOLD POSSIBLE MOVES
RESISTANCE 5360 5700
SUPPORT 5060 4825
View is for education purpose only , we are not recommend any trade or investment
Always do your own analysis
5350 above sustain or close invalidation

SOLARINDS — Clean Trendline Breakout After Multiple RejectionsPrice respected the descending resistance trendline multiple times, showing strong selling pressure at higher levels.
Over time, buyers kept stepping in with higher lows, compressing price into a tight range — a classic sign of accumulation.
The recent strong breakout above the trendline confirms a shift in control from sellers to buyers.
This kind of simple structure-based breakout often leads to fresh momentum when followed by good volume and follow-through.
No indicators.
Just price doing what it always does.

NIFTY Levels for Today
Here are the NIFTY's Levels for intraday (in the image below) today. Based on market movement, these levels can act as support, resistance or both.
Please consider these levels only if there is movement in index and 15m candle sustains at the given levels. The SL (Stop loss) for each BUY trade should be the previous RED candle below the given level. Similarly, the SL (Stop loss) for each SELL trade should be the previous GREEN candle above the given level.
Note: This idea and these levels are only for learning and educational purpose.
Your likes and boosts gives us motivation for continued learning and support.

BUY TODAY SELL TOMORROW for 5% DON’T HAVE TIME TO MANAGE YOUR TRADES?
- Take BTST trades at 3:25 pm every day
- Try to exit by taking 4-7% profit of each trade
- SL can also be maintained as closing below the low of the breakout candle
Now, why do I prefer BTST over swing trades? The primary reason is that I have observed that 90% of the stocks give most of the movement in just 1-2 days and the rest of the time they either consolidate or fall
Trendline Breakout in KARURVYSYA
BUY TODAY SELL TOMORROW for 5%

CGPOWER: Major Rebound or Supply Trap?CGPOWER has staged a stunning recovery from recent lows, fueled by a robust Q3 Earnings beat and a massive 62% YoY jump in its order backlog (now at ₹15,753 Cr!).
While the fundamentals are firing, the technicals are at a crossroads.
📉 The "Supply Wall" Challenge
The Zone: 581 – 591
This is a historical supply zone where the stock has faced rejection multiple times. The stock hit an intraday high of 582.75 today, exactly where the "sellers' camp" begins.
Despite the rally, major brokerages like Nomura have slightly trimmed targets due to copper price inflation, which might keep the "Supply Zone" active in the short term.
🎯 Trading Roadmap
Bullish Case: A decisive daily close above 591 clears the historical overhead supply. If sustained, we are looking at a fast-track target toward 635+.
Bearish Case: If price fails to break 591 and starts showing weakness while going below 582 (rejection candles), expect a retracement to 556.
🛠 Action Plan
Support Level: Bulls remain in control as long as we hold above 574 (a bull mindset).
A confirmatory "full swing" short only opens up below 574 although short can be initiated at 582.

Graphite India Ltd | Monthly Timeframe | Structure-Based ViewHi all,
Graphite India is currently trading inside a long-term contracting structure after a multi-year correction. Price has respected both descending resistance and ascending support, indicating compression.
• Strong Base / Demand Zone:
Price has formed a solid base around the ₹430–₹480 zone, which has acted as reliable support multiple times.
• Descending Trendline (Major Supply):
The long-term descending trendline continues to cap price.
Recent candles show price retesting this supply area, but without a confirmed breakout yet.
• Current Phase – Retest, Not Breakout:
The highlighted candle represents a retest of resistance, not confirmation.
➡️ Monthly close is critical to validate strength.
What's next:
✔️ A strong monthly close above the descending trendline
✔️ Acceptance above previous swing highs
✔️ Follow-through volume (optional confirmation)
Until then, this remains a wait-and-watch structure, not a prediction setup.
#GraphiteIndia
#MonthlyChart
#MarketStructure
#PriceAction
#SupportResistance
#TrendlineAnalysis
#IndianStocks
#SwingTrading
#BullManAcademy

Bitcoin Bybit chart analysis JENUARY 27Hello
It's a Bitcoin Guide.
If you "follow"
You can receive real-time movement paths and comment notifications on major sections.
If my analysis was helpful,
Please click the booster button at the bottom.
This is a Bitcoin 30-minute chart.
Shortly, there's a Nasdaq indicator release at 12:00 PM.
On the left, with the purple finger,
I've linked the strategy to yesterday's long position entry point, 87.5K.
*Red finger movement path:
One-way long position strategy
1. $87,276 long position entry point / Stop loss if the green support line is broken
2. $88,691.1 long position first target -> Target prices in order from Gap 8 onwards
88.1K in the middle is a useful long position re-entry point.
For those holding long positions yesterday,
I recommend setting a stop loss if the green support line is broken.
Bottom: Light blue support line -> If the first section is broken,
the bottom: $85,238.3 is the final support line.
Up to this point, I ask that you use my analysis for reference only.
I hope you operate safely, with a focus on principled trading and stop-loss orders.
Thank you.

Bitcoin at Demand: Where Most Traders Panic and Smart Money WaitWhen I look at this chart, I don’t see weakness.
I see price reacting exactly where it should .
Bitcoin is sitting above a clearly defined demand zone, and instead of collapsing, price is slowing down and compressing.
That usually tells me the market is absorbing liquidity, not distributing .
Key things I’m focusing on:
Price is holding above ascending demand , which shows buyers are still defending structure.
Reactions from the demand zone are clean , not impulsive, a sign of controlled participation.
Overhead supply is present , which explains the compression instead of an instant breakout.
RSI bullish divergence adds confidence that downside momentum is weakening near demand.
My mindset here:
I’m not chasing moves.
I’m not panicking into demand.
I’m simply watching how price behaves here , because this zone decides whether the next move expands or fails.
As long as structure holds, patience matters more than prediction.
Disclaimer:
This analysis is for educational purposes only. Not financial advice. Always manage your risk.

(FOMC) Bitcoin Bybit chart analysis JENUARY 28Hello
It's a Bitcoin Guide.
If you "follow"
You can receive real-time movement paths and comment notifications on major sections.
If my analysis was helpful,
Please click the booster button at the bottom.
This is a 30-minute Bitcoin chart.
The FOMC will announce interest rates at 4:00 AM tomorrow.
In the lower left corner, with the purple finger,
I've linked my strategy to the long position entry point I entered yesterday, at $82,276.
*Conditional Long Position Strategy based on the Red Finger Movement Path
1. After touching the purple finger's first section at the top (autonomous short)
-> Switch to a long position at $89,300 at the red finger / Stop-loss price if the purple support line is broken
2. First target for a long position at the top section: $91,612.7 -> Target prices in the order of Good and Great
If the price fails to touch the first section at the top and immediately falls,
the second section at the bottom: $88,782.9 is the entry point for a long position
/ Stop-loss price if the purple support line is broken
If the price breaks the purple support line,
the price may fall to up to section 3 from the bottom.
Please use my analysis to this point for reference only.
I hope you operate safely, adhering to principled trading and stop-loss prices.
Thank you.

DLF going to touch 613DLF is currently entering a critical price cluster between 611 – 620. This zone will likely dictate the trend for the coming days.
The Pivot Point: 613 (Mean Level)
Bullish Scenario: A sustained move above 613 backed by strong volume confirmation and a breakout of the descending trendline could trigger a rally toward 637.
Bearish Scenario: If the price fails to clear the trendline and slips below 613, expect a retracement toward the support at 596.
Note: Watch for a clean break of the converging trendlines for additional confirmation if you need.

TATACONSUMER | Daily TF – RISING WEDGE BreakdownTATACONSUMER is showing short-term weakness after breaking below the rising trendline and failing to hold above 1160.
As long as price stays below this level, the probability increases for a move towards 1120–1100, which aligns with a higher time-frame Bullish Order Block (Demand Zone) and Fibonacci support.
This zone is important because it previously showed strong buying interest.
Plan: No aggressive longs yet.
Wait for price reaction, structure shift, or confirmation inside the demand zone before considering fresh buys.
Market always gives confirmation—patience pays.
Not investment advice.
Regards
Bull Man

Part 2 Intraday Institutional TradingRisks in Option Trading
1. High Volatility
Premium spikes can trap traders.
2. Time Decay
Especially dangerous for option buyers.
3. Liquidity Issues
Wide spreads can cause losses.
4. Margin Risk for Sellers
Sudden market moves can cause big losses.

NUVAMA: Back to the Launchpad?NUVAMA has just hit its Historical Support Zone at 1220. Historically, this level acted as a massive springboard, fueling a rally all the way to 1520.
The Current Setup: While we are back at the demand zone, the price structure has weakened. We are keeping a "Neutral" bias until major levels are reclaimed.
⚡️ Intraday/Short Term: If the stock holds above 1232, we expect a bounce toward 1360. (Stock not so bullish below 1440)
⚠️ The Danger Zone: A decisive trade below 1216 could open the doors for further downside toward 1135.
📈 Long-Term View: Bearish to Neutral (range bound) for now. We will only turn structurally Bullish once the stock sustains above 1440 as then it may reclaim 1520

#NAS100 Sell Trade Setup.Here’s an up-to-date NAS100/USD Sell trade outlook (technical + fundamental) to help you assess whether positioning for a Downside makes sense right now.
Thank You......

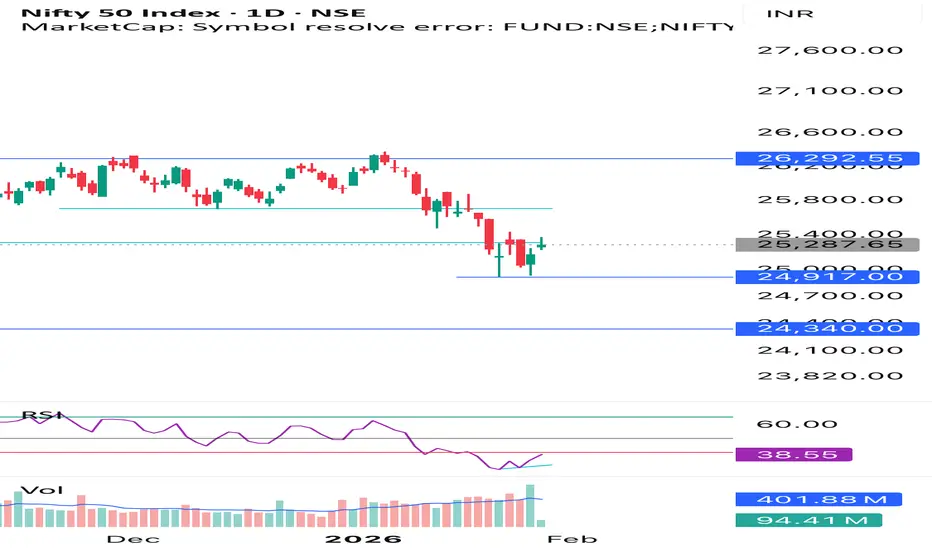
Nifty Base FormationNifty is forming at Good Base with small RSI divergence. A close above 40 RSI and 10 EMA in nifty may result in a new short term upward trend
DXY : Decisive Move ComingDXY is stuck in a range for long and ascending triangle type formation can be seen on weekly charts. Any break either upside or downside can bring a big move and sharp move

PHOENIXLTD 1 Week Time Frame📌 Current weekly reference price: ~₹1,730–₹1,740 on NSE (updated latest).
📊 Weekly Pivot & Key Levels (Most Recent)
▶️ Weekly Pivot Point
Weekly Pivot (Standard): ₹1,768.93 (central reference for the week)
📈 Weekly Resistance Levels
(Upside levels where price may face selling pressure)
1. R1: ~₹1,818.67 – first major resistance zone this week
2. R2: ~₹1,910.83 – secondary resistance on extended upside
3. R3: ~₹1,960.57 – deep stretch resistance if bullish momentum builds
Interpretation:
A weekly close above ₹1,818–₹1,820 would suggest strength and bullish continuation into higher zones.
Strong upside momentum could target tier‑2 and tier‑3 resistance levels above ₹1,900.
📉 Weekly Support Levels
(Key downside levels where price may find buying interest)
1. S1: ~₹1,676.77 – immediate support if price dips from current levels
2. S2: ~₹1,627.03 – deeper zone of support below S1
3. S3: ~₹1,534.87 – medium‑term support zone, stronger base area
Interpretation:
If price confirms a break below weekly support ₹1,676–₹1,680, it increases the likelihood of further correction toward ₹1,627 and then ~₹1,535.
📌 Summary — Weekly Price Action Framework
Bullish Scenario (weekly view):
Price sustains above pivot ~₹1,768–₹1,770
Breaks ₹1,818–₹1,820 weekly resistance
➡️ Upside target zones: ₹1,910 → ₹1,960+
Bearish/Neutral Scenario (weekly view):
Weekly close below ₹1,676–₹1,680 support
➡️ Downside zones: ₹1,627 → ₹1,535

BANKNIFTY Levels for Today
Here are the BANKNIFTY’s Levels for intraday (in the image below) today. Based on market movement, these levels can act as support, resistance or both.
Please consider these levels only if there is movement in index and 15m candle sustains at the given levels. The SL (Stop loss) for each BUY trade should be the previous RED candle below the given level. Similarly, the SL (Stop loss) for each SELL trade should be the previous GREEN candle above the given level.
Note: This idea and these levels are only for learning and educational purpose.
Your likes and boosts gives us motivation for continued learning and support.

Intraday Short Setup | Jan 16th 2026 | Valid Until Daily ClosePrice when pushed into a potential intraday Pivot supply zone (red box) where sellers may step in. This trade is based on the expectation of a rejection from this area.
Entry: Red box - a short entry zone aligned with overhead supply
Stop Loss: Above the red zone (invalidates the setup)
Target: Green box - area to consider partial/full exit based on momentum
Risk-reward is favorable with a tight invalidation and clean downside target
Price may stall or reverse near the red box, creating short opportunity
Note:
This is an intraday trade idea that expires at 00:00 UTC (Daily Candle Close). Re-evaluate the setup if price remains indecisive near the entry zone close to that time.

GOLD (XAUUSD) Retracement Buy Zones-Long Bias Only**Description:**
Gold is currently in a bullish structure and I am waiting for a **healthy retracement into my marked demand zones**.
My plan is simple: **ONLY look for BUY opportunities** from these zones and ignore sells.
Price previously respected this area as support and also aligns with structure + retracement levels.
If price taps into the zone and shows bullish confirmation (rejection candle / structure shift), I will look for long entries.
**Trade Plan:**
✅ Direction: BUY only
📍 Entry: Inside marked retracement zone
🎯 Target 1: Previous high
🎯 Target 2: Next resistance / liquidity
🛑 Stop Loss: Below the zone (structure invalidation)
**Reason for Bias:**
• Overall trend = bullish
• Zone = previous demand area
• Waiting for retracement, not chasing price
• Risk-reward favorable from this area
⚠️ No trade if price breaks and closes below the zone.
I will wait patiently for price to come to me.
**Disclaimer:**
This is my personal analysis, not financial advice.
Always manage your risk and wait for confirmation before entering.
#XAUUSD #Gold #PriceAction #SupplyAndDemand #Forex #TradingView #BuyZone #SmartMoney #TrendTrading

GOLD Buy Pullbacks in Bullish TrendMarket Context (M30)
Gold continues to trade within a strong bullish continuation phase, holding firmly inside a well-defined ascending channel. Recent pullbacks are technical retracements for liquidity rebalancing, not signs of distribution or trend exhaustion.
On the macro side, persistent USD weakness, sustained safe-haven demand, and only modest Fed easing expectations keep the broader backdrop supportive for gold. This combination allows upside momentum to remain controlled and constructive rather than emotional.
➡️ Overall bias: Bullish – prioritize BUY setups aligned with the main trend.
Structure & Price Action
M30 structure remains intact with clear Higher Highs and Higher Lows.
Price continues to respect previous demand and key levels, confirming active buyer participation.
No bearish CHoCH has been confirmed.
The current leg is expanding toward higher Fibonacci extensions, reinforcing trend continuation.
Key insight:
👉 As long as structure holds, pullbacks represent opportunity — not risk.
Trading Plan – MMF Style
Primary Scenario – Trend-Following BUY
Focus on patience and execution at discounted levels, not chasing price at extensions.
BUY Zone 1: 5,185 – 5,170
(Short-term demand + channel support)
BUY Zone 2: 5,106 – 5,085
(Key level confluence + trendline support)
➡️ Execute BUYs only after clear bullish reaction and structure confirmation.
➡️ Avoid FOMO at extended highs.
Upside Targets:
TP1: 5,250
TP2: 5,309 (Next ATH extension zone)
Alternative Scenario
If price holds firmly above 5,250 without a meaningful pullback, wait for a break & retest before looking for continuation BUYs.
Invalidation
A confirmed M30 close below 5,044 would weaken the current bullish structure and require reassessment.
Summary
Gold remains in a controlled bullish expansion, driven by structure and macro flow. The edge is not calling the top, but buying pullbacks within demand while the trend remains intact. As long as structure holds, higher prices remain the path of least resistance.
