Deglobalization & Supply Chain Shifts: A Comprehensive AnalysisUnderstanding Deglobalization
Deglobalization refers to the reduction in global interdependence in trade, finance, and production. Unlike globalization, which emphasizes interconnectedness and the free flow of goods, services, and capital, deglobalization involves a partial reversal of these processes. It does not imply complete isolation but reflects regionalization, reshoring, and diversification of supply chains to reduce vulnerability to global shocks.
Key drivers of deglobalization include:
Geopolitical Tensions: Conflicts between major powers, such as the U.S.-China rivalry, have introduced tariffs, sanctions, and restrictions on technology and trade. Companies are forced to rethink reliance on politically sensitive regions. For instance, semiconductor supply chains have seen significant reshaping due to export restrictions on advanced chips.
Pandemic Disruptions: The COVID-19 pandemic exposed vulnerabilities in global supply chains. Lockdowns, port closures, and labor shortages highlighted the risks of concentrated production in a few regions. Companies realized that efficiency-focused supply chains could be fragile, leading to a shift toward resilience and risk mitigation.
Rising Protectionism: Nationalist and protectionist policies, including tariffs and local content requirements, have incentivized companies to reduce dependence on foreign suppliers. Governments are increasingly promoting self-sufficiency in critical sectors such as energy, defense, and healthcare.
Technological Shifts: Automation, AI, and advanced manufacturing techniques reduce the cost advantage of low-wage countries. Companies can now consider reshoring production closer to end markets without sacrificing efficiency.
Implications for Global Supply Chains
Deglobalization has triggered major shifts in supply chain strategies, affecting sourcing, manufacturing, logistics, and risk management. These shifts can be categorized as follows:
1. Reshoring and Nearshoring
Reshoring involves bringing production back to the home country, while nearshoring shifts production to nearby countries within the same region. Companies are increasingly moving away from single-source suppliers in distant regions to reduce geopolitical and logistical risks.
Example: U.S. companies are increasingly sourcing electronics from Mexico or Southeast Asia instead of China.
Benefits include reduced transportation costs, shorter lead times, and better compliance with local regulations.
Challenges include higher labor costs and potential skill gaps in domestic manufacturing.
2. Diversification of Suppliers
Companies are no longer relying on a single country or supplier for critical components. Multi-sourcing strategies reduce the risk of disruption due to political conflicts, natural disasters, or pandemics.
Example: Automotive and electronics companies are diversifying chip suppliers across Taiwan, South Korea, the U.S., and Europe.
Diversification requires advanced supply chain analytics, forecasting, and relationship management to maintain efficiency.
3. Regional Supply Chains
There is a growing focus on regionalization, where companies develop supply chains within a geographic cluster. Regional trade agreements, such as the USMCA (United States-Mexico-Canada Agreement) and RCEP (Regional Comprehensive Economic Partnership in Asia), encourage localized production.
Regional supply chains reduce exposure to long-distance shipping risks, tariffs, and currency fluctuations.
They also promote sustainability by reducing carbon emissions associated with global logistics.
4. Increased Inventory and Buffer Stocks
Just-in-time (JIT) manufacturing, a hallmark of globalization, is being reconsidered. Companies are maintaining higher inventories and safety stocks to withstand supply disruptions.
This shift increases costs but ensures supply chain resilience.
Key industries adopting this approach include pharmaceuticals, semiconductors, and critical machinery.
5. Investment in Digital Supply Chains
Digitalization plays a central role in adapting to deglobalization. Advanced data analytics, AI, IoT, and blockchain enable companies to monitor global supply chain risks in real-time.
Example: Predictive analytics help firms anticipate disruptions, adjust production schedules, and optimize logistics.
Blockchain enhances traceability, crucial for compliance with new local content laws and sustainability regulations.
Sectoral Impacts
Deglobalization affects industries differently:
Technology and Electronics: Heavily dependent on global supply chains, these sectors are relocating production to secure chip manufacturing and critical components. The U.S. CHIPS Act incentivizes domestic semiconductor production.
Automotive Industry: Global auto manufacturing has been disrupted by semiconductor shortages. Companies are regionalizing production and investing in EV battery manufacturing closer to end markets.
Pharmaceuticals: COVID-19 highlighted dependence on China and India for APIs (Active Pharmaceutical Ingredients). Many countries are now investing in local production to ensure health security.
Consumer Goods: Companies are diversifying suppliers to avoid disruptions in goods such as clothing, electronics, and household products.
Economic and Strategic Implications
Deglobalization has wide-ranging consequences:
Higher Production Costs: Shifting production closer to home or diversifying suppliers increases labor, logistics, and compliance costs. This could result in higher consumer prices.
Supply Chain Resilience: Companies are willing to trade efficiency for reliability. Resilient supply chains are less prone to disruption from geopolitical or environmental events.
Shift in Trade Patterns: Emerging markets that previously benefited from globalization may face slower growth as global production becomes more regionalized.
Innovation and Competitiveness: Nearshoring and reshoring may stimulate innovation in domestic manufacturing, robotics, and automation, boosting long-term competitiveness.
Policy and Regulatory Focus: Governments are actively shaping industrial policies to ensure national security and self-reliance. Strategic sectors such as energy, defense, and healthcare will see sustained support.
Challenges and Risks
While deglobalization promotes resilience, it is not without challenges:
Cost Inflation: Regionalization and reshoring are expensive, potentially squeezing profit margins.
Complex Supply Management: Managing multiple suppliers across regions increases operational complexity.
Trade Tensions: Fragmentation of global trade can lead to inefficiencies and reduced economies of scale.
Environmental Concerns: While regionalization reduces shipping emissions, increased local production may increase energy consumption if production relies on carbon-intensive processes.
Future Outlook
The trajectory of deglobalization suggests a hybrid model for global supply chains:
Selective Globalization: Companies will retain global networks for certain low-cost, non-critical products while regionalizing critical components.
Resilience as Priority: Supply chain decisions will prioritize risk mitigation over cost efficiency.
Technological Integration: AI, automation, and digital twins will transform supply chain management, enabling agility and rapid response to disruptions.
Policy-Driven Strategies: Trade policies, subsidies, and geopolitical pressures will continue to shape supply chain structures.
In essence, the future of global supply chains will be less about maximizing cost efficiency and more about building robustness and adaptability. Companies that successfully balance efficiency with resilience will gain a competitive edge in an increasingly unpredictable global landscape.
Conclusion
Deglobalization represents a paradigm shift in the global economy, driven by geopolitical risks, pandemics, protectionism, and technological evolution. The shift is fundamentally reshaping supply chains through reshoring, nearshoring, diversification, and digitalization. While these changes entail higher costs and operational complexities, they also provide an opportunity to build resilient, flexible, and strategically secure supply chains. The companies and nations that adapt effectively to these changes will navigate the challenges of the post-globalization era while ensuring long-term sustainability and competitiveness.
Trend Analysis

Lotus Chocolate – Trendline Breakout Wait for retestLotus Chocolate has been in a sustained downtrend, forming lower highs and lower lows while respecting a descending trendline. Recently, price witnessed a sharp bounce from the 0 Fibonacci zone (~₹553), indicating strong demand at lower levels.
The latest move shows a breakout attempt above the falling trendline and a push toward the 0.382 Fibonacci level (~₹936). This signals a possible trend reversal or at least a short-term bullish retracement within the broader structure.
Key Levels to Watch:
Support: ₹790 – ₹820 zone (near 0.236 Fib and previous structure)
Immediate Resistance: ₹936 (0.382 Fib)
Next Targets: ₹1,055 (0.5 Fib), ₹1,173 (0.618 Fib), ₹1,341 (0.786 Fib)
Important:
Do NOT enter directly after the breakout candle. The move is sharp and prone to pullback.
Wait for a proper retest of the broken trendline or the ₹790–₹820 zone with bullish confirmation before considering entry.
This setup becomes stronger if price holds above the retest zone with rising volume. Failure to hold may drag price back toward lower support.
Trade safe. Let the market prove itself before you commit capital.

Intraday Long Setup | Jan 16th 2026 | Valid Until Daily ClosePrice might retrace to a strong pivot zone.
Structure remains bullish with potential for continuation after pullback.
Tight risk control.
Watch for price reaction within the red zone. Entry only if confirmation appears
The setup expires at end of the daily candle close.

Weekly Long Setup | Jan 20th 2026 | Valid Until Weekly ClosePrice has retraced to a strong pivot zone (marked by the red box).
Structure remains bearish however, with potential reversal for continuation after pullback.
The green box represents a high-probability long opportunity with tight risk control.
Watch for price reaction within the red zone. Entry only if confirmation (e.g., bullish engulfing, strong wick rejections) appears.
The setup expires at end of the weekly candle close.

gold spot or mcx update after fresh breakoutgold spot eyes on 5200$ if mkt close abv than next up side move 5400-5800$ near terms where support 5230 if stay blow than down side expect 5210--5190--5170$ over all looks boom but profit booking expect . mcx gold April looks abv 173000 up side move 177-185000+++ where support 169000 if stay bleow than down side correction expect til 165--161000+++ no if and but.
yes a;; eyes on support lvl if mkt hold thna no doubt to up side buy on dip good way

Intraday Long Setup | Jan 28th 2026 | Valid Until Daily ClosePrice might retrace to a strong pivot zone.
Structure remains bullish with potential for continuation after pullback.
Tight risk control.
Watch for price reaction within the red zone. Entry only if confirmation appears
The setup expires at end of the daily candle close.

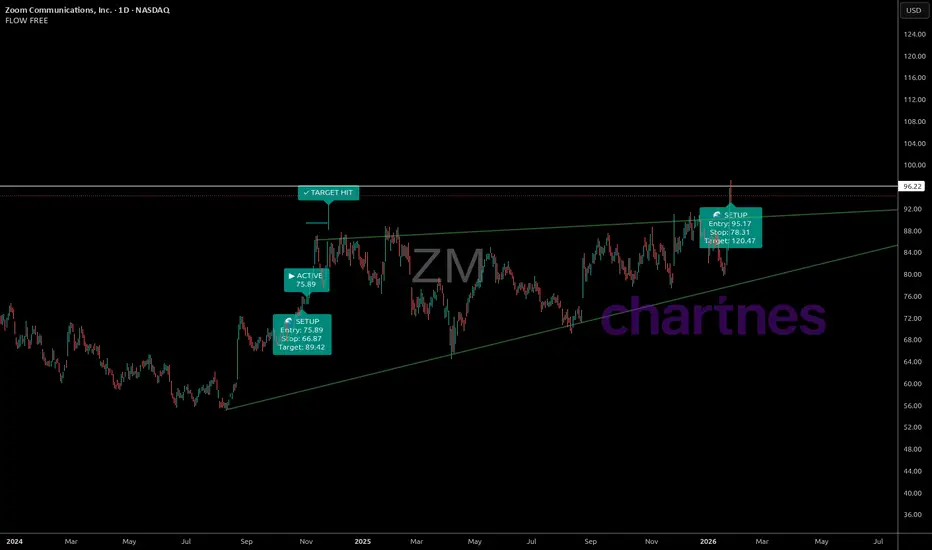
Zoom (ZM) Base Formation Meets ResistanceAfter a long period of weakness, ZM currently looks like a market in base-building mode, slowly working its way higher.
The structure is constructive, as price is forming higher lows, creating a rising foundation.
At the same time, price is now moving into a clear resistance zone around ~95–97, which is where progress or rejection will be decided.
Silent Flow identifies a new long signal, but the signal appears in a sensitive location, as it emerges directly below resistance.
A realistic bullish scenario would be: resistance test → controlled pullback (retest) → buyers step back in → another attempt higher.
A warning sign would be a pullback that becomes too aggressive and breaks the current upward structure (the most recent higher lows) in that case, the move was more of a push than a stable build.
The uncertainty is not about “bullish vs. bearish,” but about how the market reacts at this level: rejection with structure damage versus rejection with a clean retest.
Interest Rates and Central Bank PolicyIntroduction
Interest rates are a cornerstone of modern economies, influencing borrowing, spending, saving, and investment behavior across households, businesses, and governments. They represent the cost of borrowing money or the return for lending it. Central banks—such as the Federal Reserve in the United States, the Reserve Bank of India, or the European Central Bank—play a critical role in determining the level of interest rates through monetary policy. By influencing interest rates, central banks aim to achieve macroeconomic objectives, including price stability, full employment, and sustainable economic growth. Understanding how interest rates work and how central bank policies shape them is fundamental for investors, businesses, and policymakers alike.
Understanding Interest Rates
1. Types of Interest Rates
Interest rates can take several forms, each with specific functions in the economy:
Policy or Benchmark Rates: These are set by central banks and serve as a reference for other interest rates in the economy. For example, the federal funds rate in the U.S. or the repo rate in India.
Market Rates: These are determined by supply and demand in financial markets. Examples include interbank lending rates and bond yields.
Consumer Rates: These affect individuals directly, including mortgage rates, personal loans, and credit card interest rates.
Corporate Rates: Businesses borrow at rates that reflect risk, collateral, and creditworthiness, influenced by policy and market rates.
2. Nominal vs Real Interest Rates
Nominal Interest Rate: The stated rate without adjusting for inflation.
Real Interest Rate: Nominal rate minus inflation. Real rates measure the true cost of borrowing or the real return on savings and investment.
3. Influence on Economic Behavior
Interest rates affect the economy in multiple ways:
Consumption: Lower interest rates reduce the cost of loans, encouraging consumers to borrow and spend. Higher rates do the opposite.
Investment: Businesses are more likely to invest in capital projects when borrowing costs are low. High rates may delay expansion.
Saving: Higher interest rates incentivize saving, while lower rates encourage spending.
Currency Value: Higher domestic interest rates can attract foreign capital, strengthening the currency. Conversely, lower rates may weaken the currency.
Central Bank Policy
Central banks are responsible for managing a country’s monetary system. Their primary tools and objectives are designed to maintain economic stability, control inflation, and support growth.
1. Objectives of Central Bank Policy
Price Stability: Controlling inflation is the primary goal of most central banks. Moderate and predictable inflation supports economic confidence.
Economic Growth and Employment: By adjusting interest rates and money supply, central banks aim to promote sustainable growth and reduce unemployment.
Financial Stability: Preventing financial crises through regulation, liquidity provision, and supervision of banks and financial institutions.
Currency Stability: Maintaining the value of the domestic currency in international markets, often tied to trade and capital flows.
2. Tools of Monetary Policy
Central banks use a combination of conventional and unconventional tools:
Policy Rates:
Repo Rate (Repurchase Rate): The rate at which commercial banks borrow short-term funds from the central bank. Lower repo rates encourage lending and spending; higher rates curb inflation.
Reverse Repo Rate: The rate at which banks park excess funds with the central bank. Used to control liquidity.
Discount Rate / Federal Funds Rate: Key U.S. benchmark, influencing borrowing costs across the economy.
Open Market Operations (OMO): Central banks buy or sell government securities to influence the money supply. Buying securities injects liquidity, lowering interest rates; selling withdraws liquidity, raising rates.
Reserve Requirements: The minimum fraction of deposits that banks must keep as reserves. Lowering reserve requirements increases lending capacity; raising them restricts credit.
Forward Guidance: Communicating future monetary policy intentions to influence expectations and market behavior.
Quantitative Easing (QE): Unconventional policy used during crises, where central banks purchase large amounts of government or corporate bonds to lower long-term interest rates and stimulate borrowing.
Interest Rate Transmission Mechanism
The transmission of central bank policy through the economy involves several channels:
Bank Lending Channel: Lower policy rates reduce banks’ funding costs, encouraging more loans to businesses and households.
Asset Price Channel: Lower rates raise stock and bond prices, boosting wealth and consumption.
Exchange Rate Channel: Lower rates may depreciate the currency, increasing exports by making domestic goods cheaper internationally.
Expectations Channel: Central bank guidance shapes public and business expectations about future inflation, spending, and investment.
Types of Monetary Policy
Central banks implement monetary policy based on prevailing economic conditions:
Expansionary Policy: Lowering interest rates or increasing money supply to stimulate growth, typically used during recessions or slowdowns.
Contractionary Policy: Raising interest rates or reducing liquidity to control inflation or an overheating economy.
For example, during a recession, a central bank may cut policy rates and purchase government securities to encourage borrowing and spending. Conversely, in high inflation periods, tightening policy through higher rates reduces consumption and cooling inflation pressures.
Global Implications
Interest rates are not only domestic policy tools; they have international consequences:
Capital Flows: Higher domestic rates attract foreign investment, impacting exchange rates and balance of payments.
Global Borrowing Costs: Countries with debt denominated in foreign currencies are affected by rate changes in major economies like the U.S.
Commodity Prices: Changes in rates affect commodity prices indirectly by altering demand and currency values.
Financial Markets: Equity and bond markets react sensitively to central bank announcements, often leading to volatility around policy decisions.
Challenges and Considerations
Central banks face numerous challenges in setting interest rates:
Inflation vs Growth Trade-Off: Aggressive rate hikes control inflation but may slow growth; low rates boost growth but risk higher inflation.
Lagged Effects: Monetary policy effects take time to permeate the economy, sometimes 6–18 months.
Global Integration: International capital flows and foreign monetary policies constrain domestic policy autonomy.
Expectations Management: Public confidence in central bank credibility is crucial. Poor communication can lead to volatility in markets and consumer behavior.
Recent Trends
In the past decade, central banks have faced low-interest-rate environments post-global financial crises, requiring unconventional measures like QE and forward guidance. Inflation surges following supply chain disruptions and geopolitical tensions have prompted rapid interest rate adjustments, demonstrating the dynamic interplay between policy and economic realities.
Conclusion
Interest rates and central bank policies are vital levers for guiding economic activity. They affect borrowing, spending, saving, investment, and currency values, influencing both domestic and global economic landscapes. By using tools like policy rates, open market operations, and unconventional interventions, central banks seek to balance growth, employment, and inflation. Understanding these mechanisms helps investors, businesses, and individuals make informed decisions, as interest rates ultimately shape the rhythm of economic life.
Effective central bank policy requires not only technical skill but also careful attention to timing, communication, and the broader global context. With economies increasingly interconnected, the ripple effects of interest rate decisions extend far beyond national borders, making central bank actions a focal point for both policymakers and markets worldwide.

GBPUSD-Retracement Set up.(Not Trend Reversal)
GBPUSD is currently moving bullish, mainly driven by **USD weakness** rather than strong GBP strength.
This move is considered a **retracement**, not a full bearish structure change.
🔹 **Bias:**
➡️ Overall move is corrective
➡️ Bearish continuation only after retracement zones are reached
### 🎯 Key Retracement Zones
**First Retrace Target:**
📍 **1.37240**
**Deep Retrace Zone:**
📍 **1.35726**
### 🧠 Trade Idea Logic
* As long as price stays above retracement zones, market remains **bullish due to USD weakness**.
* Expecting price to **pull back (retrace)** into one of the zones.
* No bearish confirmation until these zones are tapped.
* Shorts only valid **after reaction or rejection** from retrace zones.
### ⚠️ Important Notes
* Current bullish price action = **corrective move only**
* Not a trend reversal unless structure breaks
* Wait for **price action confirmation** at retrace zones (engulfing / rejection / lower TF structure)
### 📌 Summary
✔️ Bullish move = USD weakness
✔️ Targets = 1.37240 and 1.35726
✔️ Looking for retracement, not crash
✔️ Shorts only after reaction at zones

Elliott Wave Analysis XAUUSD – 28/01/2026
1. Momentum
Daily (D1)
– D1 momentum is still overlapping, indicating that the broader bullish move may continue.
– The prolonged overbought condition reflects excessive market enthusiasm, which also serves as a warning of increasing risk.
H4
– H4 momentum is approaching the overbought zone.
→ This suggests that a corrective move on H4 is likely to occur within the next few hours.
H1
– H1 momentum is currently overbought.
→ This indicates that short-term bullish momentum is weakening, and a corrective phase on H1 is likely before the trend resumes.
2. Elliott Wave Structure
Daily Wave Structure (D1)
– On the daily timeframe, we continue to see an extension of the blue Wave 5.
– This is understandable given the current global environment, where geopolitical and economic risks remain elevated, pushing capital flows into safe-haven assets such as gold and silver.
– However, this strong shift toward safe assets also highlights growing systemic risks within global economies.
– As mentioned last Sunday, historically, recent FOMC cycles have typically occurred during periods of consolidation or correction, followed by the start of a long-term bullish trend after the announcement.
– The key difference this time is that price has already rallied strongly ahead of FOMC. Therefore, today’s FOMC release may trigger significant volatility.
H4 Wave Structure
– As discussed in yesterday’s plan, the recent corrective move did not differ materially in size, duration, or target compared to previous corrective waves within the yellow Wave 3 structure.
→ This strongly suggests that the pullback was merely a sub-wave within yellow Wave 3, keeping the bullish structure intact.
H1 Wave Structure
– On H1, a black 5-wave structure appears to be forming inside yellow Wave 3.
– As previously stated, during an extended wave, assigning precise labels while price is still unfolding is extremely difficult and often impractical, especially under extreme market sentiment.
– However, one point remains very clear:
Looking back at previous overbought RSI conditions (highlighted on the chart), each corrective phase was followed by a new price high.
– Currently, RSI is once again deeply overbought, leading me to expect another upside push to form a new high after the correction, at least until a clear RSI divergence appears at the top.
3. Key Price Zones
– With H4 and H1 momentum preparing to turn bearish, we focus on lower support zones to look for buy opportunities in line with the dominant trend.
Potential support zones
– 5192
– 5101
Upper resistance
– On the upside, multiple Fibonacci projections from different wave structures converge around 5323.
→ This zone represents a strong resistance area.
4. Trading Plan
Buy setup zone 1
– Entry: 5193 – 5191
– Stop Loss: 5172
– TP1: 5249
– TP2: 5323
Buy setup zone 2
– Entry: 5102 – 5100
– Stop Loss: 4982
– TP1: 5192
– TP2: 5323

TATAELXSI 1 Week View 📊 Current context
The stock price is in the range of around ₹5,350–₹5,450 (as of last close).
📈 1‑Week Technical Levels
These are typical support/resistance values used by short‑term traders (daily/weekly pivots & swing levels):
🧭 Weekly Support
1. ~₹5,270–₹5,280 — first major weekly support zone.
2. ~₹5,106–₹5,110 — secondary support before lower breakdown risk.
3. ~₹4,700 area — strong downside zone (52‑week low area).
🚧 Weekly Resistance
1. ~₹5,618–₹5,620 — initial weekly resistance level.
2. ~₹5,950–₹6,000 — higher breakout zone for bullish momentum.
3. Above ₹6,300 — strong breakout continuation level.
These weekly levels are useful for planning trades across the next 5–7 sessions — gains above initial resistance suggest near‑term strength, while breaks below support indicate further weakness.
🔁 Daily Pivot Levels (for intraday / short swing)
Pivot Point: ~₹5,400–₹5,407
Support†: ~₹5,355 → ₹5,295 → ₹5,250
Resistance†: ~₹5,460 → ₹5,505 → ₹5,565 (higher targets)
These pivot levels help define day‑to‑day trading range within the week.

GBPUSD: Post-BOS Retest | Long Opportunity at Demand ZoneGBPUSD has shown a clear bullish character shift on the 1H timeframe. After a series of Break of Structure (BOS) moves to the upside, the price has created a fresh Demand Zone (Order Block) around the 1.37400-450 level.

LUPIN 1 Day View 📊 Current Market Snapshot (Latest Available Close)
Price: ~₹2,137.20 (NSE) — price range on the most recent session was ₹2,130.30–₹2,178.00.
Previous Close: ₹2,163.20.
52‑week range: ₹1,795.20 low ~ ₹2,226.30 high.
📈 Daily Pivot & Key Levels (Short‑Term Technical)
🔁 Pivot (Reference Level)
Pivot point: ~₹2,166–₹2,160 zone — this is the central level that often defines bull/bear bias intraday.
🔼 Resistance (Upside Levels)
R1: ~₹2,185–₹2,189 — immediate upside barrier.
R2: ~₹2,206–₹2,208 — next medium resistance.
R3: ~₹2,227–₹2,238 — stronger resistance zone (intraday to short‑term).
🔽 Support (Downside Levels)
S1: ~₹2,143–₹2,119 — initial support from recent pivot structures.
S2: ~₹2,124–₹2,100 — mid downside support.
S3: ~₹2,102–₹2,071 — deeper support if bearish momentum accelerates.
🧠 How to Use These Levels Today
Bullish view: Stay above pivot (~₹2,160–₹2,166) for upside bias toward R1→R2.
Neutral/Range: Between S1 and R1 suggests consolidation — trade bounces within this zone.
Bearish breakdown: A close below S2/S3 can indicate deeper correction — watch S2 as key risk cutoff.
(These are not buy/sell recommendations, just short‑term technical reference points.)

XAUUSD (Gold) 45-Minute Chart – Strong Bullish Continuation AbovTrend:
Gold is in a clear bullish trend. Price has made higher highs and higher lows, accelerating strongly on Jan 28 with a breakout and momentum expansion.
Market Structure:
Earlier consolidation zones (value areas) were broken to the upside, followed by acceptance above prior ranges.
The most recent move shows impulsive buying, suggesting institutional participation rather than a weak breakout.
Volume Profile (VCP):
Previous High Volume Nodes (HVN) around 5,080–5,120 acted as resistance, now flipped into support.
Current price is trading above the Point of Control (POC), which confirms bullish control.
Low volume above indicates price discovery, meaning less resistance overhead.
Key Levels:
Resistance: 5,270–5,300 (current highs / psychological zone)
Immediate Support: 5,120–5,100 (previous value area high)
Deeper Support: 5,020–4,980 (range low & demand zone)
Bias:
Bullish while above 5,100
Pullbacks into previous value areas are likely to attract buyers.
Trading Insight:
Best opportunities are buy-the-dip setups rather than chasing highs.
A rejection with high volume below 5,100 would be the first warning sign of a deeper correction.

AXISBANK 1 Month View📈 Current Context
As of late January 2026, Axis Bank’s stock is trading around ₹1,300 – ₹1,340 range amid strong recent earnings and price momentum.
📊 1-Month Key Levels (Daily/Short-Term Range)
🔼 Resistance (Upside)
1. ₹1,340 – ₹1,350 – Near recent high/resistance zone (short-term cap)
2. ₹1,355 – ₹1,365 – Next resistance cluster above recent highs
3. ₹1,370 + – Broader higher breakout zone if strong bullish continuation occurs
Note: Weekly/short weekly resistance zones are around ₹1,317-₹1,320 and then ₹1,340-₹1,350.
🔽 Support (Downside)
1. ₹1,280 – ₹1,285 – Immediate support near recent pivot lows
2. ₹1,270 – ₹1,275 – Secondary support zone tracked by moving averages
3. ₹1,260 – ₹1,265 – Broader channel support if price weakens further
🧭 Interpretation for a 1-Month View
Bullish scenario: A sustained break and close above ₹1,350 could extend momentum toward ₹1,365+ in the coming weeks.
Bearish scenario: A break below ₹1,270 might open the path toward ₹1,250 – ₹1,260 support cluster.
Neutral/Range: In sideways conditions, expect most trading between roughly ₹1,270 – ₹1,350.

HINDALCO 1 Month View 📌 Current Price Snapshot
Approximate recent price: ₹961–₹975 on NSE.
52-week range: ₹546.45 (low) to ~₹985 (high).
📊 1-Month Technical Levels (Support & Resistance)
🔁 Pivot & Balanced Level
Pivot Level: ~₹954 – ₹963 (central zone where trend bias often flips)
📈 Resistance Levels (Upside Barriers)
1. R1: ~₹959 – ₹960 — first key resistance above current pivot.
2. R2: ~₹969 – ₹970 — near recent short-term highs.
3. R3: ~₹975 – ₹980+ — upper resistance and psychological round number area.
💡 Above ~₹980: breakout build-up zone toward recent swing highs (~₹985).
📉 Support Levels (Downside Floors)
1. S1: ~₹944 – ₹945 — first major support zone.
2. S2: ~₹938 – ₹940 — next lower support within recent range.
3. S3: ~₹929 – ₹932 — deeper support if price slides further.
4. Lower structural zone: ~₹907 – ₹921 — broader support band from longer-term pivots.
📅 Trend & Market Context (1-Month)
Momentum: RSI around mid-60s suggesting moderately bullish momentum without being overbought.
Moving averages: Price trading above major short & mid-term averages (20/50 DMA), indicating bullish bias on the monthly view.
Volatility: ATR indicates normal volatility — not extreme swings.
Interpretation:
✔ Stays bullish above ~₹944–₹945 support.
✔ Upside can extend to ~₹969–₹980 if momentum persists.
⚠ A break below ~₹932 could signal deeper pullbacks toward ~₹907 area.

AWHCL - Clear Breakout with Volume SurgeAWHCL was forming falling wedge for the last 1 year and it now broke the resistance. Volume is huge which supports the breakout. Now the stock is retesting the resistance line before making a move up.
SL would be below 553.
This is not an investment advice

SILVER CAN FLY PAST 118 Silver is bullish across all timeframes and could soar past a daily close above 118.

GIFTNIFTY IntraSwing Levels for 28th JAN 2026GIFTNIFTY IntraSwing Levels for 28th JAN 2026
🚀Follow & Compare NIFTY spot Post for Taking Trade
________________________________________________________
💥Level Interpretation / description:
L#1: If the candle crossed & stays above the “Buy Gen”, it is treated / considered as Bullish bias.
L#2: Possibility / Probability of REVERSAL near RLB#1 & UBTgt
L#3: If the candle stays above “Sell Gen” but below “Buy Gen”, it is treated / considered as Sidewise. Aggressive Traders can take Long position near “Sell Gen” either retesting or crossed from Below & vice-versa i.e. can take Short position near “Buy Gen” either retesting or crossed downward from Above.
L#4: If the candle crossed & stays below the “Sell Gen”, it is treated / considered a Bearish bias.
L#5: Possibility / Probability of REVERSAL near RLS#1 & USTgt
HZB (Buy side) & HZS (Sell side) => Hurdle Zone,
*** Specialty of “HZB#1, HZB#2 HZS#1 & HZS#2” is Sidewise (behaviour in Nature)
Rest Plotted and Mentioned on Chart
Color code Used:
Green =. Positive bias.
Red =. Negative bias.
RED in Between Green means Trend Finder / Momentum Change
/ CYCLE Change and Vice Versa.
Notice One thing: HOW LEVELS are Working.
Use any Momentum Indicator / Oscillator or as you "USED to" to Take entry.
⚠️ DISCLAIMER:
The information, views, and ideas shared here are purely for educational and informational purposes only. They are not intended as investment advice or a recommendation to buy, sell, or hold any financial instruments. I am not a SEBI-registered financial adviser.
Trading and investing in the stock market involves risk, and you should do your own research and analysis. You are solely responsible for any decisions made based on this research.
"As HARD EARNED MONEY IS YOUR's, So DECISION SHOULD HAVE TO BE YOUR's".
━━━━━━━━━━━━━━━━:===:━━━━━━━━━━━━━━━━━━
❇️ Follow notification about periodical View
💥 Do Comment for Stock WEEKLY Level Analysis.🚀
📊 Do you agree with this view?
✈️ HIT THE PLANE ICON if this technical observation resonates with you. It will Motivate me.
━━━━━━━━━━━━━━━━:===:━━━━━━━━━━━━━━━━━━
💡 If You LOOKING any CHART & want for Level and ANALYZE?
Share your desired stock names in the comments below! I will try to analyze the chart Levels, patterns and share my technical view (so far my Knowledge).
If Viewers think It can identify meaningful setups. Looking forward to hearing from all of you — let's keep this discussion going and help each other make better trading decisions.

XAUUSD - H1 Gold structurally bullishXAUUSD – H1 Gold remains structurally bullish near all-time highs| Lana ✨
Gold is extending its bullish momentum for a second consecutive session and continues to trade near all-time highs. Price action remains constructive, with the market holding above key structure while deciding between continuation or a deeper pullback into value.
📈 Market Structure & Trend Context
The short-term and medium-term structure remains bullish, with price respecting the ascending channel.
The recent push above previous highs confirms strong demand, but current price action also shows signs of consolidation near ATH.
This behavior is typical after an impulsive rally, where the market pauses to build acceptance or rebalance liquidity before the next directional move.
As long as price holds above the rising structure, the bullish thesis remains valid.
🔍 Key Technical Zones to Watch
ATH Reaction Zone: 5080 – 5110
This is a sensitive area where price may consolidate, fake out, or briefly reject before choosing direction.
Primary Pullback / Buy Zone: 5000 – 5020
A key structural level aligned with prior resistance-turned-support and the midline of the bullish channel.
Secondary Support (Deeper Pullback): 4920 – 4950
A stronger value area if volatility increases or liquidity is swept below the channel.
Upside Expansion Zone: 5180 – 5200+
If price accepts above ATH, this becomes the next upside objective within the channel.
🎯 Trading Scenarios (H1 Structure-Based)
Scenario 1 – Continuation Above ATH:
If price consolidates above 5080–5110 and shows acceptance, gold may extend toward 5180–5200. This scenario favors patience and confirmation rather than chasing immediate breakouts.
Scenario 2 – Pullback Into Structure (Preferred):
A pullback toward 5000–5020 would allow the market to rebalance liquidity and offer a higher-quality continuation setup. Holding this zone keeps the bullish structure intact.
Scenario 3 – Deeper Correction:
If price loses the primary support, the 4920–4950 zone becomes the next key area to watch for buyer response and trend defense.
🌍 Macro Context (Brief)
Gold continues to benefit from heightened geopolitical risks and ongoing trade uncertainty, reinforcing its role as a safe-haven asset.
At the same time, market attention is shifting toward the outcome of the two-day FOMC policy meeting on Wednesday, which may introduce volatility and short-term repricing.
This backdrop supports gold structurally, while also increasing the likelihood of sharp intraday swings around key levels.
🧠 Lana’s View
Gold remains bullish, but near ATH levels, discipline matters more than conviction.
Lana prefers buying pullbacks into structure, letting price confirm, and avoiding emotional trades during headline-driven volatility.
✨ Respect the structure, stay patient near the highs, and let the market come to your levels.

METROBRAND at Major Demand ZoneMETROBRAND is trading inside a well-defined range for months, with price repeatedly respecting both resistance and support zones.
The upper trendline continues to act as supply, while the horizontal base around 1000–1050 has consistently attracted buyers.
Once again, price has returned to this major demand zone — a level that has historically triggered strong reactions.
From here:
• A hold and bounce keeps the broader structure intact
• A clean breakdown would signal a shift in trend and open lower levels
This is not a random price area — it’s a key decision zone where smart money activity is usually visible.

Nifty50 analysis(28/1/2026).CPR: overlapping + descending cpr: consolidation day.
FII: -3,068.49 Sold
DII: 8,999.71 bought.
Highest OI: too soon to tell
Resistance:25500.
Support : 24900.
conclusion:
My pov:
1.yesterday clearly DII support with 9000cr. today a positive almost 300 point gap. this gap will not sustain.
2.price will drift towards yesterdays high or today cpr only then price goes upward.
3.wait for the price come to your range so you can buy at bottom.
What IF:
1.if price breaks 24900 and closed in day candle then overall trend continues.
2.if the gap sustained from openning then 25600 will be the resistance .
psychology fact:
A setbacks as the result of minor, controllable, situations that have nothing to do with them personally.
note:
8moving average ling is blue colour.
20moving average line is green colour
50moving average line is red colour.
200moving average line is black colour.
cpr is for trend analysis.
MA line is for support and resistance.
Disclaimer:
Iam not Sebi registered so i started this as a hobby, please do your own analysis, any profit/loss you gained is not my concern. I can be wrong please do not take it seriously thank you.

