Candle Pattern Practical Tips for Using Candlestick Patterns
Combine with Trend Analysis:
Always consider the prevailing trend. A reversal pattern is more meaningful if it aligns with trend exhaustion signals.
Confirm with Volume:
Higher volume strengthens the validity of candlestick signals.
Use with Technical Indicators:
Combine patterns with moving averages, RSI, MACD, or Fibonacci levels for more reliable entries and exits.
Time Frame Matters:
Patterns are more reliable on higher time frames (daily, weekly) than lower ones (1-minute, 5-minute).
Avoid Over-reliance:
No candlestick pattern guarantees success. Always manage risk with stop-losses and position sizing.
Trendcontinuation

Premium Chart Patterns Practical Application of Chart Patterns
Chart patterns are not foolproof but are valuable tools when combined with other technical indicators. Traders often use volume analysis to confirm pattern breakouts, as significant volume adds credibility to the pattern. Risk management is essential, with stop-loss orders placed strategically around pattern levels. Additionally, price targets can be estimated using pattern height or measured moves, enhancing trade planning.
Limitations of Chart Patterns
Despite their popularity, chart patterns have limitations. They rely on historical price action, which does not guarantee future performance. False breakouts and market noise can mislead traders. Patterns are subjective, and different traders may interpret the same chart differently. Therefore, combining patterns with other technical tools like moving averages, RSI, MACD, and trendlines improves accuracy.

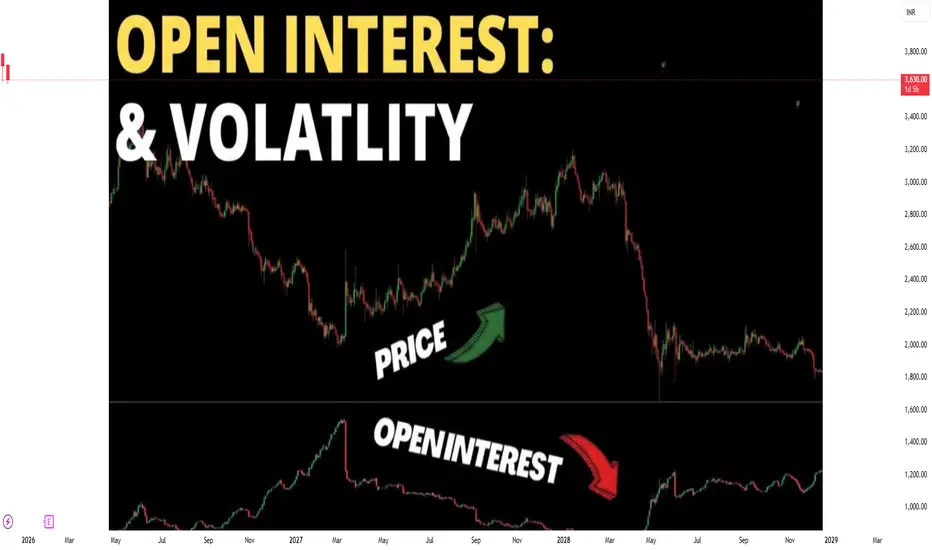
Understanding Open Interest and Volatility1. Open Interest: Definition and Significance
Open interest (OI) refers to the total number of outstanding derivative contracts, such as futures or options, that have not been settled or closed. Unlike trading volume, which measures the number of contracts traded during a specific period, open interest reflects the accumulation of positions in the market.
Key Points about Open Interest:
Indicator of Market Participation:
High open interest suggests a liquid and active market with many participants. Conversely, low open interest can indicate a less active market, where prices may be more susceptible to manipulation or sudden moves.
Trading Strategy Implications:
Trend Confirmation: Rising open interest along with rising prices typically confirms an uptrend. Similarly, rising open interest with falling prices can confirm a downtrend.
Potential Reversals: If open interest decreases while prices continue in the same direction, it may signal a weakening trend and a potential reversal.
Example:
Suppose in Nifty 50 call options, there are 50,000 outstanding contracts for a specific strike price. This is the open interest. If traders open 5,000 new contracts and close 2,000, the updated open interest becomes 53,000.
Types of Open Interest Changes:
Increase in OI with Price Increase: Indicates strong buying and bullish sentiment.
Increase in OI with Price Decrease: Suggests strong selling and bearish sentiment.
Decrease in OI with Price Increase/Decrease: Often shows traders are closing positions, which could signal market consolidation or a trend reversal.
2. Volatility: Definition and Types
Volatility measures the degree of variation of a financial instrument's price over time. It represents uncertainty or risk in price movements and is a fundamental concept in trading, risk management, and option pricing.
Types of Volatility:
Historical Volatility (HV):
It is calculated based on past price movements over a specific period. It indicates how much an asset's price fluctuated in the past.
Historical Volatility
=
Standard Deviation of Price Returns
Historical Volatility=Standard Deviation of Price Returns
Implied Volatility (IV):
Implied volatility is derived from the market price of options. It reflects the market’s expectations of future price fluctuations. High IV indicates the market expects large price movements, while low IV indicates relative calm.
Realized Volatility:
The actual volatility observed during a particular period. This is often compared with implied volatility to assess whether options are overvalued or undervalued.
Significance of Volatility:
Risk Assessment: Higher volatility implies higher risk and potential reward, which is critical for traders and risk managers.
Option Pricing: Volatility is a key input in the Black-Scholes and other option pricing models. Options tend to be more expensive when volatility is high.
Market Sentiment Indicator: Sudden spikes in volatility often reflect uncertainty, news events, or economic shocks.
Example:
If the Nifty 50 index fluctuates between 19,500 and 20,500 over a month, the volatility is measured based on the degree of these price changes. If options on Nifty reflect high implied volatility, traders expect further large swings.
3. Relationship Between Open Interest and Volatility
Open interest and volatility are interconnected in multiple ways:
Market Sentiment Indicator:
Rising open interest accompanied by rising volatility often signals that traders are aggressively taking positions in anticipation of significant price movements.
Liquidity and Price Swings:
Higher open interest can provide better liquidity, which may reduce short-term volatility. Conversely, in low-OI markets, even small trades can lead to sharp price swings.
Option Strategies:
In options trading, the interplay between open interest and implied volatility is crucial:
High OI + High IV = Liquid market but potentially expensive options.
Low OI + High IV = Less liquidity, more risk for entering/exiting trades.
Trend Analysis:
Traders often use the combination of price trend, open interest, and volatility to confirm trends or identify potential reversals.
4. Practical Applications in Trading
A. Futures and Options Trading:
Traders monitor open interest to identify which strike prices have the most open contracts, often referred to as "max pain" points, indicating potential support and resistance levels.
Implied volatility helps in deciding whether to buy or sell options. High IV may favor selling options, while low IV may favor buying options.
B. Risk Management:
Portfolio managers use volatility metrics to assess Value at Risk (VaR) and adjust positions accordingly.
Open interest provides insights into market exposure and liquidity, critical for managing large positions.
C. Intraday and Swing Trading:
Intraday traders often track sudden changes in open interest and volatility to anticipate short-term price moves.
Swing traders use historical volatility to set stop-loss levels and profit targets.
5. Indicators and Tools for Open Interest and Volatility
Open Interest Indicators:
Open Interest Analysis Charts: Show changes in OI for specific contracts.
Put-Call Ratio (PCR) with OI: Helps in gauging market sentiment for options.
Volatility Indicators:
Bollinger Bands: Uses standard deviation to gauge price volatility.
Average True Range (ATR): Measures the average movement of prices over a period.
VIX Index: Measures market-wide expected volatility (e.g., India VIX for Nifty options).
6. Challenges and Misconceptions
Open Interest is not directional: It only shows the number of contracts, not whether the market is bullish or bearish. Context with price movement is essential.
Volatility can be misleading: High volatility does not always imply a falling market; it may also indicate strong upward movements.
Interpreting both together: Correct interpretation requires combining price trends, OI changes, and volatility levels; isolated analysis can lead to false signals.
7. Conclusion
Open interest and volatility are pillars of market analysis for both retail and institutional traders. Open interest provides insight into market participation, liquidity, and potential trend strength, while volatility gauges price fluctuations, market risk, and option pricing dynamics. Together, they help traders:
Confirm trends and anticipate reversals.
Assess market sentiment and liquidity.
Strategize option trades based on risk and reward.
Make informed decisions in futures, options, and stock markets.
A successful trader combines these metrics with technical and fundamental analysis to navigate financial markets effectively. Ignoring either can lead to incomplete understanding and potential losses. Mastery of open interest and volatility allows traders to anticipate market moves, manage risk, and exploit opportunities systematically.
Event-Based Trading: A Comprehensive OverviewTypes of Events in Event-Based Trading
Event-based trading revolves around various types of events that can materially impact the value of securities. These events are generally categorized into corporate, economic, political, and market-wide events:
Corporate Events
These include events directly related to individual companies. Key examples include:
Earnings Announcements: Quarterly or annual earnings reports often trigger sharp price movements, especially if results deviate significantly from market expectations.
Mergers and Acquisitions (M&A): News of a merger, acquisition, or takeover bid can drastically alter a company’s valuation. Traders may buy shares of the target company in anticipation of a takeover premium or short the acquirer if they anticipate integration challenges.
Stock Splits or Buybacks: Companies announcing stock splits or share repurchase programs can influence demand and supply dynamics, creating trading opportunities.
Spin-offs: When a company spins off a subsidiary, traders often analyze relative valuations to exploit potential mispricings.
Economic Events
Economic data releases and policy decisions can move markets significantly:
Interest Rate Announcements: Central bank decisions can influence bond yields, currency valuations, and stock markets.
Inflation Data and Employment Reports: Unexpected deviations from forecasts often lead to volatility in equities, currencies, and commodities.
GDP Growth Reports: Market participants adjust their risk exposure based on economic growth trends.
Political Events
Political developments can have far-reaching effects:
Elections: Outcome predictions or surprises can shift investor sentiment across sectors or entire markets.
Regulatory Changes: Policy shifts in taxation, environmental regulations, or trade agreements can impact specific industries.
Geopolitical Tensions: Conflicts, sanctions, or trade wars create sudden market reactions, often in commodities like oil or gold, and in related equities.
Market Events
Market-specific events include phenomena like:
IPO Launches: Newly listed stocks often experience high volatility due to initial market sentiment and institutional interest.
Index Rebalancing: Periodic adjustments of stock indices by benchmark providers can create temporary demand-supply imbalances.
Corporate Governance Changes: Resignations of key executives or board restructuring can influence investor confidence.
Key Principles of Event-Based Trading
Event-based trading relies on a combination of research, anticipation, timing, and risk management. The key principles include:
Anticipation and Analysis
Traders must anticipate which events could lead to profitable opportunities. This requires understanding historical market reactions, industry dynamics, and economic sensitivities. For example, if a central bank is expected to raise interest rates, currency and banking stocks may react predictably.
Volatility Exploitation
Events often create short-term price spikes or drops due to sudden shifts in supply-demand dynamics. Event-based traders seek to enter positions before or immediately after such moves to profit from rapid price changes.
Information Advantage
Traders rely on timely and accurate information. Access to real-time news feeds, earnings reports, economic indicators, and regulatory filings is critical. Some professional event traders use alternative data sources, such as satellite imagery for commodity analysis or shipping data for logistics insights.
Short-Term Focus
While some event-based strategies can be medium-term, most trading revolves around short-term price reactions. Traders often hold positions for hours, days, or weeks, depending on the nature and expected impact of the event.
Risk Management
Event-based trading carries inherent risks due to unpredictable outcomes. Sudden reversals, rumors, or delayed reactions can lead to losses. Traders use stop-loss orders, position sizing, and hedging strategies to protect capital.
Common Event-Based Trading Strategies
Event-driven traders often specialize in particular strategies based on event type and market response:
Merger Arbitrage
Traders exploit the price difference between the current trading price of a target company and the announced acquisition price. For instance, if a company is being acquired for $50 per share, but the stock trades at $47, traders might buy the stock anticipating a convergence to the acquisition price.
Earnings Plays
Traders anticipate stock price movements around earnings releases by analyzing historical earnings surprises and market expectations. They may use options strategies like straddles or strangles to profit from anticipated volatility.
Dividend Capture
Some traders focus on stock price movements around dividend announcements or ex-dividend dates, seeking short-term gains from anticipated adjustments in stock prices.
Regulatory Arbitrage
Traders identify potential winners or losers from regulatory changes. For instance, if a government announces incentives for renewable energy, event-based traders might buy stocks in solar or wind energy companies.
Macro Event Trading
Economic data releases, interest rate decisions, and geopolitical developments create opportunities in forex, bonds, commodities, and equity markets. Traders position themselves to profit from expected market reactions.
Tools and Techniques in Event-Based Trading
Successful event-based trading relies on a combination of analytical, technological, and informational tools:
News and Data Feeds
Real-time information from Bloomberg, Reuters, and other financial data providers allows traders to react swiftly to events.
Event Calendars
Calendars tracking earnings releases, IPOs, mergers, central bank meetings, and economic announcements help traders plan positions in advance.
Options and Derivatives
Options, futures, and other derivatives are often used to hedge risk or enhance returns, especially when anticipating large price swings.
Quantitative Models
Advanced event-based traders use algorithms to model market reactions based on historical data, volatility patterns, and correlations.
Sentiment Analysis
Natural language processing and social media monitoring help gauge market sentiment around corporate and macroeconomic events.
Advantages of Event-Based Trading
Profit Potential: Exploiting short-term mispricings around events can generate substantial returns.
Diverse Opportunities: Multiple event types across sectors and asset classes provide a wide array of trading possibilities.
Leverage Use: Derivatives allow traders to amplify returns on event-driven trades.
Reduced Market Direction Risk: Some strategies, like merger arbitrage, are less dependent on overall market trends.
Challenges and Risks
Despite its potential, event-based trading comes with unique challenges:
Unpredictable Outcomes: Not all events have the expected market impact; surprises can lead to significant losses.
Timing Sensitivity: Missing the optimal entry or exit window can erode potential profits.
High Volatility: Sharp price swings can trigger margin calls and emotional decision-making.
Information Competition: Institutional traders with superior access and algorithms may capture most profitable opportunities.
Regulatory Risks: Insider trading regulations must be strictly followed; trading on non-public material information is illegal.
Conclusion
Event-based trading is a sophisticated strategy that capitalizes on market inefficiencies caused by specific events. Its effectiveness relies on a blend of meticulous research, rapid execution, and robust risk management. By focusing on corporate announcements, economic indicators, political developments, and market-specific events, traders aim to exploit the short-term mispricings that naturally arise in response to new information. While it offers the potential for substantial profits, it also demands expertise, discipline, and technological resources to navigate its inherent risks successfully. In today’s fast-moving markets, event-based trading represents both a challenge and an opportunity for traders willing to act decisively on the information that shapes asset prices.

Revenge Trading & Emotional ControlWhat Is Revenge Trading?
Revenge trading is the emotional attempt to immediately recover losses by placing impulsive, oversized, or irrational trades. It typically occurs after a trader:
Takes a big loss
Misses a trading opportunity
Feels unfairly “punished” by the market
Believes the market “owes” them a win
Experiences frustration or anger over previous trades
Instead of following their trading plan, the trader reacts emotionally, trying to “win it back” as quickly as possible. This behaviour often leads to:
Over-trading
Increasing position size
Entering without proper analysis
Chasing prices
Ignoring stop-loss rules
The result is usually more losses, creating a vicious emotional and financial cycle.
Why Revenge Trading Happens – The Psychology Behind It
Revenge trading stems from deep psychological triggers:
1. Ego and Self-Image
Traders often link success in trading with self-worth. A loss feels like a personal failure, so they try to “prove themselves right” through an immediate counter-trade.
2. Loss Aversion Bias
Humans hate losses more than they like gains. The fear of realizing a loss pushes traders into impulsive actions to “erase” it.
3. Dopamine Addiction
Winning trades release dopamine, creating a sense of reward. After a loss, traders crave that high again, leading to compulsive trading.
4. Fight-or-Flight Mode
After a painful loss, emotions trigger stress hormones like cortisol and adrenaline. This pushes traders into irrational, reactive behaviour.
5. Gambler’s Fallacy
Traders assume, “After a loss, the next trade must be a win,” causing them to take unnecessary risks.
The Consequences of Revenge Trading
Revenge trading can lead to disastrous outcomes:
1. Rapid Capital Erosion
Because revenge trades are impulsive and often oversized, they can quickly blow up an account.
2. Loss of Discipline
You abandon your trading rules, strategy, risk management, and stop-loss system.
3. Emotional Burnout
Anger, frustration, guilt, and regret increase stress and reduce clarity.
4. Long-Term Psychological Damage
Repeated losses from revenge trading can create fear, hesitation, self-doubt, or a complete loss of confidence in trading.
5. Spiral into Overtrading
One bad trade leads to another—forming a long chain of reckless decisions.
Signs You Are Revenge Trading
Recognizing the early signs helps you stop before damage is done:
You increase lot size after a loss without a reason.
You instantly re-enter the market after getting stopped out.
You feel angry or “challenged” by the market.
You stop thinking logically and only care about recovering losses.
You ignore your trading plan or take trades outside your strategy.
You keep staring at charts, forcing a setup that isn’t there.
If any of these happen, it’s a clear signal that emotions have taken over.
How to Stop Revenge Trading – Emotional Control Techniques
1. Create a Strict Trading Plan
A trading plan includes:
Entry rules
Exit rules
Risk-per-trade limit
Max losses per day or week
Position sizing rules
Allowed instruments and timeframes
A well-defined plan acts as a shield against emotional impulses.
2. Use a “Daily Loss Limit”
Professional traders use loss limits like:
Stop trading after 2 consecutive losing trades
Stop trading after losing 3%–5% of capital in a day
This prevents emotional escalation.
3. Step Away After a Loss
After a loss, impose a rule:
Take a 30-minute break
Walk, breathe, stretch
Drink water
Step away from charts
Distance helps reset the mind and prevents emotional reactions.
4. Practice Mindfulness & Breathing
Mindfulness helps reduce emotional volatility. Techniques include:
Deep breathing (inhale 4 sec, exhale 6 sec)
Meditation
Mental grounding
Self-talk (“It’s just a trade, not my identity”)
Controlling physiology helps control emotions.
5. Journal Your Trades and Emotions
Keep a journal where you record:
Entry/exit
Reason for trade
Emotions before and after
Lessons learned
Seeing emotional patterns written on paper is eye-opening.
6. Reduce Position Size After Losses
If you keep trading, decrease risk:
Trade 50% or even 25% of normal size
Avoid high-risk setups
Slow down decision making
Smaller size removes pressure and restores discipline.
7. Accept That Losses Are Part of Trading
No trader wins 100% of trades—not even Warren Buffett or top hedge funds.
Accepting losses as part of the business removes emotional sting.
8. Automate Parts of Your Trading
Use tools like:
Stop-loss automation
Alerts
Algo-based entries
Predefined bracket orders
Automation reduces impulsive manual decisions.
9. Focus on Process, Not Outcome
Shift your mindset:
Bad trade + profit = still bad (if you broke rules)
Good trade + loss = still good (if you followed rules)
Judge your execution, not your result.
Building Long-Term Emotional Strength as a Trader
Emotional control is like a muscle—trained over time. Here’s how to build it:
1. Build Confidence Through Backtesting
When you trust your strategy, you don’t panic or react emotionally.
2. Keep a “Win–Loss Reality Check”
Track stats like:
Win rate
Average win/loss
Drawdown
Maximum losing streak
This prepares your mind for normal market fluctuations.
3. Maintain a Balanced Lifestyle
A stressed or unhealthy mind is more prone to emotional decisions. Improve:
Sleep
Nutrition
Exercise
Social life
Mental rest
A mentally strong trader is a profitable trader.
4. Surround Yourself With the Right Environment
Avoid:
Constant exposure to social media hype
Telegram/WhatsApp tips
Traders showing big profits
This fuels FOMO and ego-driven decisions. Follow disciplined traders, not gamblers.
5. Treat Trading as a Business
Businesses have:
Plans
Budgets
Rules
Strict discipline
Trading should follow the same principles. Emotional trading = instant losses.
The Ultimate Goal: Becoming a Rational, Process-Driven Trader
Revenge trading is a symptom of emotional imbalance. To achieve market success, traders must become:
Disciplined
Patient
Objective
Process-oriented
Emotionally neutral
Risk-aware
Mastering emotions is harder than mastering charts—but it is the true edge in trading.
Final Summary
Revenge trading is a destructive emotional response to losses. It leads to irrational decisions, excessive risks, and rapid capital loss. By understanding the psychology behind it and implementing emotional control techniques—such as following a strict trading plan, setting daily loss limits, journaling, practicing mindfulness, and focusing on long-term discipline—traders can prevent revenge trading and build a stable, profitable career.

Part 2 Ride The Big Moves What Are Options?
An option is a financial contract that gives the buyer the right, but not the obligation, to buy or sell an underlying asset at a pre-decided price within a specific time.
There are two types of options:
Call Option – Gives the right to buy the asset at a fixed price.
Put Option – Gives the right to sell the asset at a fixed price.
The fixed price is known as the strike price, and the deadline to exercise the option is called the expiry date.

ANGELONE 1 Week Time Frame 📈 Current Price & Technical Context
Recent quote: around ₹2,525–₹2,535.
According to a recent technical report, the stock’s 50-day and 200-day SMAs are near ₹2,526–₹2,561.
One recent analysis notes formation of a “Golden Cross” (50-DMA crossing above 200-DMA), which is bullish — but also points out that the stock is still trading slightly below 50-DMA, so a strong up-move depends on reclaiming that level.
The weekly technical outlook from a charting site flags a “neutral” trend this week.
✅ What to Watch Closely (Triggers & Conditions)
Reclaiming 50-day SMA (~₹2,526–₹2,561) seems important. Trading above that could strengthen bullish bias.
Volume / Broader Market Sentiment — since the broker-stock universe is impacted by overall F&O activity and market mood. Weakness in broader capital-markets index may drag down Angel One.
Support breach — If price slides below ~₹2,430, downside risk extends toward ₹2,350 or lower.
Catalyst-driven moves — any fresh company/business update, change in F&O regulation or macro cue could trigger sharp swings.

Part 1 Ride The Big Moves Strategy Selection Using Market Conditions
Choosing the correct strategy depends on:
a. Trend Direction
Uptrend: Long calls, bull spreads.
Downtrend: Long puts, bear spreads.
Sideways: Iron condor, calendar spreads.
b. Volatility Expectation
High expected volatility: Straddle, strangle.
Low expected volatility: Credit spreads, condors.
c. Time to Expiry
Short expiry favors sellers due to fast time decay.
Long expiry favors buyers due to slower decay.
d. Liquidity
High open interest and narrow bid–ask spreads reduce slippage.

Part 2 Intraday Trading Master Class Risk-Management Tips
Even the best strategy fails without discipline. Here’s the real game:
Avoid unlimited risk strategies early in your journey.
Never sell naked options without proper hedging.
Always size positions correctly—use only what you can afford to lose.
Monitor volatility (VIX, IV) before entering.
Know your exit even before you enter a trade.

Part 1 Intraday Trading Master Class How Option Trading Works
Let’s break it down simply:
1. Choose the Direction
Are you bullish or bearish?
Bullish → Buy Call or Sell Put
Bearish → Buy Put or Sell Call
2. Choose the Strike Price
Pick ITM, ATM, or OTM based on your style and risk.
3. Select Expiry
Weekly expiries are popular for index trading
Monthly expiries suit swings and positional trades
4. Enter & Exit the Trade
You don’t have to wait until expiry.
Most traders exit early based on target and stop-loss.

PCR Trading Strategies Option Buyers vs. Option Sellers
Option Buyers
Limited loss (only premium paid)
Unlimited profit potential
Higher risk of loss due to time decay
Good for small capital traders
Option Sellers (Writers)
Limited profit (premium received)
Potentially unlimited loss
Benefit from time decay
Requires high margin and experience
Example:
A seller who sells Nifty 22,500 CE for ₹100 receives ₹100 premium.
If Nifty stays below 22,500, the seller keeps the entire premium.

Option Trading Strategies How Option Premium Is Determined
The premium of an option depends on multiple factors. These include:
1. Underlying Price (Spot Price)
Directly impacts option value.
Call premiums rise when price goes up
Put premiums rise when price goes down
2. Time to Expiry (Time Value)
Options lose value as expiry approaches. This is called time decay or theta decay.
3. Volatility (IV – Implied Volatility)
Higher volatility increases premiums because uncertainty is higher.
4. Interest Rates & Demand-Supply
These have smaller effects but still influence prices.

Part 2 Master Candle Stick patterns Types of Options
1. Call Options (CE)
A call option gives the buyer the right to buy the underlying asset at the strike price before expiry.
You buy a call if you think the price of the asset will go up.
Example:
If Nifty is at 22,000 and you expect it to rise, you might buy a 22,200 CE.
If Nifty rises to 22,400, the premium of your call option increases, giving you profit.

Part 1 Candle Stick Patterns What Is an Option?
An option is a contract between a buyer and a seller.
The buyer pays a premium to purchase the right.
The seller receives the premium and takes on the obligation.
Every option contract has:
Strike Price – the predetermined price for buying or selling the asset
Expiry Date – the date on which the option contract ends
Premium – the cost of the option
Lot Size – fixed quantity of the underlying asset
Understanding these fundamentals is crucial before diving into live trading.

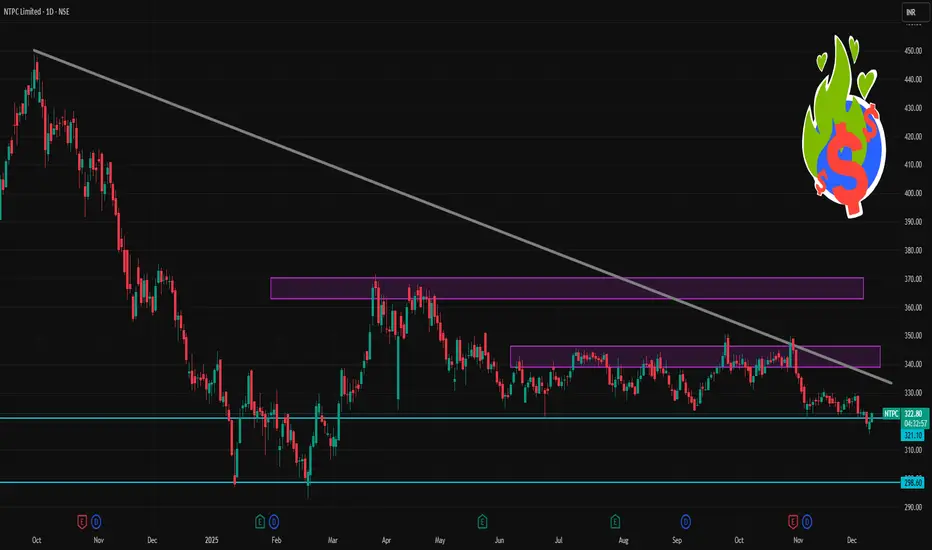
NTPC 1 Day Time Frame 📊 Current Price (Approx)
Trading around ₹319–₹320 on NSE (latest intraday range) — this is the most recent live price you’ll see on charts right now (delayed ~20 sec) and confirmed by TradingView data.
🎯 1-Day Pivot & Support-Resistance Levels
✅ Pivot Point
Central Pivot: ~₹318.9 – ₹319.4 (daily pivot based on recent range)
📈 Resistance Levels
R1: ~₹321–₹322 (first immediate hurdle)
R2: ~₹324–₹325 (stronger resistance)
R3: ~₹327–₹328+ higher barrier if momentum picks up
📉 Support Levels
S1: ~₹316–₹317 — first support zone intraday pivot tests
S2: ~₹313–₹314 — secondary support zone
S3: ~₹310–₹311 — deeper support if the stock weakens sharply
👉 These levels are typical pivot-based support/resistance from standard daily pivot calculations and recent technical tools (Classic/Fibonacci/Camarilla).
Swing Trading Strategies for Indian Stocks1. What Makes Swing Trading Effective in the Indian Market?
The Indian market has certain characteristics that make swing trading powerful:
Trending behaviour: Nifty, Bank Nifty, and sectors show clear medium-term trends.
FII-DII flows impact swings: Foreign inflows cause rallies; domestic booking brings dips.
Sector rotation: IT, Pharma, PSU, Metals, Banks rotate in cycles.
Volatility with direction: Ideal for capturing 3–10 day moves.
High liquidity stocks allow clean chart structures.
Because of these characteristics, stocks like Tata Motors, Reliance, HDFC Bank, L&T, ICICI Bank, BEL, Coal India, LTIM, HAL, and PSU banks offer excellent swing opportunities.
2. Core Swing Trading Concepts
2.1 Trend Structure
Before entering any swing trade, determine the trend:
Higher Highs & Higher Lows (HH-HL) = Uptrend
Lower Highs & Lower Lows (LH-LL) = Downtrend
Sideways consolidation = breakout/breakdown opportunity
Always trade in direction of trend for higher success.
2.2 Pullbacks and Reversals
Swing trades are often taken when:
Price pulls back to support in an uptrend
Price retests resistance in a downtrend
Price breaks out of consolidation
2.3 Support and Resistance Zones
Identify:
Weekly support/resistance
Daily swing highs/lows
Round levels like 100, 200, 500, 1000
50-day or 200-day moving averages
Strong zones = high-probability entries.
3. Best Swing Trading Strategies for Indian Stocks
Below are top-performing swing trading strategies tailor-made for the Indian market.
Strategy 1: Moving Average Pullback Strategy
This is the simplest and most reliable swing strategy.
How it works
Identify a stock in strong uptrend using 20 EMA & 50 EMA
Wait for a pullback to 20 EMA (aggressive) or 50 EMA (conservative)
Price must show bullish candle near EMA
Entry
Buy on bullish confirmation candle
Volume spike increases confidence
Stop Loss
Below recent swing low
Target
2–3x risk
Or next resistance
Best suited for
Trending stocks like PSU, banking, large caps.
Strategy 2: Breakout and Retest Strategy
Breakouts happen often in the Indian market because of strong retail + FII participation.
Steps
Identify a tight consolidation zone (triangle, flag, channel).
Wait for breakout with volume.
Do NOT buy breakout blindly; wait for retest.
Enter when retest shows bullish candle.
Why it works
Retest confirms:
Institutions support the breakout
False breakout is avoided
Best suited for
Midcaps (HAL, BEL, IRFC, JWL)
Momentum stocks
Strategy 3: RSI + Trendline Reversal Strategy
Combines momentum and price structure.
Setup
Draw a trendline connecting swing lows in uptrend.
Wait for price to touch trendline.
Check RSI between 38–45 (oversold in trend).
Entry
Enter when bullish candle appears at trendline.
Stop Loss
Just below trendline
Targets
Recent swing high or 1:2 risk–reward
Why it works
RSI 40 is the “bullish support zone” in strong uptrends.
Strategy 4: Inside Candle (NR4/NR7) Breakout Strategy
NR4/NR7 = Narrow Range candles, which signal volatility contraction.
Indian stocks behave strongly after volatility contraction.
Steps
Identify Inside Candle or NR4/NR7 pattern.
Mark high and low of inside candle.
Buy when price breaks above high.
Sell when price breaks below low.
Works best in
Stocks before results
Momentum phases
Strategy 5: Fibonacci Swing Trading Strategy
Used to find precise swing entries.
Steps
Identify strong impulsive upmove.
Draw Fib retracement.
Key buying zones:
38.2%
50%
61.8%
Confirmation
Bullish candle at zone
RSI above 40
Volume stabilizing
Targets
Previous swing high
127% or 161% extension
This method is widely used by India’s quantitative swing traders.
Strategy 6: Multi-Timeframe Swing Strategy
This increases accuracy by aligning multiple timeframes.
Steps
Check weekly trend (bigger trend)
Identify daily entry (swing pullback or breakout)
Confirm with 4-hour momentum
Example
Weekly shows uptrend
Daily pulls back to support
4H shows breakout candle
This gives extremely high-probability swing trades.
4. How to Select Stocks for Swing Trading in India
Selecting the right stocks matters more than strategy.
4.1 Criteria
High liquidity (above ₹300–500 crore daily turnover)
High relative strength vs Nifty
Stocks above 50-day and 200-day moving averages
Strong sector trend (sector rotation)
Volume patterns showing institutional activity
Best sectors for swing trades
PSU stocks
Banking
Defense
Auto
Metals
FMCG during slow markets
Avoid
Penny stocks
Illiquid stocks
Corporate governance issues
5. Indicators Useful for Swing Trading in India
Use indicators only for confirmation, not as signals.
1. Moving Averages
20 EMA (aggressive swing)
50 SMA (medium)
200 SMA (long trend)
2. RSI
Buy dips when RSI is 40–45 in uptrend
Sell rallies when RSI is 55–60 in downtrend
3. MACD
Confirms trend continuation.
4. Volume
One of the most important indicators:
Breakouts must have high volume
Retests should have low volume
6. Risk Management for Swing Trading
Risk management is the backbone of swing trading.
Position Sizing
Risk only 1–2% of capital per trade.
Stop Loss Placement
Must be based on swing low/high
Never place SL too tight
Profit Target
Maintain at least 1:2 Reward-to-Risk
Trail stop when price moves in your favor
Avoid Overnight Risk
Avoid holding during:
Major events
Budget announcements
RBI policy
Global event risk (US Fed)
7. Tools for Swing Trading
Charting
TradingView
ChartInk (Indian screeners)
Investing.com
Scanners
ChartInk swing scanner
TradingView breakout scanner
Volume surge screeners
Brokerage Platforms
Zerodha Kite
Upstox Pro
ICICI Direct Neo
Angel One Smart
8. Psychology for Swing Trading
Swing trading requires:
Patience to wait for setups
Discipline to exit when stop is hit
Ability to ignore intraday noise
Consistency in following rules
Most swing traders fail because they:
Enter too early
Exit too early
Add to losing trades
Trade too many stocks at once
Focus on quality, not quantity.
9. Example of a Complete Swing Trading Plan
Scan for stocks making higher highs.
Mark support zones on daily chart.
Wait for pullback with decreasing volume.
Enter on bullish candle with volume confirmation.
Place SL below swing low.
Target previous resistance.
Trail stop using 20 EMA.
This simple model can achieve high accuracy.
Final Summary
Swing trading in Indian stocks offers profitable opportunities because of strong trends, sector rotations, and active participation from institutions and retail traders. The most effective strategies include:
Moving average pullbacks
Breakout + retest
RSI + trendline reversals
Inside bar volatility breakouts
Fibonacci retracements
Multi-timeframe confirmation
With proper risk management, psychology, and disciplined execution, swing trading can become one of the most profitable and low-stress trading styles in the Indian equity market.

Divergence Secrets Who Should Trade Options?
Options are suitable for:
Traders looking for leverage with limited risk
Investors wanting to hedge positions
Experienced traders generating income
Anyone willing to learn market structure and volatility
But they require discipline, knowledge, and proper risk management.

Part 2 Support and ResistanceHow Time Decay Affects Option Traders
Time value decays rapidly near expiry. This is why buyers must be accurate about timing, while sellers benefit from time decay.
Buyers lose money if the market doesn’t move quickly.
Sellers gain even if the market doesn’t move at all.
This is why most experienced traders prefer option selling with risk controls.

Part 1 Support and ResistanceWhat Is Option Premium?
The premium is the price paid by the buyer to the seller to purchase the option. It represents the cost of owning the right.
Premium depends on factors like:
Current market price
Strike price
Time left to expiry
Volatility
Interest rates
Demand and supply
Two components decide the premium:
Intrinsic Value – Real value based on price difference.
Time Value – Extra value because the option has time before expiry.
As expiry approaches, time value decreases — this is called Time Decay (Theta).

Part 10 Trade Like Institutions How Option Prices Move
Option prices depend on multiple factors:
1. Movement of the underlying asset
Call option goes up when price rises.
Put option goes up when price falls.
2. Time Decay (Theta)
Options lose value as expiry gets closer.
This is good for sellers, bad for buyers.
3. Volatility (VIX)
Higher volatility increases option premiums.
During events (budget, news), premiums rise sharply.

Part 9 Trading Master ClassWhat Are Options?
An option is a financial contract that gives the buyer the right, but not the obligation, to buy or sell an underlying asset (like Nifty, Bank Nifty, or a stock) at a fixed price before a specific time.
There are two types of options:
1. Call Option
A call option gives the buyer the right to buy the underlying asset at a fixed price (called the strike price).
You buy a call when you expect price to go up.
Example: If Nifty is at 22,000 and you buy a 22,000 CE (Call Option), you profit if Nifty goes above 22,000 (after covering premium).
2. Put Option
A put option gives the buyer the right to sell the underlying asset at a fixed price.
You buy a put when you expect price to fall.
Example: If Bank Nifty is at 48,000 and you buy 48,000 PE (Put Option), you profit if the price falls below 48,000.

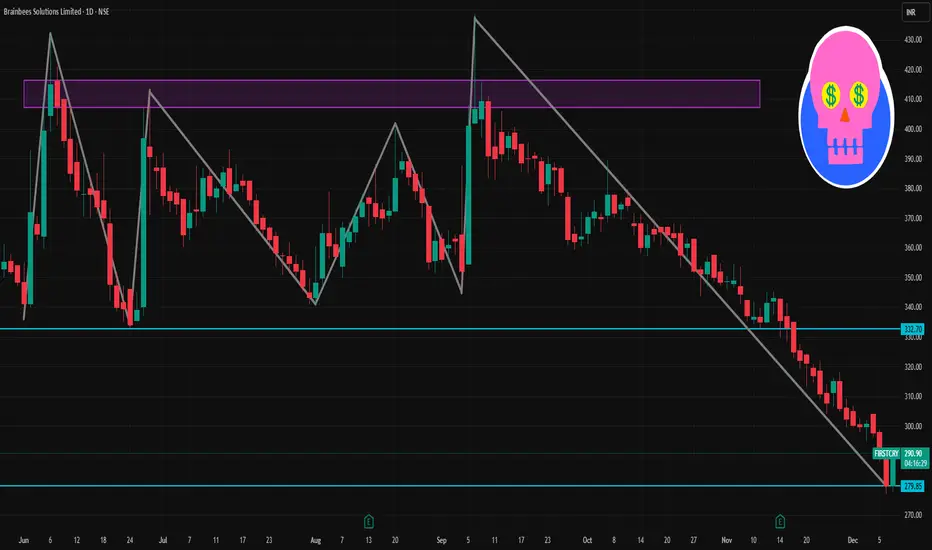
FIRSTCRY 1 Day Time Frame 📊 What the 1‑day chart for Brainbees Solutions currently shows
As of recent trading, the share price of Brainbees Solutions is around ₹ 279–290 on NSE.
The 52‑week high and low band shows a high near ~₹ 664–665 and a low around ~₹ 277–286.
That means at current ~₹ 280–290, the stock is very close to its 52‑week low — which may make the “day‑timeframe level” important for traders looking for a bounce or reversal.
Some technical‑analysis data (on certain days) show bearish momentum: for example, on a recent day the stock hit an all‑time low of ₹ 287, continuing a downtrend.
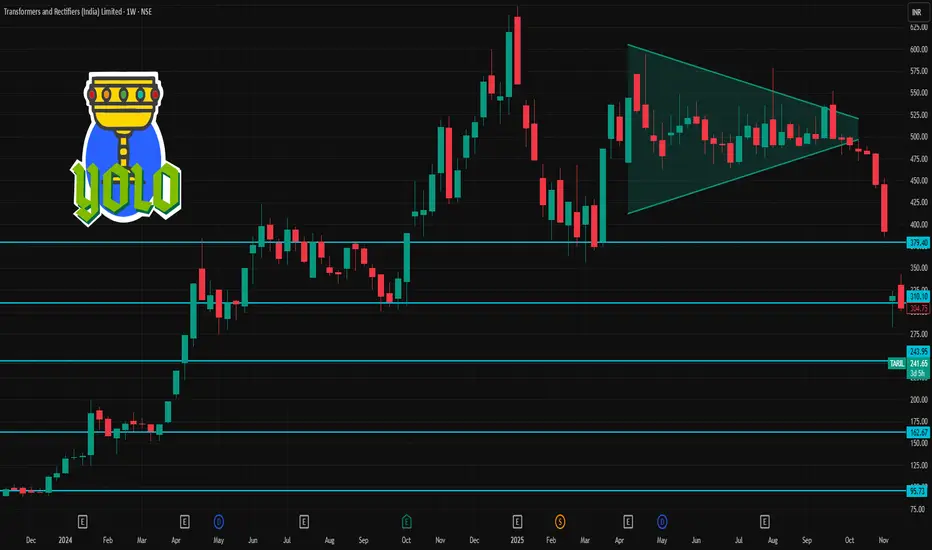
TRIL 1 Week Time Frame 📌 Latest Price & 1‑Week Snapshot
The stock is trading around ₹240–₹241 per share (NSE/BSE).
According to a recent summary, over the last 1 week the stock has moved approximately –7% to –7.4%.
52‑week range: Low ≈ ₹232–₹236, High ≈ ₹648–₹650.
Thus the stock is very near its 52‑week low — down roughly 63% from 52‑week high.
What this suggests (short‑term)
The share is currently at deep discount territory, close to 52‑week bottom — so for traders, this could mean limited downside (barring new negative news), but also that upside is large — albeit requiring major positive triggers.
Given weak near‑term momentum (recent dip, down ‑7% in a week), the stock may consolidate around current levels — ₹230–₹250 zone — unless there’s a strong catalyst.
🎯 What This Means for Short-Term Traders vs Long-Term Investors
Short-term traders: The ₹232–₹240 zone can be considered as a near-term support base. If the stock holds above ~₹235, a bounce is possible — but sharp volatility remains likely. Risk/reward is skewed toward a bounce — but with high uncertainty.
Medium/Long-term investors: The deep discount vs 52‑week high may look attractive — but fundamentals (earnings weakness, recent volatility, sanction overhang) suggest caution. The stock could recover substantially — if the company stabilizes business, wins new orders, and global/sector sentiment improves.