Premium Chart Patterns RISK MANAGEMENT FOR PREMIUM PATTERNS
Premium setup ≠ reckless trading.
Always follow:
1. SL Placement
Place SL at logical structure points, not near the breakout.
2. Position Sizing
Risk 1–2% per trade.
3. Exit Strategy
Use partial booking or trail SL using swing lows.
Trendcontinuation

Candle Patterns Knowledge Candlestick Patterns + Indicators
Candles work superbly with key indicators:
Moving Averages (20/50/200)
Hammer above 50 EMA → powerful retracement
Bearish Engulfing below 20 EMA → continuation
RSI Divergence
Bullish pattern + RSI divergence = rock-solid reversal
Bearish pattern + bearish divergence = reliable entry
Bollinger Bands
Hammer at lower band
Shooting star at upper band

SME IPO BUZZ FOR HUGE PROFITS1. What Are SME IPOs — And Why the Buzz?
SME IPOs are public issues floated by Small and Medium Enterprises that list on specialized platforms like:
NSE SME (Emerge)
BSE SME
These platforms provide small companies a chance to raise capital and investors an opportunity to participate in early-stage growth stories.
Why SME IPOs Have Become a Hot Trend
Massive oversubscriptions
Many SME issues are oversubscribed 100x to even 800x, reflecting huge liquidity and demand.
High listing gains
Many SMEs deliver 50%–200% listing pop, significantly higher than mainboard IPO averages.
Cheaper valuations
SMEs often come with smaller balance sheets but high growth potential, offering attractive valuations.
Low float → High volatility → Big gains
Small supply of shares means demand pushes prices up quickly.
Improved regulation & transparency
SEBI and exchanges have strengthened compliance, improving investor confidence.
2. SME IPO Mechanics: How They Work
Understanding the framework helps in capturing big gains.
Minimum Investment Is Higher
Unlike mainboard IPOs, SME IPOs require:
Minimum lot size ₹1–2 lakh
At times, ₹3–4 lakh per lot
This filters out casual investors and builds stability in demand.
Two IRP Categories
Retail quota: 35%
NII/HNI quota: 15%
QIB quota: 50%
Oversubscription in NII and QIB is a major indicator of strength.
Listing Platform
SME companies initially list only on SME exchanges.
Migration to mainboard is possible after reaching certain thresholds.
3. Why SME IPOs Can Generate Huge Profits
Let’s break down the reasons SME IPOs outperform mainboard IPOs:
A. Low Market Cap = High Growth Headroom
SME companies usually operate with revenues of ₹10–200 crore.
Any increase in orders, capacity, or profit quickly reflects on stock price.
Example:
A ₹50 crore company that gets a ₹20 crore contract can see a massive re-rating.
B. Limited Supply of Shares
Most SME IPOs offer small issue sizes:
₹10–50 crore.
This scarcity creates strong listing demand.
C. Strong Promoter Skin-in-the-Game
Promoters in SMEs often hold 70%–80% stake even after listing, creating confidence:
They have real business incentive
They don’t dilute aggressively
They manage business directly
This often results in more predictable growth.
D. Anchor and Institutional Participation
In many recent SME IPOs:
Family offices
PMS funds
Category II AIFs
UHNI investors
buy big allocation beforehand.
This strengthens credibility and improves listing demand.
4. How to Identify High-Potential SME IPOs
Here’s a simple but powerful analysis checklist to spot upcoming multibagger SME issues.
1. Strong Financials (Revenue, PAT, Margins)
Look for:
Revenue growth: 20–40% YoY
Profit margins: 8–15%+
Low debt
Avoid companies with sudden spike in profits just before IPO — often a red flag.
2. Reasonable Valuations
Even a great business can perform poorly if priced aggressively.
Compare:
P/E ratio vs sector P/E
EV/EBITDA
Market cap vs revenue
Safer zone:
PE below 20, or discount to peers.
3. Use of IPO Proceeds
Prefer IPOs where funds are used for:
Expansion
Working capital
Technology upgrades
Debt reduction
Avoid IPOs raising money for general corporate purposes only.
4. Strong Lead Manager Track Record
Top SME merchant bankers:
Fedex
Hem Securities
Pantomath
Gretex
Swastika Investmart
Their IPOs often have stronger post-listing performance.
5. Subscription Demand
High demand indicates strong market interest.
Key benchmarks:
Retail 20x+
NII 50x+
Overall 100x+
This significantly increases listing gain probability.
5. Strategies to Earn Huge Profits from SME IPOs
Here are the top profit-making strategies smart traders use:
A. Listing Gain Strategy
This is the most popular.
Steps:
Apply for strong SME IPOs
Target 40–150% listing pop
Exit on listing day or within 1–3 days
This minimizes risk and gives quick returns.
B. Post-Listing Breakout Strategy
Some SME IPOs consolidate after listing and give massive breakouts.
Look for:
Volume breakout
Price above listing high
Strong market trend
These stocks can become 2x to 5x within months.
C. Anchor Investor Following
If large anchors participate, buying post-listing during consolidation often yields good results.
D. Sector-Based Investing
Focus on high-growth sectors:
Defence
EV manufacturing
Pharma API
Auto components
IT services
Infra and engineering
These sectors dominate SME multibagger lists.
E. Avoiding Weak SMEs
Avoid companies with:
Sudden jump in profits pre-IPO
High receivables
High debt
Related-party transactions
Filtering negatives is as important as chasing positives.
6. Risks Associated with SME IPOs (Must Know)
Even though SME IPOs offer huge profits, they also carry unique risks.
1. Low Liquidity
Post listing, many SME stocks have limited buyers/sellers.
This can create:
Sharp price swings
Difficulty in exit
2. Price Manipulation (In Some Cases)
Low float sometimes attracts speculative operators.
Hence, due diligence is crucial.
3. High Lot Size = High Capital Requirement
You must invest ₹1–3 lakh minimum — increases risk exposure.
4. Limited Historical Data
Many SMEs are young companies without long-term financial history.
7. How to Participate Smartly — Practical Roadmap
Follow this step-by-step success system:
Step 1: Track Upcoming SME IPOs
Use sources:
Exchange websites, IPO blogs, SEBI filings.
Step 2: Apply Only for High-Quality IPOs
Use the 5-point checklist above.
Step 3: Play for Listing Gains in Over-Subscribed Issues
If NII crosses 100x, listing gains are almost guaranteed.
Step 4: Avoid Greed — Book Profits
SME stocks can crash after hype fades.
Step 5: For Long-Term, Pick Only Fundamentally Strong SMEs
Companies with clear growth path can deliver 5x–10x returns.
8. The Future of SME IPOs in India
The SME IPO market is expected to grow dramatically due to:
Government MSME support
Manufacturing boom
Retail investor participation
Better regulations
Strong Indian economy
This segment may produce the next wave of midcap multibaggers.
Conclusion
SME IPOs in India are no longer a hidden corner of the stock market — they are now a powerful wealth-building platform. With strong oversubscriptions, attractive valuations, and booming investor interest, they offer excellent opportunities for huge profits.
However, success requires smart filtering, disciplined strategy, risk management, and knowledge of SME dynamics.
If approached correctly, SME IPOs can be one of the most rewarding segments for modern Indian investors.

Fundamental Analysis (FA) for Traders1. What Fundamental Analysis Really Means for Traders
Most traders think FA is only for investors. But FA helps traders by:
Filtering out weak or manipulated stocks
Increasing the probability of sustainable moves
Helping you ride bigger trends with confidence
Protecting you from collapses caused by poor financials
Aligning you with stocks that institutions, FII/DIIs prefer
When you combine FA + TA, your trading accuracy improves dramatically because FA tells you which stock, and TA tells you when to buy or sell.
2. Key Pillars of Fundamental Analysis
FA can be divided into three pillars:
A. Economic Analysis
This covers the bigger picture—GDP, inflation, interest rates, energy prices, government policies, and global macro events.
Rising interest rates → pressure on banks & NBFCs
Falling crude oil → benefits airlines, paints, chemicals
Strong GDP → boosts cyclicals like autos, cement, infra
Weak monsoon → negative for agro and FMCG
Understanding these factors helps a trader position themselves in the right sectors during market cycles.
B. Industry Analysis
Each industry has unique growth drivers and risks.
Examples—
IT depends on global demand and currency movement.
Banking depends on NPA trends, credit growth, interest rates.
Pharma depends on USFDA approvals and regulations.
Cement depends on infra spending and real estate demand.
A trader must know industry cycles because money flows from sector to sector in rotation. Identifying these rotations early is a huge edge.
C. Company Analysis
This is the deep analysis of the business itself.
Key components include:
Financial statements
Ratios
Profit trends
Debt strength
Cash flow
Competitive advantage
A trader should not study everything like an analyst—only the most actionable data.
3. Essential Financial Statements for Traders
1. Profit & Loss Statement (P&L)
Shows revenue, expenses, and net profit.
Important signals for traders:
Consistent revenue growth
Rising margins
Strong YoY profit growth
Stocks with surging profits often show strong price breakouts.
2. Balance Sheet
Shows assets, liabilities, and capital.
Check:
Debt-to-Equity ratio
Company’s liquidity
Strength of reserves
Low-debt companies move more steadily in uptrends.
3. Cash Flow Statement
More powerful than profit numbers because cash cannot be manipulated easily.
Focus on:
Operating cash flow (OCF)
Free cash flow (FCF)
Positive FCF stocks are safer for swing and positional trading.
4. Most Important Fundamental Ratios for Traders
You don’t need 50 ratios—only the ones that directly impact price momentum.
1. EPS (Earnings Per Share)
Higher EPS = better profitability.
Stocks with rising EPS attract buyers.
2. PE Ratio
Compares price to earnings.
Low PE → undervalued
High PE → overvalued or high-growth
For traders:
Compare PE to industry average, not absolute number.
3. PEG Ratio
PEG = PE / Earnings growth
Best for identifying fast-growing stocks at reasonable valuation.
4. ROE (Return on Equity)
Measures how efficiently a company uses shareholders’ money.
Strong companies have ROE > 15%.
5. ROCE (Return on Capital Employed)
Shows returns on both equity + debt.
High ROCE indicates efficient operations.
6. Debt-to-Equity Ratio
Keep D/E < 1 for stable trading opportunities (exceptions: banks, NBFCs).
7. Operating Margin & Net Margin
Higher margins = pricing power = sustainable trends.
5. Qualitative Factors Traders Must Consider
Not everything is numbers. The biggest market moves often come from qualitative shifts.
1. Management Quality
A trustworthy management creates wealth.
A poor management destroys it even with great products.
Signals of strong management:
Transparent communication
Good capital allocation
Consistent results
2. Competitive Advantage (Moat)
A moat gives the company protection against competitors.
Moats include:
Brand power
Patents
Distribution network
Customer loyalty
Cost leadership
A company with a strong moat trends better on charts.
3. Growth Drivers
Ask:
What will increase revenue in the next 3 years?
New product?
Export expansion?
Government policy support?
Growth drives trends—traders must trade growing businesses.
6. Events That Affect Traders in FA
Traders must focus heavily on event-driven fundamental analysis:
1. Quarterly Results
Results beat → stock gaps up and trends
Results miss → stock sells off sharply
Focus on:
Revenue growth
Operating margin
EPS
Guidance commentary
2. Corporate Actions
Bonus
Split
Dividend
Buyback
Mergers
These events often create strong short-term trading opportunities.
3. Promoter Buying/Selling
Promoter buying = bullish
Promoter selling = caution
4. FII & DII Activity
Institutional money drives long-term trends.
5. Government Policies
Examples:
PLI scheme → boosts manufacturing
Infra push → cement, steel bullish
EV policies → autos & batteries rise
7. How Traders Should Use FA Along With TA
FA + TA together create high-probability trades.
Here’s the ideal system:
Step 1: Use FA to Select the Stock
Filter strong companies using:
Profit growth
Low debt
High ROE/ROCE
Strong sector
Step 2: Use FA to Validate a Big Move
Check if a breakout is supported by:
Recent results
News flow
Strong guidance
Step 3: Use TA to Time Entries
Use:
Support/resistance
Trendlines
Breakouts
Moving averages
RSI/MACD
Step 4: Hold with FA Confidence
When you know the company is strong, you avoid panicking on small dips.
Step 5: Exit With TA
Use trailing stop-losses, breakdowns, or reversal patterns.
8. Example: How Traders Apply FA in Real Market
Suppose you spot a stock showing a breakout on the chart.
Before entering, check:
Last 3 years profit growth?
Is debt low?
Is the industry in an upcycle?
Any recent positive news?
Are FIIs buying?
If fundamentals support the breakout, your trade becomes safer and more powerful.
9. Why FA Matters for Short-Term and Long-Term Traders
Short-Term Traders
FA prevents you from trading weak, manipulated, or poor-quality companies.
Swing Traders
FA helps you ride large moves that last weeks or months.
Positional Traders
FA gives confidence to hold during volatility.
Options Traders
FA guides which stocks have stability, volume, and trend consistency.
10. Final Summary
Fundamental Analysis for traders is not about becoming a CA or analyst.
It is about understanding the business behind the chart so you can trade confidently, avoid traps, and follow strong trends.
With FA, you:
Trade strong sectors
Choose high-growth companies
Avoid junk stocks
Catch big moves supported by institutions
Reduce risk
Increase success probability
FA tells you WHAT to trade.
TA tells you WHEN to trade.
Together—they build a powerful trading system.

Technical Analysis (TA) Mastery1. The Foundations of Technical Analysis
At its core, technical analysis relies on three key assumptions:
1.1 Market Discounts Everything
All information—economic, political, sentiment, and fundamental—is already reflected in price. Therefore, reading price is reading the collective behavior of market participants.
1.2 Prices Move in Trends
Markets do not move randomly; they move in trends: uptrends, downtrends, and sideways consolidations. Mastering TA requires identifying these trends early and riding them until signs of reversal emerge.
1.3 History Repeats Itself
Price patterns repeat because investor psychology—fear and greed—remains constant over time. Patterns like head and shoulders, triangles, and flags exist across decades because of this behavioral consistency.
2. Market Structure: The Backbone of TA Mastery
Before indicators, price patterns, or oscillators, a trader must learn how markets actually move.
2.1 Trend Structure
Uptrend: Higher highs (HH), Higher lows (HL)
Downtrend: Lower highs (LH), Lower lows (LL)
Sideways: Equal highs and lows
Identifying these structures helps traders avoid counter-trend mistakes and focus on high-probability setups.
2.2 Support & Resistance (S&R)
These are the most powerful tools in TA:
Support: A price level where buyers consistently step in.
Resistance: A price level where sellers emerge.
Strong S&R zones act like “decision points” where breakouts or reversals occur. TA mastery includes knowing when a level will hold or break—based on volume, candlesticks, and momentum.
2.3 Market Phases
Every market cycles through four stages:
Accumulation
Markup
Distribution
Markdown
This Wyckoff-style structure helps traders catch big moves and avoid traps.
3. Candlestick Mastery: Price Action at its Purest
Candlesticks represent raw decision-making in the market. Learning them gives you an instant emotional map—who controls the market: bulls or bears?
3.1 Key Candlestick Types
Doji → Indecision
Hammer/Inverted Hammer → Reversal signals
Engulfing → Strong reversal confirmation
Marubozu → Heavy momentum
3.2 Candlestick Patterns
Morning Star & Evening Star
Bullish/Bearish Engulfing
Pin Bar reversals
Inside Bars and Breakout Bars
Mastery comes when you can read candlesticks in context—resistance, trend direction, and volume matter more than the pattern itself.
4. Indicators and Oscillators: Enhancers, Not Predictors
Indicators help confirm price action. TA mastery means using them smartly, not blindly.
4.1 Trend Indicators
Moving Averages (20, 50, 200)
MACD
Use them to confirm trend direction and catch momentum shifts.
4.2 Momentum Indicators
RSI
Stochastic
CCI
These show overbought/oversold conditions, but only matter when aligned with trend strength.
4.3 Volatility Indicators
Bollinger Bands
ATR (Average True Range)
Great for breakout trades and stop-loss placement.
4.4 Volume Indicators
Volume Profile
OBV (On Balance Volume)
VWAP
Volume is the real power behind price movement. Breakouts with volume = reliable. Breakouts without volume = trap.
5. Chart Patterns: The Trader’s Language
Patterns represent crowd psychology. TA mastery involves recognizing these patterns early and calculating the risk–reward.
5.1 Continuation Patterns
Bull flags / Bear flags
Triangles (ascending, descending, symmetrical)
Rectangles
Cup and Handle
These indicate that the trend is likely to continue after a short pause.
5.2 Reversal Patterns
Head and Shoulders
Double Top / Bottom
Rounding Bottom
Falling / Rising Wedge
These help traders catch major turning points.
5.3 Breakouts and Fakeouts
Recognizing real breakouts vs false breakouts is critical. Volume, candle strength, and retests help filter traps.
6. Multi-Timeframe Analysis (MTA): The Secret Weapon of Pros
What beginners see as noise, experts see as structure.
6.1 How to Apply MTA
Higher timeframe (HTF): Identify trend → Weekly/Monthly
Middle timeframe: Identify S&R → Daily
Lower timeframe (LTF): Entry timing → 15m/1h
This top-down approach ensures every trade aligns with the bigger picture.
6.2 Benefits of MTA
Fewer false signals
Cleaner entries
Better trend direction understanding
Higher win rate
7. Risk Management: The Real TA Mastery
Even the best analysis fails without proper risk controls.
7.1 Position Sizing
Never risk more than 1–2% of capital per trade.
7.2 Stop-Loss Placement
Use:
ATR-based stops
Swing highs/lows
Major S&R
7.3 Risk–Reward Ratio (RRR)
Aim for at least 1:2 or 1:3 to stay profitable even with moderate accuracy.
7.4 Avoiding Overtrading
Mastery means waiting for high-probability setups, not trading every small move.
8. Trading Psychology: The Brain Behind TA
TA mastery is 70% psychology.
8.1 Common Psychological Traps
Fear of missing out (FOMO)
Revenge trading
Holding losing trades
Taking profits too early
8.2 Developing the Trader’s Mindset
Discipline > prediction
Consistency > luck
Process > outcome
A trader’s biggest enemy is not the market—it’s emotions.
9. Building a Professional TA Strategy
To truly master TA, you need a structured system.
9.1 The 5-Step Trading Blueprint
Identify Market Trend – MA, structure
Mark HTF S&R – weekly/daily
Look for Price Action Signals – candle patterns + volume
Confirm with Indicators – RSI, MACD, VWAP
Execute with Risk Control – stop-loss, position size
9.2 Backtesting Your Strategy
Check how your setup performs over 100–200 past trades. Backtesting reveals:
Win rate
Average RR
Drawdown
Strategy reliability
10. Continuous Improvement: The Path to TA Mastery
Markets evolve, and so must traders.
10.1 Keep a Trading Journal
Record:
Entry/exit
Reason for trade
Setup type
Emotional state
Lessons learned
10.2 Learn from Market Cycles
Each cycle—bull, bear, sideways—teaches different strategies.
10.3 Stay Updated
Follow market sentiment, global cues, and macro stories to complement TA.
Conclusion
Technical Analysis Mastery is not just learning indicators or patterns. It is the art of understanding price behavior, recognizing market psychology, and applying risk-controlled strategies consistently.
A true TA master:
Reads price like a story
Executes like a machine
Manages risk like a professional
Improves continuously

Divergence Secrets Risks in Option Trading
High volatility risk
Time decay for buyers
Unlimited loss for sellers
Gap-up or gap-down opening risk
Liquidity issues in stock options
Wrong position sizing leads to heavy losses
Tips for Option Traders
Always trade with a clear plan: entry, exit, stop-loss.
Avoid trading just before big news events unless experienced.
Track global markets, FIIs, indices.
Manage risk: never risk more than 1–2% of capital per trade.
Learn option Greeks—Delta, Theta, Vega are essential.
Start with buying options; move to selling only after experience.
Avoid low-liquidity contracts.

Part 7 Trading Master Class With Experts What Are Options?
Options are derivative instruments whose value is derived from an underlying asset such as Nifty, Bank Nifty, stocks, commodities, or currencies.
An option is a contract between a buyer and seller regarding the future price of an asset within a specific time.
There are two types of options:
Call Option (CE) – Gives the buyer the RIGHT (but not the obligation) to BUY the asset at a fixed price (strike price).
Put Option (PE) – Gives the buyer the RIGHT (but not the obligation) to SELL the asset at a fixed price.
The seller (also called option writer) has the OBLIGATION to fulfill the contract if the buyer exercises the option.

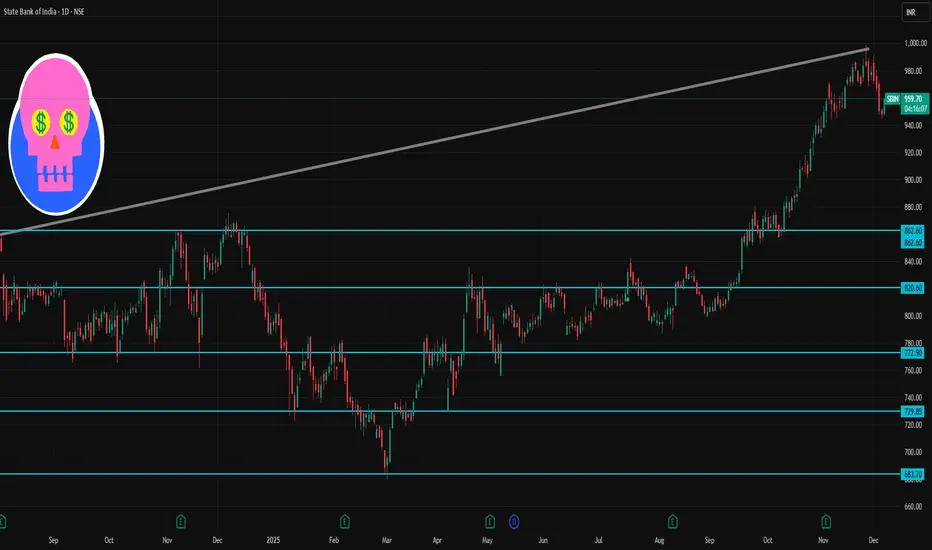
SBI 1 Day Time Frame 📌 Current Price Context
According to recent sources, SBI is trading around ₹949–₹957 (NSE/BSE) depending on the feed.
Its 52‑week trading range remains roughly ₹680 (low) to ₹999 (high).
🎯 What to Watch: Possible Scenarios
Bullish bias: If price holds above pivot (~₹988) and breaks above R1 (~₹994.5), watch for a move toward ~₹1005–₹1010+.
Neutral / Range‑bound: If price oscillates between support (~₹977–₹971) and pivot/resistance zone (~₹988–₹994), expect sideways movement.
Bearish bias: Break and close below S2/S3 (~₹971–₹960) might open downside — next major cushion near ~₹950–₹940.
Unlocking Market Rotations1. What Are Market Rotations?
Market rotations occur when institutional investors—mutual funds, hedge funds, pension funds, sovereign wealth funds—shift large pools of capital from one sector or asset class to another. These shifts often occur in anticipation of economic changes, earnings trends, or policy actions.
For example:
When interest rates fall, money flows into high-growth tech stocks.
When inflation rises, capital rotates toward commodities and energy.
During recessions, investors favor defensive sectors such as healthcare and consumer staples.
These movements create cycles of strength and weakness across different areas of the market. Traders who understand these cycles can align their portfolios with the strongest momentum and avoid sectors weak in performance.
2. Why Market Rotations Happen
Several major forces drive market rotations:
a. Economic Cycle Changes
The economy moves through phases—expansion, peak, slowdown, recession. Each phase favors different sectors:
Early expansion: cyclicals, autos, banks
Mid expansion: technology, industrials
Late expansion: energy, commodities
Recession: healthcare, utilities, FMCG
As soon as a shift is expected, institutional money rotates accordingly.
b. Interest Rate Policies
Central banks influence liquidity and risk appetite.
Lower interest rates → money flows into growth stocks, real estate, emerging markets.
Higher interest rates → money rotates into banks, value stocks, and bonds.
c. Inflation and Commodity Prices
High inflation drives rotations toward:
energy
metals
agriculture
While low inflation supports:
technology
financials
consumer discretionary
d. Global Events and Sentiment
Geopolitical tensions, elections, pandemics, supply chain disruptions—each triggers a rotation as investors reassess risk.
3. Types of Market Rotations
a. Sector Rotation
The most common form. Money shifts among stock market sectors:
Tech → Energy
Banking → FMCG
Metals → IT
And so on.
Sector rotation indicators often define the strongest opportunities in equity markets.
b. Style Rotation
Money moves between trading styles:
Growth ↔ Value
Large-Cap ↔ Mid-Cap ↔ Small-Cap
Momentum ↔ Defensive
For example, during high interest rate periods, value stocks outperform growth stocks.
c. Asset Class Rotation
Capital flows between different investment classes:
Equities → Bonds
Bonds → Commodities
Commodities → Currencies
Cryptos → Equities
Understanding these movements helps avoid holding assets during drawdowns.
d. Geographic Rotation
Investors rotate money between regions depending on economic and currency strength:
U.S. → India
Europe → Emerging Markets
China → Japan
These cycles can last months or years.
4. Unlocking Market Rotations: How Traders Identify Shifts Early
a. Leading Economic Indicators
Rotations begin before the economic data becomes obvious.
Key indicators include:
PMI (Purchasing Managers’ Index)
Inflation prints (CPI/WPI)
GDP trend forecasts
Interest rate projections
Yield curve movements
A flattening yield curve often signals a coming shift from cyclical to defensive.
b. Relative Strength Analysis
RS (Relative Strength) is one of the best tools to identify rotations.
Compare performance of sectors relative to indices:
IT vs. NIFTY
Pharma vs. NIFTY
Small-cap index vs. NIFTY50
If a sector’s RS consistently trends upward, rotation is underway.
c. Intermarket Analysis
Markets are interconnected:
Crude oil rising → energy sector strengthens
USD strengthening → commodities weaken
Yields rising → banks outperform
Studying these relationships helps detect rotation signals.
d. ETF and Sector Index Tracking
Monitoring sector ETFs and indices reveals where money is flowing.
Examples:
NIFTY IT
NIFTY BANK
NIFTY FMCG
NIFTY ENERGY
Price-volume breakouts in these indices signal institutional participation.
e. Institutional Holding Reports
Quarterly holdings (shareholding patterns) show where big funds are moving money.
Consistent increases in certain sectors are strong rotation signals.
5. The Market Rotation Cycle—Step-by-Step Breakdown
A simplified rotation cycle works like this:
1. Early Recovery
Economy stabilizes
Interest rates low
Money moves into banks, autos, real estate
2. Mid Expansion
Growth accelerates
Tech, manufacturing, industrials lead
3. Late Expansion
Inflation rises
Commodities, energy, metals outperform
4. Slowdown Phase
Earnings pressure grows
Investors move to FMCG, utilities, healthcare
5. Recession
Defensive sectors dominate
Cash, bonds, gold outperform
6. Recovery Returns
Cycle restarts.
Understanding the stage helps identify which rotation is likely next.
6. Strategies to Profit from Market Rotations
a. Sector Rotation Trading Strategy
Screen sectors with strongest RS
Identify breakout stocks within those sectors
Hold until RS weakens
Rotate into emerging leading sectors
This keeps you always aligned with institutional flows.
b. Pair Trading Between Strong and Weak Sectors
Example:
Long strongest sector (e.g., Tech)
Short weakest (e.g., Metals)
This reduces market risk while profiting from rotation.
c. Using ETFs for Simple Rotation
If stock picking is difficult, sector ETFs offer easy exposure:
Buy strongest ETF
Sell when RS declines
Move to next outperforming ETF
d. Macro Trend Based Allocation
Create a fixed allocation strategy that adjusts quarterly based on:
inflation
GDP growth
interest rates
earnings cycle
This suits long-term investors.
7. Common Mistakes in Market Rotations
Entering too late after the move has played out
Rotating based on news instead of data
Ignoring macroeconomics
Holding on to underperforming sectors hoping for reversal
Over-diversifying, which reduces ability to benefit from strong rotation cycles
Avoiding these mistakes is crucial for consistent success.
Conclusion
Unlocking market rotations is a powerful way to understand the hidden flow of institutional money. When traders learn to identify these shifts early—using economic indicators, relative strength, intermarket analysis, and sector tracking—they gain an edge most retail traders lack. Market rotations reveal where the market is heading before price alone gives the signal.
By aligning with leading sectors, rotating out of weakening ones, and tracking macro trends, traders can enhance returns, manage risk more effectively, and stay consistently ahead of market cycles.
Part 6 Learn Institutional TradingRisks & Disclosures: Essential Terms
a) Market Risk
Options move faster than stock prices; losses can be sudden.
b) Volatility Risk
Option prices are sensitive to market volatility (VIX). High volatility increases premium.
c) Time Decay (Theta)
Options lose value as expiry approaches — especially out-of-money options.
d) Liquidity Risk
Low-volume contracts may have difficulty in entering/exiting positions.
e) Assignment Risk for Sellers
Sellers can be assigned at any time on expiry day.
f) Slippage
Rapid price movements may cause orders to execute at worse prices.

Part 4 Learn Institutional TradingTrading Rules & Conditions Set by SEBI & Exchanges
a) KYC & Risk Disclosure
KYC and Risk Disclosure Documents (RDD) are mandatory before enabling F&O trading.
b) Contract Specifications
Every option contract has pre-defined:
Strike intervals
Lot size
Tick size
Expiry cycle (weekly/monthly)
c) No Guarantee of Profit
Exchanges emphasize that options are risky; brokers must warn traders.
d) No Insider Trading
Traders cannot use non-public information for trading.
e) Brokers Must Provide Transparency
Brokers need to show:
Margin reports
Contract notes
Daily ledger reports

Part 3 Learn Institutional Trading Expiry & Settlement Terms
a) Index Options (Nifty, Bank Nifty)
They are settled in cash, not in shares.
b) Stock Options
They are settled through physical delivery of shares if the contract expires in-the-money.
c) European Style Options (India)
Indian markets allow exercise only on expiry day, unlike American options (any time).
d) Premium Settlement
Premium is paid upfront while taking the position.
e) Final Settlement Price (FSP)
Exchanges calculate it based on the closing price of the underlying asset on expiry.

Part 2 Ride The Big MovesMargin Requirements: Critical Conditions
Margins are financial requirements that protect the market from defaults.
a) Initial Margin
This is required when the position is opened. It includes:
SPAN margin
Exposure margin
b) Maintenance Margin
Traders must maintain a minimum balance to keep positions open.
c) Additional Margin
If volatility increases, brokers may collect extra margins.
d) Physical Delivery Margin
Mandatory if stock options are taken near expiry.
e) Penalties
Failure to meet margin requirements leads to:
Squaring off of positions
Penalty charges
Blocking of trading account
Understanding margin rules is crucial for safe option trading.

Part 1 Ride The Big Moves Obligations of Option Sellers
Option sellers carry more responsibility:
a) Seller Must Follow Buyer’s Decision
If the buyer decides to exercise, the seller must honor the contract.
b) Unlimited Risk for Naked Sellers
Losses can be unlimited if markets move strongly against the seller.
c) Mandatory Margin Requirement
Sellers need to maintain margin balance to cover potential losses.
d) Mark-to-Market Loss Adjustments
Brokers deduct daily losses from the seller’s trading account.
e) Physical Delivery for Stock Options
For stock options close to expiry, sellers may have to deliver shares physically if the contract expires in-the-money.

Part 2 Intraday Master ClassRights of Option Buyers
Option buyers have certain rights defined by the exchange:
a) Right to Buy (Call Buyer)
The buyer can buy the asset at the strike price even if market price is higher.
b) Right to Sell (Put Buyer)
The buyer can sell at the strike price even if market price is lower.
c) No Obligation to Exercise
If the market is not favorable, traders can let the contract expire without exercising.
d) Limited Risk
The maximum loss for option buyers is the premium paid.
e) Unlimited Profit Potential
Call buyers can profit from rising markets
Put buyers can profit from falling markets
These rights are protected by the exchange, SEBI rules, and clearing corporations.

Candle Patterns Knowledge How to Use Candle Patterns in Trading
Candle patterns work best when combined with trend direction, volume, support/resistance, and market structure. Here’s how traders practically use them:
1. Always check the trend
Candlestick patterns give reliable signals only when aligned with the trend.
In uptrends, look for bullish continuation or reversal patterns.
In downtrends, look for bearish confirmation.
2. Use with support and resistance
Candle patterns at key levels are extremely powerful.
Example:
A bullish engulfing at support is much stronger than a random bullish engulfing in the middle of the chart.
3. Confirm with volume
Volume tells the strength behind the candle.
A reversal candle with high volume = strong signal
With low volume = weak signal
4. Combine with market structure
Understand whether the market is in trending, sideways, or breakout mode.
Patterns behave differently depending on structure; for example, hammers in a sideways zone might not work as well as hammers in a trending market.
5. Avoid trading based on a single candle
Candlestick patterns are helpful but should not be used in isolation. Combine with indicators like RSI, MACD, moving averages, or tools like volume profile and price action.

Premium Chart Patterns Knowledge How to Trade Chart Patterns
To trade chart patterns effectively:
A. Identify the Trend First
Reversal patterns work best after strong trends.
Continuation patterns form within established trends.
Trend context increases accuracy.
B. Wait for Confirmation
Never act only on shape.
Confirmation includes:
Breakout from neckline or trendline
Increase in volume
Candle close beyond levels
C. Set Entry Points
Examples:
Breakout above resistance (for bullish patterns)
Breakdown below support (for bearish patterns)
D. Stop Loss Placement
Stops should go:
Below breakout candle (bullish)
Above breakout candle (bearish)
Below/above swing points
Patterns help define natural risk zones.
E. Target Calculation
Most patterns offer measurable targets:
Double top/bottom: Height of pattern projected from breakout
Triangles: Base length projected from breakout
Flags: Length of flagpole added to breakout
This helps set realistic profit expectations.

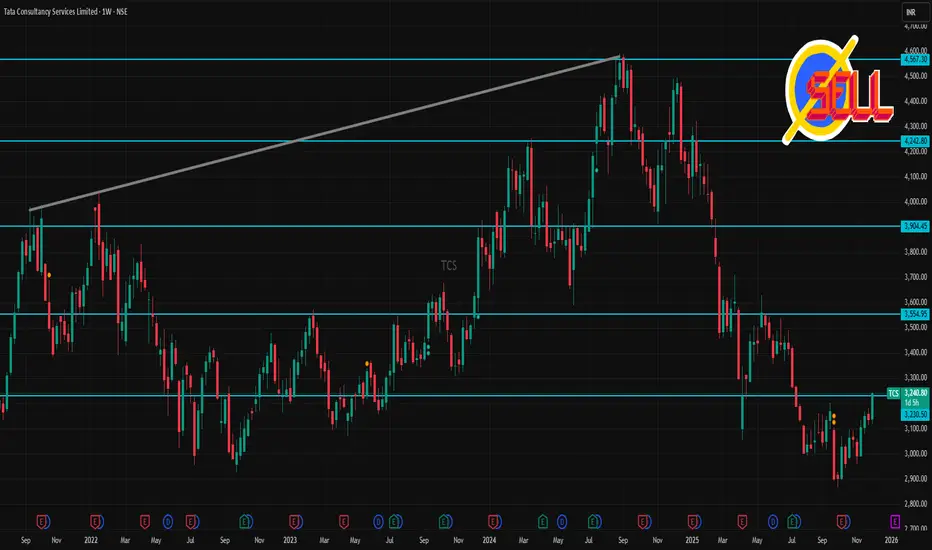
TCS 1 Week Time Frame 🔎 Recent snapshot
According to a recent technical‑analysis update, TCS has support near ₹2,970–₹2,870 and resistance near ₹3,170, ₹3,207, ₹3,270 on the shorter‑term charts.
On a weekly / medium‑term view, some oversold‑indicator signals have been flagged, suggesting the stock could attempt a rebound if support holds.
Analysts’ longer‑term target (12‑month) sits around ₹3,505–₹3,470, implying moderate upside from current levels.
⚠️ What could derail upside
If the stock falls below the lower support of ~₹2,870‑₹2,950, it may test deeper support zones.
Mixed signals from oscillators (some suggest bearish momentum) could limit strong short‑term rallies.
🎯 My take (for 1‑week traders)
TCS seems to be in a consolidation/neutral posture — the next few days could be defined by support‑vs‑resistance play. If you trade short‑term, the ~₹3,030–₹3,170 band defines a likely “play zone.” A decisive move beyond that could hint at short‑term trend direction.
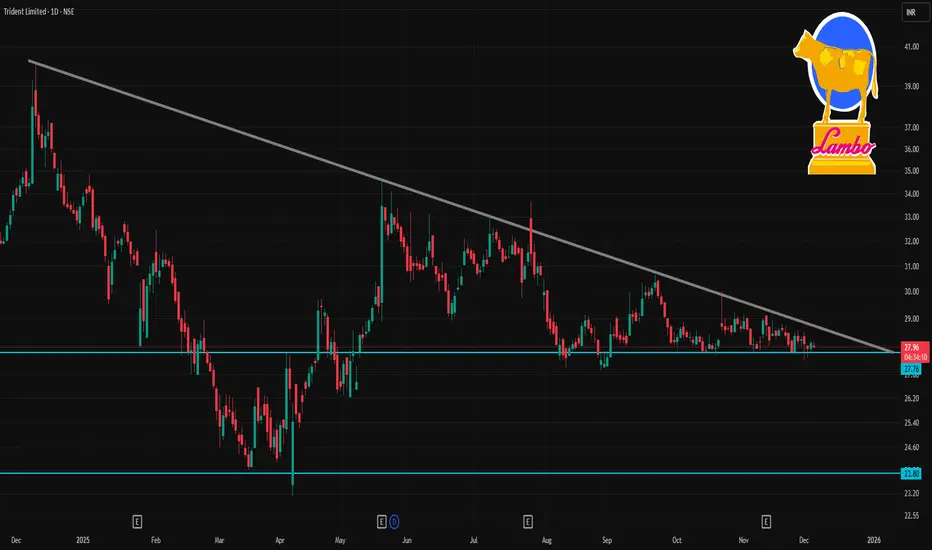
TRIDENT 1 Day Time Frame 📌 Key data
Current price: ~₹28.2.
52-week high / low: ₹40.20 / ₹23.11.
🧭 Pivot / Support / Resistance (1-day based)
Based on a daily pivot-point analysis:
Level Price
Pivot (daily mid) ~ ₹28.02
Resistance 1 (R1) ~ ₹28.32
Resistance 2 (R2) ~ ₹28.53
Support 1 (S1) ~ ₹27.81
Support 2 (S2) ~ ₹27.51
Because the stock is already around ₹28.2, intraday traders might treat ~₹28.5 as a near-term resistance, and ~₹27.5–₹27.8 as the support zone (on a breakdown).
⚠️ What to watch / Risks
Technical signals are mixed: some moving averages are “outperform/positive”, but many oscillators and technical-indicator-based services are still flagging a “sell/neutral” bias on the daily chart.
The stock has underperformed over long term — price is much below 52-wk high, returns have been weak — so volatility or broader market sentiment could sway levels significantly.
PCR Trading Strategies Tips to Increase Your Profitability
✓ Trade with trend
Avoid buying OTM options randomly. Wait for momentum.
✓ Use volume profile & market structure
This helps identify breakout zones, reversal points, and premium traps.
✓ Avoid trading against volatility
Buy in low IV, sell in high IV.
✓ Don’t hold losing positions
Options decay fast → exit quickly if the market goes against you.
✓ Use hedged strategies
Spread strategies reduce risk and stabilize profits.

Divergence Secrets How Volatility Affects Profits
Volatility (VIX or IV) is another major factor.
You profit when:
IV goes up after you buy options
IV goes down after you sell options
High volatility = high premium
Low volatility = low premium
This is why buying options ahead of big events (Budget, elections, results) is riskier—IV may crash afterward.

Understanding Position Sizing in Trading in the Indian Market1. Importance of Position Sizing
Position sizing is often overlooked by novice traders who focus solely on entry and exit strategies. However, the size of the position directly impacts the risk of the trade. Key reasons why position sizing is important include:
Risk Management: A well-calculated position limits losses in case a trade goes against the trader’s expectations. For instance, allocating too much capital to a single trade can lead to significant drawdowns.
Capital Preservation: Protecting trading capital is essential for survival in the market. Indian markets, like the NSE and BSE, can experience volatility due to economic announcements, geopolitical events, or corporate earnings, making capital preservation critical.
Psychological Comfort: Traders are more confident when risk is controlled. Proper position sizing reduces stress and emotional decision-making, which often leads to impulsive trades.
Consistent Profitability: Correct position sizing ensures that even if some trades fail, profits from winning trades can compensate, leading to overall consistent performance.
2. Factors Affecting Position Sizing in India
Several factors influence how traders should determine their position size in Indian markets:
Total Trading Capital: The overall portfolio size is the starting point. A trader with ₹10 lakh should consider different risk parameters than someone trading with ₹1 lakh.
Risk Per Trade: Most professional traders risk 1-3% of their capital per trade. For example, with ₹10 lakh capital, risking 2% per trade means the maximum loss per trade should not exceed ₹20,000.
Volatility of the Asset: Indian stocks, especially mid-cap and small-cap stocks, can be highly volatile. Highly volatile stocks require smaller position sizes to limit risk.
Stop-Loss Level: The distance between entry price and stop-loss price determines the potential loss per share. A tight stop-loss allows a larger position, while a wider stop-loss requires a smaller position size.
Market Type: Equities, derivatives, and commodities have different leverage and risk profiles. Futures and options in NSE can amplify gains and losses, so position sizing must account for margin requirements and leverage.
3. Position Sizing Methods
Several methods are commonly used by traders in India to calculate position size:
a) Fixed Dollar/Fixed Rupee Method
This method involves risking a fixed amount per trade, regardless of the stock price. For example, a trader decides to risk ₹10,000 per trade. This ensures that losses remain controlled, but it may not adjust for the volatility of different stocks.
B) Volatility-Based Position Sizing
In volatile Indian stocks, traders adjust position size according to the stock’s volatility. Average True Range (ATR) is often used to measure volatility. Highly volatile stocks receive smaller positions, and low-volatility stocks allow larger positions.
C) Kelly Criterion
The Kelly formula is a mathematical approach to maximize capital growth while managing risk. It calculates the optimal fraction of capital to invest based on win probability and reward-to-risk ratio. While precise, it is complex and often adjusted downwards to reduce risk in real-world trading.
4. Position Sizing in Indian Equities
Equity trading in India involves direct stock purchases or trades in derivatives like futures and options. Key considerations include:
Large-Cap vs Mid/Small-Cap: Large-cap stocks like Reliance, HDFC Bank, and Infosys are relatively less volatile, allowing slightly larger positions. Mid-cap and small-cap stocks require smaller position sizes due to higher volatility.
Liquidity Consideration: Stocks with higher trading volumes on NSE or BSE are easier to enter and exit. Illiquid stocks require smaller positions to prevent slippage.
Earnings Announcements & News: Indian markets are sensitive to corporate earnings, RBI announcements, and macroeconomic policies. Position size should be smaller when such events are expected to avoid excessive risk.
5. Position Sizing in Indian Derivatives Market
Trading in futures and options introduces leverage, which magnifies both profits and losses. Therefore:
Futures Contracts: Each NSE futures contract represents a certain number of shares. Traders must calculate potential loss using stop-loss levels and margin requirements before deciding the number of contracts.
Options: Buying call or put options involves premium risk. Traders risk only the premium paid but can adjust the number of contracts to align with their risk tolerance. Writing options carries unlimited risk, so extremely conservative position sizing is required.
Margin Leverage: Indian brokers offer leverage in derivatives. Traders should avoid over-leveraging by keeping a fraction of capital as margin buffer.
6. Practical Tips for Indian Traders
Start Small: Beginners should trade small positions to understand market behavior and manage psychological pressure.
Use Stop-Loss Religiously: Position size is ineffective without a stop-loss. NSE and BSE allow intraday stop-loss orders for risk management.
Diversify: Avoid concentrating positions in a single stock or sector. Diversification reduces unsystematic risk.
Adjust for Volatility: Use ATR or standard deviation to modify position size according to stock volatility.
Review Regularly: Position sizing is not static. Recalculate it based on changes in portfolio size, market volatility, and trading performance.
Leverage Awareness: Avoid using maximum leverage in futures or options. Keep leverage proportional to risk tolerance.
7. Common Mistakes in Position Sizing
Overtrading: Taking large positions on multiple trades simultaneously increases portfolio risk.
Ignoring Volatility: Treating all stocks equally regardless of volatility can lead to excessive losses.
No Risk Assessment: Entering trades without calculating potential loss per trade is a common mistake.
Emotional Adjustments: Increasing position size impulsively after a winning streak often leads to severe drawdowns.
8. Conclusion
Position sizing is the backbone of successful trading in the Indian markets. Whether trading equities, futures, options, or commodities, controlling the size of your positions relative to risk ensures long-term sustainability and profitability. It combines risk management, market knowledge, and psychological discipline. By using percentage risk, volatility-based, or fixed-amount methods, Indian traders can optimize returns while protecting capital.
A disciplined approach to position sizing transforms trading from speculation into a structured and controlled activity. It ensures that no single trade can wipe out your portfolio and allows traders to withstand market volatility, ultimately leading to consistent growth in the Indian market.

Best Trading Strategies Used by Traders in Financial Markets1. Trend Following Strategy
The trend following strategy is based on the principle that prices tend to move in sustained trends rather than randomly. Traders using this approach attempt to enter trades in the direction of the prevailing trend and ride the movement until signs of reversal appear.
Key tools: Moving averages (SMA, EMA), trendlines, MACD, ADX.
How it works: Traders identify a strong uptrend or downtrend. For example, in an uptrend, they look for price pullbacks to enter long positions. Conversely, in a downtrend, they short sell during price rallies.
Advantages: Works well in trending markets and allows traders to capture significant portions of price moves.
Challenges: Can produce false signals in sideways or choppy markets. Patience is required to let trends develop.
2. Swing Trading
Swing trading focuses on capturing medium-term price movements, typically lasting from a few days to several weeks. Swing traders aim to profit from price “swings” within a broader trend, combining technical analysis with market sentiment insights.
Key tools: Candlestick patterns, support and resistance levels, RSI, Fibonacci retracement.
How it works: Traders identify potential reversals at key support or resistance zones and enter trades aligned with the expected swing. For example, after a stock bounces from a support level, a swing trader may go long anticipating a short-term upward movement.
Advantages: Less time-intensive than intraday trading; allows participation in significant market moves.
Challenges: Overnight risk and exposure to market gaps can affect positions; requires solid risk management.
3. Intraday or Day Trading
Day trading involves buying and selling financial instruments within the same trading day. The goal is to profit from short-term price fluctuations while avoiding overnight market risk.
Key tools: Real-time charts, volume analysis, VWAP, Bollinger Bands, Level II quotes.
How it works: Traders identify high-probability trades based on intraday trends, price patterns, or news. Trades are opened and closed within hours or minutes.
Advantages: Immediate results and no overnight risk. Allows traders to capitalize on volatility.
Challenges: Requires constant monitoring, discipline, and quick decision-making. Transaction costs and emotional stress can be high.
4. Scalping Strategy
Scalping is an ultra-short-term trading strategy aimed at taking advantage of small price movements multiple times during the day. Scalpers execute dozens or even hundreds of trades in a single session.
Key tools: Tick charts, Level II data, order flow analysis.
How it works: Traders enter positions for just a few seconds or minutes to capture minor price changes. High leverage is often used to amplify small gains.
Advantages: Small, frequent profits can accumulate quickly; less exposure to market risk due to short holding periods.
Challenges: Demands extreme focus, rapid execution, and low-latency platforms. High transaction costs can reduce profitability.
5. Breakout Strategy
Breakout trading seeks to capitalize on price movements when an asset breaks through a key support, resistance, or consolidation range. Breakouts often indicate strong momentum and potential trend continuation.
Key tools: Horizontal support/resistance levels, Bollinger Bands, volume indicators.
How it works: Traders monitor consolidation zones and place trades when the price breaks above resistance (long) or below support (short). Volume confirmation is crucial to avoid false breakouts.
Advantages: Can generate large profits if momentum continues; simple to implement with clear entry and exit rules.
Challenges: False breakouts can lead to losses; requires careful position sizing and stop-loss placement.
6. Momentum Trading
Momentum traders exploit stocks or assets showing strong directional movement. This strategy assumes that assets with recent strong performance will continue moving in the same direction in the short term.
Key tools: RSI, MACD, moving averages, relative volume.
How it works: Traders identify securities with increasing volume and price momentum, entering trades in the direction of the trend. Exit decisions are based on signs of weakening momentum or overbought/oversold conditions.
Advantages: Profits from strong trends and market sentiment; suitable for volatile markets.
Challenges: Momentum can reverse suddenly; risk management is crucial to protect profits.
7. Mean Reversion Strategy
Mean reversion is based on the idea that prices tend to revert to their historical average over time. Traders using this approach buy undervalued assets and sell overvalued ones relative to their average price.
Key tools: Bollinger Bands, moving averages, RSI.
How it works: When the price deviates significantly from its average, traders enter positions expecting a reversal. For example, if a stock price falls far below its 50-day moving average, it may rebound, presenting a buy opportunity.
Advantages: Effective in range-bound or sideways markets; helps exploit temporary mispricings.
Challenges: Market trends can override mean-reversion signals, causing losses.
8. Position Trading
Position trading is a long-term strategy where traders hold positions for weeks, months, or even years, based on fundamental or technical trends. Unlike swing or intraday trading, position trading is less concerned with short-term fluctuations.
Key tools: Fundamental analysis, macroeconomic indicators, trendlines, moving averages.
How it works: Traders analyze long-term trends, company fundamentals, or macroeconomic data to enter positions with an extended holding period. Stop-losses and risk management are essential to mitigate adverse moves.
Advantages: Less time-intensive; profits from long-term trends.
Challenges: Requires patience and capital; susceptible to market shocks.
9. Algorithmic or Automated Trading
Algorithmic trading uses computer programs to execute trades based on predefined rules and quantitative models. It can include high-frequency trading, arbitrage, and trend-following algorithms.
Key tools: Quantitative models, APIs, machine learning, historical data analysis.
How it works: Algorithms analyze market data in real-time and execute trades automatically when conditions are met. Parameters such as entry price, stop-loss, and take-profit are predefined.
Advantages: Removes emotional bias, ensures fast execution, and can process vast data.
Challenges: High technical expertise required; system failures or market anomalies can result in losses.
10. Risk Management Across Strategies
Regardless of the strategy, risk management is critical. Techniques include:
Stop-loss orders: Automatically exit trades to limit losses.
Position sizing: Adjust trade size based on account size and risk tolerance.
Diversification: Spread risk across assets, sectors, or instruments.
Risk-reward ratio: Target trades where potential profit outweighs potential loss, ideally 2:1 or higher.
Psychological discipline: Avoid overtrading, emotional decision-making, or chasing losses.
Conclusion
There is no single “best” trading strategy suitable for everyone. Success in trading depends on matching a strategy with your personality, time availability, market knowledge, and risk tolerance. Trend-following, swing trading, and breakout strategies suit those who can analyze charts and trends, while day trading and scalping require high focus and rapid decision-making. Momentum and mean-reversion strategies cater to traders exploiting specific market behaviors, whereas position trading and algorithmic trading appeal to those focused on long-term trends or systematic execution.
Ultimately, combining a robust trading strategy with disciplined risk management, continuous learning, and psychological control creates the foundation for sustainable trading success. Traders who adapt their approach to changing market conditions and remain consistent in execution tend to outperform those chasing quick wins without a structured plan.