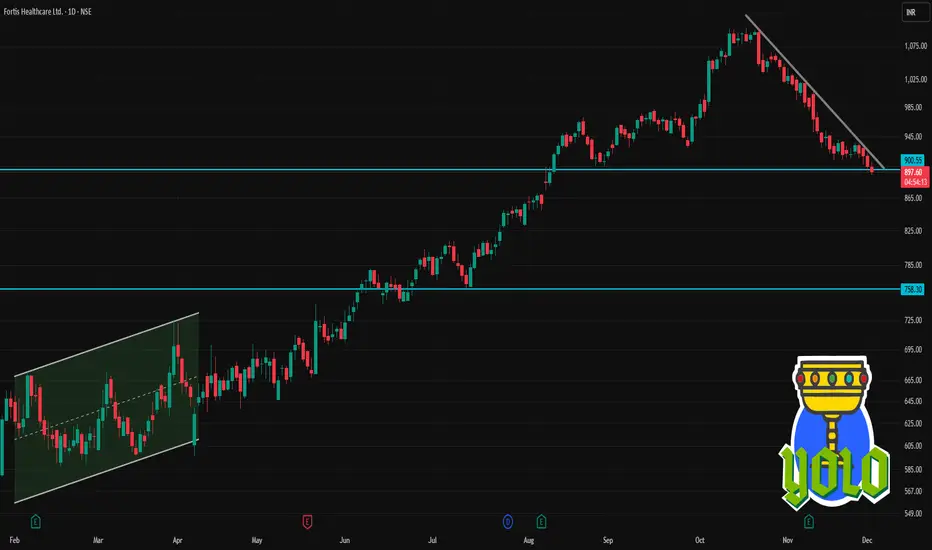
FORTIS 1 Day Time Frame 📈 Recent Price & Context
Last closing price was ~ ₹904.85.
52-week range: Low ≈ ₹577, High ≈ ₹1,104.30.
The stock has corrected from recent highs — showing some weakness in the near term.
🧭 What It Means (For Traders)
For a day-trader / intraday: watch pivot + support/resistance zones (≈ ₹908 pivot; ₹895/886 supports; ₹918/931 resistances). Use tight stop-loss near support for longs.
For a swing-trader / short-term horizon (few days to 1–2 weeks): current bearish indicators suggest caution — better to wait for a clear bounce above ~₹918–930 range or a confirmed breakdown below ~₹886 to decide direction.
Keep an eye on broader market sentiment & sector news — hospital/health-care stocks often react to regulatory or news events which can override technicals.
Trendcontinuation
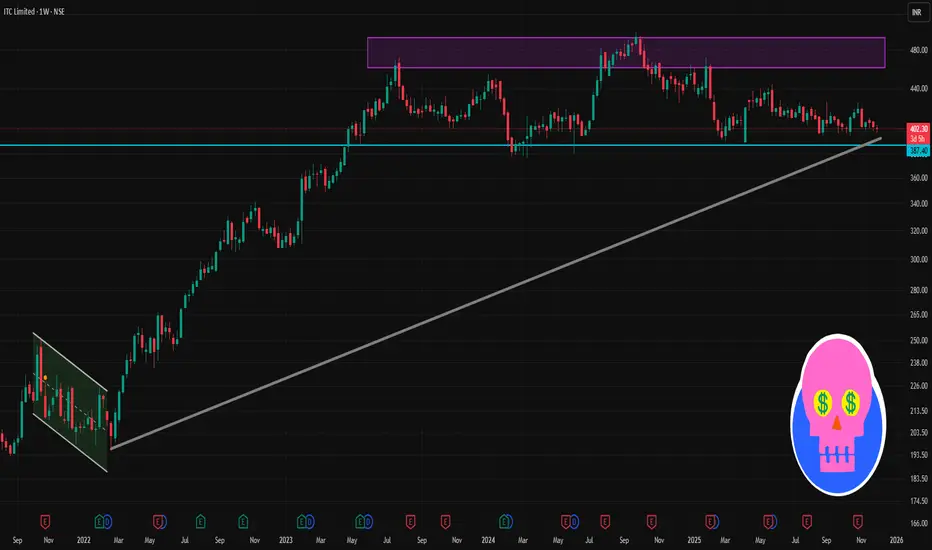
ITC 1 Week Time Frame 📈 Recent 1-Week Performance
Around Dec 2 2025, ITC is trading ~ ₹403–404.
Over last 1 week, the stock has moved up roughly +0.5 % to +0.6 % according to available weekly return data.
The 7-day exponential moving average (EMA) is also near ~₹402 — which suggests price is close to short-term average, not showing sharp divergence yet.
✅ What Price Action Would Suggest
If price holds above ₹402–403 and breaks above ₹405–407, that could indicate short-term bullish bias.
If price falls below ₹400, watch for possible further drop — support zone is ~₹398; a sharp break could shift short-term sentiment negative.
If price consolidates between ~₹402 and ~₹407, expect range-bound behaviour until a clear breakout or breakdown.
Part 1 Ride The Big Moves Types of Option Strategies
Options allow traders to combine multiple positions to create strategies based on volatility, direction, or time decay.
Here are some popular ones:
1. Buying Calls and Puts
The simplest form. Good for beginners and directional traders.
2. Selling Options
You earn premium.
Risk is higher, so proper strategy and stop-loss are needed.
3. Spreads
Involves buying one option and selling another.
Examples:
Bull call spread
Bear put spread
Credit spreads
These reduce risk and premium cost.
4. Straddle
Buying both call and put at the same strike.
Used when expecting big movement but unsure about direction.
5. Strangle
Similar to straddle but with different strikes.
6. Iron Condor
A non-directional strategy used to profit when the market stays in a narrow range.
Options allow both beginners and advanced traders to adjust risk, reward, and probability.

Small Account Challenges for Indian Traders1. Limited Capital and High Risk Exposure
The primary and most obvious challenge for small account traders is limited capital. With a small account, traders are compelled to take higher risk positions, which often leads to:
A. Overleveraging
Indian brokers offer leverage mainly for intraday equity trades, but in recent years, SEBI regulations have significantly reduced the leverage available.
Small account traders often feel forced to:
Use full margin or near-full margin
Take oversized positions to achieve meaningful returns
Try to flip positions quickly to cover brokerage, taxes, and charges
This increases the probability of a margin call or forced liquidation.
B. Inability to Absorb Drawdowns
Markets naturally move in cycles of profits and losses. A small loss of ₹500 may be negligible for a trader with ₹5 lakh capital but can feel devastating for someone starting with ₹5,000.
This creates emotional stress and leads to irrational decisions like revenge trading.
2. Brokerage, Taxes, and Trading Charges Eat Into Profits
Trading in India involves multiple cost elements:
Brokerage
STT/CTT
Exchange Transaction Charges
GST
SEBI Fees
Stamp Duty
Slippage
For small accounts, these charges form a disproportionately large percentage of the capital. For example:
A trader with ₹10,000 may lose up to 1–2% per trade in costs alone.
Frequent intraday trading becomes unviable when costs exceed potential profits.
This pushes many small account traders toward high-risk segments like options buying, which has lower capital requirements but high volatility.
3. Pressure to Make Quick Profits
Indian traders with small accounts often enter the market with the mindset:
“I need to double this account fast.”
“I want to make monthly income from ₹10,000 capital.”
“I will start small and become full-time in a few months.”
This creates unrealistic expectations, leading to:
Overtrading
Aggressive option buying
Fear of missing out (FOMO)
Emotional swings
Impulsive decisions
The expectation to grow capital rapidly is one of the biggest psychological traps.
4. Limited Access to Diversification
With small capital, it’s difficult to diversify across:
Stocks
Sectors
Time frames
Trading strategies
Most small traders put all their capital into a single stock or a single futures or options position, which increases portfolio risk dramatically. A single bad trade can wipe out the account.
5. Options Buying Addiction
Because equity and futures require higher capital, small traders gravitate toward options buying, particularly:
Weekly Nifty/Bank Nifty options
Zero day expiry (0DTE) trades
Far OTM options
While these instruments offer high reward potential, they also carry:
Very fast time decay
High volatility risk
Frequent whipsaws
Low probability of consistent profitability
Most small account traders get trapped in a cycle of quick profits followed by large losses, ultimately destroying their capital.
6. Difficulty Implementing Proper Risk Management
Risk management requires rules like:
Risk 1–2% per trade
Maintain stop-loss discipline
Control position size
However, with small accounts, applying these rules becomes nearly impossible.
For example, with ₹10,000 capital:
1% risk = ₹100
Most trades cannot be structured within such tight risk limits
Even brokerage and charges exceed the risk budget
Thus, small traders are almost forced to violate risk rules, making professional-level discipline difficult to maintain.
7. Emotional and Psychological Challenges
Small account trading is mentally draining because:
Every loss feels bigger than it is.
Every profit seems insufficient.
A few losing trades can wipe out weeks of effort.
Fear of losing capital creates hesitation.
Greed pushes traders to take oversized bets.
This emotional instability leads to:
Overtrading
Lack of patience
Jumping between strategies
Chasing trending stocks
Continual strategy switching
Psychology becomes a greater barrier than capital itself.
8. Limited Access to Tools, Data, and Learning Resources
Professional traders use:
Advanced charting platforms
Real-time data feeds
Premium screeners
Algorithms and automation
Backtesting tools
For a small account trader, these tools feel expensive and unaffordable.
As a result, they rely on:
Free charting websites
Social media tips
Influencer trades
Telegram groups
Many of these sources are unreliable, biased, or manipulated.
9. Lack of Experience in Market Cycles
Small traders often enter the market during bull phases, where:
Almost every trade gives profit
Stocks keep rising
Market sentiment is positive
When the market shifts into a volatile or bearish phase, small traders struggle to adapt.
They lack experience in handling:
Downtrends
Range-bound markets
High volatility periods
Event-driven uncertainty
This inexperience leads to heavy losses.
10. Compounding Takes Time—People Want Immediate Results
Growing a small account through disciplined compounding requires:
Patience
Persistence
Realistic targets
Long-term vision
However, many small traders want:
Quick doubling
Daily profits
Constant action
High returns instantly
This mindset contradicts the reality of compounding, which is slow but powerful over time.
11. Social Pressure and Unrealistic Comparisons
Many traders compare themselves to:
Influencers showing big profits
Experienced traders posting daily screenshots
People claiming to double accounts regularly
This comparison creates unnecessary pressure, causing small traders to take irrational risks just to match those results.
Most don’t realize that successful traders today started small themselves—but with years of experience.
Conclusion
Small account trading is challenging in India due to limited capital, high transaction costs, emotional stress, and structural market restrictions. However, success is still possible with realistic expectations, disciplined risk management, and a focus on long-term skill development instead of quick profits.
By understanding these challenges deeply, Indian traders can avoid common traps, preserve their capital, and slowly build a strong foundation for future growth.
Global Market Shifts1. Technological Acceleration and Digitalization
Technology is one of the most powerful drivers of global market shifts. The acceleration of artificial intelligence, automation, blockchain, robotics, and data analytics is redefining industries from manufacturing to banking.
Automation has altered the cost dynamics of production, enabling companies to relocate certain activities back to their home countries despite previously outsourcing them to low-cost regions. This phenomenon, often referred to as reshoring or nearshoring, is driven by the desire for supply chain resilience and reduced dependency on global disruptions.
The digital economy has also enabled new business models. E-commerce, online services, cloud computing, and fintech innovations have created trillion-dollar markets and revolutionized consumer behavior. From remote work to digital payments, technology is not only transforming markets—it is reshaping the very structure of the global workforce and how companies operate.
Artificial intelligence has become a strategic asset for nations. Countries are competing to develop advanced AI capabilities, which has deep implications for productivity, defense, and global leadership. As AI integrates deeper into supply chains and decision-making, markets will continue to shift around countries with the most advanced digital infrastructure and innovation ecosystems.
2. Geopolitical Realignments and Trade Fragmentation
Global markets are increasingly influenced by geopolitics. Traditional alliances are being restructured, rivalries are intensifying, and economic power is becoming more multipolar.
The most notable geopolitical shift involves strategic competition between major powers—especially between large economies such as China, the United States, and other emerging regions. Trade wars, tariff battles, technology restrictions, and security concerns have introduced new uncertainties into global markets.
Countries are seeking strategic autonomy by diversifying their economic dependencies. This has resulted in the rise of regional trading blocs, bilateral agreements, and supply-chain partnerships based on political alignment rather than pure efficiency.
As global economic integration slows, companies must adapt to a fragmented trading environment where geopolitical risks directly impact currency markets, commodity prices, financial flows, and investment decisions.
3. Monetary Policy Shifts and Inflation Cycles
A major global market shift arises from changes in monetary policy, particularly from central banks in advanced economies. Inflation surges and interest rate cycles influence everything from asset valuations to consumer borrowing costs.
In recent years, inflation has resurfaced as a central challenge. Central banks responded with aggressive interest rate hikes, reshaping equity markets, bond yields, housing sectors, and currency movements.
Higher interest rates tend to strengthen currencies, reduce liquidity, increase the cost of capital, and cool down overheated markets. As rates rise or fall, global investors reallocate funds across emerging and developed markets.
These monetary shifts ripple through the world economy, affecting trade balances, debt sustainability, and foreign investment flows. Countries with high levels of external debt face heightened vulnerability when global liquidity tightens.
4. Supply Chain Reconfiguration
The global supply chain system that dominated the last few decades is undergoing significant transformation. For years, companies optimized supply chains for efficiency and low cost, relying heavily on global production networks.
However, recent disruptions—ranging from pandemics to shipping bottlenecks and geopolitical tensions—highlighted the fragility of hyper-globalized supply systems.
This has led to several structural shifts:
Reshoring: Bringing production back to home countries.
Nearshoring: Moving manufacturing closer to major consumer markets.
Friendshoring: Sourcing from politically aligned nations.
Multi-sourcing: Avoiding reliance on single suppliers.
Supply chains are becoming more diversified and resilient, but this transition increases costs in the short term. Markets are adjusting to a new reality where security and predictability often outweigh efficiency.
Industries like semiconductors, pharmaceuticals, EV batteries, and critical minerals are at the center of this supply chain revolution.
5. Energy Transition and Sustainability Trends
Another major global market shift is the transition from fossil fuels to cleaner energy sources. Climate change concerns, government mandates, and consumer expectations have accelerated the shift toward renewable energy, electric vehicles, sustainable manufacturing, and green finance.
Countries are investing billions in solar power, wind energy, hydrogen, and other low-carbon solutions. The energy transition is also reshaping commodity markets. Demand for oil may fluctuate, while demand for metals like lithium, cobalt, nickel, and rare earth elements is increasing rapidly.
Companies across all sectors are facing pressure to reduce emissions, adopt ESG (Environmental, Social, Governance) frameworks, and disclose carbon footprints. As sustainability becomes a competitive advantage, global capital is flowing towards greener projects.
This transition is not uniform. Some regions move faster while others rely on traditional energy sources. This creates a dynamic global landscape where new energy leaders emerge while others adapt gradually.
6. Shifting Consumer Preferences and Demographics
Global demographics are changing dramatically. Developed countries face aging populations, while emerging markets have young, expanding workforces. Consumption patterns are shifting accordingly.
Younger generations prioritize digital-first experiences, eco-friendly products, and personalized services. Meanwhile, rising middle classes in developing countries are driving demand for technology, healthcare, transportation, and modern retail.
The global consumer is becoming more interconnected yet more diverse. Companies must navigate cultural preferences, regulatory environments, and economic conditions across different markets.
These demographic forces have long-term implications, influencing everything from labor markets and productivity to healthcare demand and real estate trends.
Conclusion
Global market shifts are the result of multiple interconnected forces—technological innovations, geopolitical changes, monetary cycles, supply chain strategies, energy transitions, and evolving consumer behaviors.
Today’s world is moving away from a singular globalized model toward a more complex, multipolar system defined by resilience, regional alliances, and digital transformation. Understanding these shifts is essential for navigating investment decisions, business strategies, and policy development.
In this rapidly changing environment, adaptability, foresight, and innovation will define success for nations, companies, and individuals alike.

Algorithmic and Momentum Trading Rising1. What Is Algorithmic Trading?
Algorithmic trading (or algo-trading) refers to using computer-coded rules to automate buying and selling of financial assets. These rules can be based on price, volume, statistical models, timing, or complex machine-learning algorithms.
Key characteristics include:
Speed: Orders are executed in microseconds.
Consistency: Trades follow predefined rules, removing psychological biases.
Scalability: Algorithms can execute thousands of trades across multiple exchanges simultaneously.
Cost efficiency: Minimizes impact cost, slippage, and human error.
Algo-trading today accounts for 50–70% of equity trades in developed markets and is growing rapidly in emerging markets such as India.
2. Momentum Trading as a Subset
Momentum trading is a strategy that capitalizes on price continuation—the idea that assets that have been rising tend to continue rising, and those falling often continue falling.
Momentum algos typically look for:
Strength or weakness in price trends
Breakouts above resistance or breakdowns below support
Relative strength vs. benchmark
Volume surges
Volatility expansion
Trend acceleration
Because momentum signals can be quantified mathematically, they are ideal for automation. This has made momentum algos a core part of many funds, including quant funds, hedge funds, and proprietary trading desks.
3. Why Algorithmic and Momentum Trading Are Growing
A. Explosion in Computing Power
Advances in processing speed and cloud computing make it easy to run complex models and execute trades at lightning speeds. What once required supercomputers can now be done on commercial servers.
B. Availability of Big Data
High-frequency tick data, order book depth, alternative data, social sentiment, and satellite imagery have become widely accessible. Algorithms thrive on such datasets.
C. Lower Transaction Costs
Brokerage fees, exchange fees, and data costs have decreased. Automation reduces human labour cost, making quant trading highly economical.
D. Rise of Quant Funds
Hedge funds like AQR, Renaissance Technologies, D.E. Shaw, and others have popularized quantitative and momentum-driven strategies. Many smaller funds now replicate similar frameworks.
E. Regulatory Push
Many regulators promote transparency and electronic trading (e.g., India’s NSE/BSE). New platforms and API-based access encourage algorithmic participation.
F. Growth of Retail APIs
Retail traders increasingly use brokers offering:
Kite Connect
Interactive Brokers API
Upstox API
TD Ameritrade API
This democratises algorithmic execution, once available only to institutions.
4. How Algorithmic and Momentum Trading Work
Step 1: Signal Generation
The algorithm identifies opportunities using rules such as:
20-DMA crossing 50-DMA
RSI crossing above 60
Price breaking above 200-day high
VWAP deviations
Regression-based predictions
Machine learning-based forecasts
Step 2: Position Sizing
The algo determines how much to buy or sell based on:
Account equity
Risk limits
Stop loss placement
Market volatility
Portfolio exposure
Step 3: Execution Algorithms
These algorithms break orders into smaller parts and execute optimally:
VWAP (Volume Weighted Average Price)
TWAP (Time Weighted Average Price)
POV (Percentage of Volume)
Smart order routing across exchanges
Step 4: Risk Management
Algo trading uses automatic controls such as:
Dynamic stop loss
Max daily drawdown
Volatility filtering
Circuit breaker detection
Reversion flags
Step 5: Trade Exit
Momentum strategies exit when:
Trend weakens
Price hits stop loss or target
Reversal signals appear
Momentum score declines
5. Market Impact of Rising Algo and Momentum Trading
A. Improved Liquidity
Algorithms supply continuous buying and selling volumes, narrowing bid-ask spreads. High-frequency market makers especially contribute to deep order books.
B. Faster Price Discovery
Information is absorbed into prices almost instantly because algos constantly react to new data. Markets become more efficient.
C. Increased Short-Term Volatility
While overall efficiency improves, short bursts of volatility—often triggered by momentum algos—can cause rapid market swings. Examples include:
Flash crashes
Sudden spikes during economic data releases
Momentum cascades
D. Herd Behaviour
Many momentum algorithms follow similar market signals (e.g., breakout, trend following). When they activate simultaneously, they may amplify trends.
E. Reduced Human Discretion
Traditional discretionary traders are increasingly replaced by quant models. Human-executed trades are slower, costlier, and often less accurate.
6. Advantages of Momentum and Algorithmic Trading
1. Discipline and Removal of Emotions
Algorithms follow rules precisely, avoiding psychological biases like fear, greed, and impulsiveness.
2. Backtesting and Optimization
Strategies can be validated on historical data before deployment, reducing risks of poor performance.
3. Ability to Trade Multiple Markets
A single algorithm can trade:
Equity
Futures
Commodities
FX
Crypto
Global indices
simultaneously.
4. Speed and Precision
Algorithms can react to micro-changes in price faster than any human.
5. Increased Profit Potential
Momentum strategies excel in trending markets and can capture large directional moves with speed and accuracy.
7. Challenges and Risks
Despite its advantages, algorithmic and momentum trading face significant risks.
A. Over-Optimization
Strategies that are fine-tuned on past data may fail in real markets (“curve-fitting”).
B. Market Structure Dependence
Momentum strategies often struggle in:
Sideways markets
Sudden reversals
High-volatility whipsaws
C. Technology Risk
Server failure, broker downtime, API issues, or hardware malfunction can lead to significant losses.
D. Liquidity Shocks
When multiple momentum strategies unwind simultaneously, they can cause rapid market collapse.
E. Regulatory Scrutiny
Regulators monitor algos for:
Spoofing
Layering
Excessive order modifications
Market manipulation
F. Competition
As more traders adopt similar strategies, profit margins decrease (“alpha decay”).
8. The Future of Algorithmic and Momentum Trading
The next stage of evolution will be driven by:
1. Artificial Intelligence & Deep Learning
AI models learn complex, non-linear patterns beyond traditional momentum indicators.
2. Alternative Data
Satellite images, IoT sensors, credit card spending patterns, and sentiment analysis are increasingly used for momentum prediction.
3. Autonomous Trading Systems
Systems capable of adapting and evolving in real-time without manual input will dominate high-frequency markets.
4. Retail Algo Revolution
With easy API access, retail algo adoption is accelerating, especially in markets like India, the US, and Europe.
5. Integration with Options & Derivatives
Momentum algos are moving into options-based volatility strategies, hedging models, and automated spreads.
Conclusion
Algorithmic and momentum trading are rapidly reshaping global financial markets. They provide speed, efficiency, precision, and scalability that human traders cannot match. While they improve liquidity and price discovery, they also introduce new challenges such as flash crashes, herd behaviour, and technological risks.
As technology continues to evolve—through AI, big data, and cloud computing—algorithmic trading will become even more dominant. Momentum strategies, supported by sophisticated analytics and automation, are likely to remain one of the most powerful and widely used trading approaches in the modern financial landscape.
Option Trading Strategies What Are Options?
Options are financial contracts that give you the right, but not the obligation, to buy or sell an asset at a pre-decided price within a specific timeframe.
There are two main types:
1. Call Option
A call option gives you the right to buy an asset at a fixed price (called the strike price).
You buy a call when you expect the price to go up.
2. Put Option
A put option gives you the right to sell an asset at a fixed price.
You buy a put when you expect the price to go down.
Unlike buying stocks, where you pay the full amount, in options you pay only a premium to enter a trade, which makes it cheaper and more flexible.

Candle Patterns Candlestick patterns are one of the most valuable tools for traders. They visually represent the battle between bulls and bears and reveal hidden clues about upcoming market movements. Whether you're trading intraday, swing, or positional, these patterns help spot reversals, continuations, breakouts, and exhaustion points.
But remember: Candle patterns are most powerful when combined with trend analysis, support/resistance, volume, and market structure. Mastering them takes practice, but once you internalize their psychology, you can interpret charts with much more confidence and precision.

Premium Chart Patterns 1. Identify overall trend
Use BOS and CHoCH to read trend direction.
2. Mark premium and discount zones
Use Fibo 0.50 or volume profile to find optimal buy/sell zones.
3. Look for liquidity pools
Check where:
Retail stop losses are
False breakouts may occur
4. Wait for sweep or fake breakout
This is the strongest confirmation that institutions are active.
5. Mark order blocks & fair value gaps
These become entry and target zones.
6. Enter on retest
Never jump in early—wait for retest of order block, FVG, or structure.
7. Manage risk tightly
Premium patterns give small stop-loss and large RR opportunities.

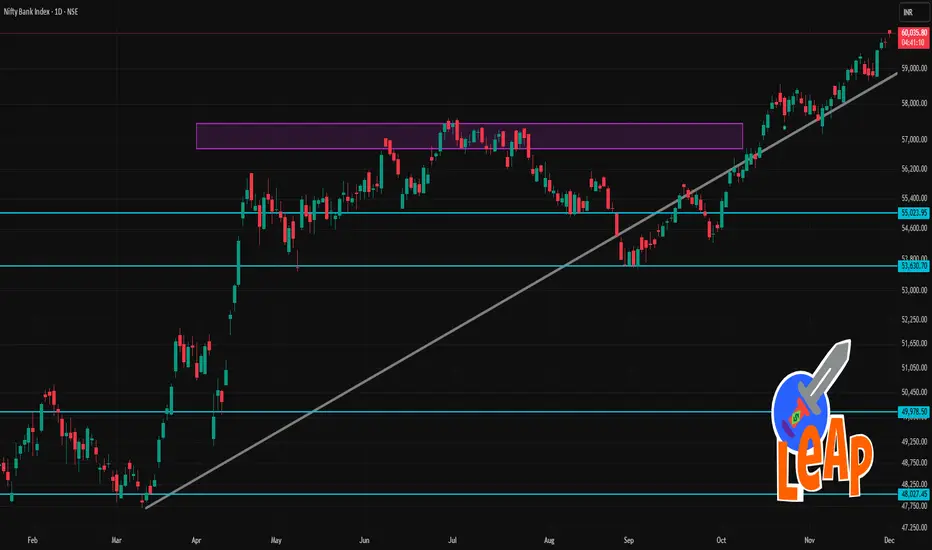
BANKNIFTY 1 Day Time Frame 📊 Current Status
Recent value of Nifty Bank — around 60,066 – 60,070.
Recent daily range: roughly 59,888 – 60,114.
📈 What It Implies Today
If Nifty Bank holds above ~ 59,750–59,800 (pivot), bulls may push toward 60,000, then 60,500+.
On a downside break below ~ 59,440–59,209 zones, watch for a drop toward ~ 58,783.
The 60,500 zone acts as a key upside barrier (resistance) in the near term.
Part 2 Candle Stick PatternRisks in Option Trading
While options provide great opportunities, they are not without risk:
Leverage Risk: High leverage can magnify both gains and losses.
Time Decay: Options lose value as expiration approaches, especially if they are out-of-the-money.
Complexity: Advanced strategies can be complicated and require careful monitoring.
Liquidity Risk: Some options may have low trading volumes, making it harder to enter or exit positions at favorable prices.
Market Risk: Like all investments, options are subject to market volatility and external factors.

Part 1 Candle Stick Pattern Advantages of Option Trading
Leverage: Options allow traders to control a large amount of underlying assets with smaller capital outlay.
Flexibility: Options can be used for speculation, hedging, or income generation.
Defined Risk: When buying options, the maximum loss is limited to the premium paid.
Portfolio Protection: Investors can use options, such as buying puts, to hedge against potential declines in stock positions.

Part 2 Support and ResistanceOption Pricing and Factors Affecting It
The pricing of options is based on option pricing models, with the most popular being the Black-Scholes Model. Key factors affecting an option’s price include:
Underlying Asset Price: As the price of the asset rises, call option prices typically increase, while put option prices decrease.
Strike Price: Options closer to being “in-the-money” (profitable to exercise) generally have higher premiums.
Time to Expiration: Longer-dated options usually cost more due to higher time value.
Volatility: Higher volatility increases the likelihood of the option becoming profitable, raising the premium.
Interest Rates and Dividends: Changes in risk-free interest rates and expected dividends can also influence option pricing.

BAJFINANCE 1 Day Tme Frame 🔎 Current Snapshot
Last traded price (approx): ₹ 1,037.50–₹ 1,038.
52-week high / low: ~₹ 1,102.50 / ~₹ 649.10
✅ Interpretation — What this implies today
Since current price (~₹ 1,037–1,038) is essentially at the pivot/central reference, the stock is at a neutral/indecisive zone.
For a bullish bias: a clean breakout above ~₹ 1,044 (R1) — especially with volume — could open up the path toward ~₹ 1,049–1,050 (R2), and maybe ~₹ 1,055–1,060 zone as broader resistance.
On the downside: if price dips, watch for support around ~₹ 1,031–1,032 (S1), and next support near ~₹ 1,024–1,025 (S2). A break below S2 with weakness could invite deeper correction or consolidation.
If price stays near pivot without clear breakout or breakdown, expect range-bound trading between ~₹ 1,031–1,044, until a trigger (volume/market move) shows direction.

A Comprehensive Guide to Managing Trading Risk1. Understanding Trading Risk
Trading risk refers to the possibility of losing part or all of the capital invested due to market movements, volatility, or other unforeseen events. Risk can be classified into different types:
Market Risk: The risk that market prices will move unfavorably.
Liquidity Risk: The inability to buy or sell an asset without causing significant price changes.
Credit Risk: The risk that a counterparty may fail to fulfill contractual obligations.
Operational Risk: Losses due to system failures, errors, or human mistakes.
Psychological Risk: Emotional decision-making leading to impulsive or irrational trades.
Understanding the type of risk you are exposed to is the first step toward controlling it.
2. Capital Allocation and Position Sizing
One of the most fundamental principles of risk management is controlling the amount of capital allocated to each trade. Traders often use position sizing to ensure that no single trade can significantly damage their portfolio.
Rule of Thumb: Risk no more than 1–2% of your total trading capital on a single trade. For example, if your capital is ₹1,00,000, your maximum loss per trade should be ₹1,000–₹2,000.
Position Size Formula: Position Size = (Capital at Risk) ÷ (Entry Price – Stop Loss Price). This ensures the risk is limited according to your strategy.
Proper capital allocation protects traders from catastrophic losses and allows them to stay in the game even during losing streaks.
3. Using Stop Losses
Stop-loss orders are essential tools for limiting losses. They automatically close a trade when the market moves against your position by a predetermined amount.
Fixed Stop Loss: A predetermined price level at which the trade will be closed.
Trailing Stop Loss: A dynamic stop loss that moves with favorable price movement, locking in profits while limiting downside.
Volatility-Based Stop Loss: Adjusts stop loss based on market volatility, often using indicators like Average True Range (ATR).
Stop losses remove the emotional component from trading decisions and prevent impulsive reactions during market swings.
4. Diversification
Diversification reduces the overall risk of a trading portfolio by spreading capital across multiple assets, sectors, or markets.
Asset Diversification: Trade in multiple asset classes like stocks, commodities, and forex.
Sector Diversification: Invest across different sectors (technology, healthcare, energy) to mitigate sector-specific risks.
Strategy Diversification: Use multiple trading strategies (trend-following, mean-reversion, scalping) to avoid over-reliance on a single approach.
Diversification reduces the probability that a single adverse market event will wipe out your capital.
5. Risk-Reward Ratio
Every trade carries both risk and potential reward. Maintaining a favorable risk-reward ratio is crucial for long-term profitability.
Definition: Risk-Reward Ratio = Potential Profit ÷ Potential Loss.
Recommended Ratio: Many professional traders aim for a minimum 1:2 ratio, meaning potential profit is at least twice the potential loss.
Even if a trader wins only 50% of trades, a favorable risk-reward ratio ensures profitability over time.
6. Use of Leverage with Caution
Leverage amplifies both gains and losses. While it allows traders to control large positions with limited capital, it can also lead to rapid account depletion if mismanaged.
Leverage Limits: Only use leverage that you can comfortably manage. Beginners should avoid high leverage entirely.
Margin Requirements: Always monitor margin requirements and avoid over-leveraging positions.
Responsible use of leverage is a critical aspect of risk management, especially in highly volatile markets like forex or derivatives.
7. Hedging Strategies
Hedging is a method of reducing exposure to adverse price movements by taking offsetting positions in correlated assets.
Options and Futures: Traders can hedge stock positions using put options or futures contracts.
Currency Hedging: Forex traders may hedge currency exposure to protect against exchange rate fluctuations.
Portfolio Hedging: Using ETFs or inverse instruments to mitigate overall portfolio risk.
While hedging can reduce risk, it also comes at a cost, so it should be applied judiciously.
8. Monitoring Market Conditions
Risk is not static—it fluctuates with market conditions. Traders should continuously monitor macroeconomic events, market news, and technical indicators to adjust their risk exposure.
Volatility Analysis: Use indicators like Bollinger Bands or ATR to measure market volatility.
Economic Events: Keep track of interest rate decisions, inflation data, earnings announcements, and geopolitical events.
Technical Signals: Use trendlines, moving averages, and support/resistance levels to identify potential risk zones.
Being proactive rather than reactive helps in managing risks more effectively.
9. Psychological Risk Management
Emotions can be a trader’s worst enemy. Fear and greed often lead to impulsive decisions that magnify risk.
Trading Plan: Have a detailed plan that includes entry, exit, and risk limits.
Discipline: Stick to your trading plan even during drawdowns.
Avoid Overtrading: Taking too many trades increases exposure to unnecessary risk.
Record Keeping: Maintain a trading journal to analyze mistakes and improve strategies.
Mental resilience and self-discipline are as important as technical risk controls.
10. Continuous Learning and Adaptation
Markets evolve, and strategies that worked in the past may not be effective in the future. Risk management requires constant learning and adaptation.
Backtesting: Test trading strategies on historical data to evaluate risk.
Simulation Trading: Practice with demo accounts to refine risk management without financial loss.
Stay Updated: Read financial news, follow market analysts, and keep learning about new risk management tools.
Continuous improvement ensures that traders adapt to changing market dynamics while protecting capital.
11. Emergency Risk Controls
Even with careful planning, unexpected events like market crashes, flash crashes, or broker failures can occur. Traders should implement emergency risk controls.
Circuit Breakers: Use automatic exit mechanisms during extreme volatility.
Diversified Brokers: Avoid keeping all funds with a single broker.
Insurance Products: Consider financial instruments or policies that protect against catastrophic losses.
Having contingency plans safeguards against black swan events and extreme losses.
Conclusion
Managing trading risk is not about eliminating it—it is about understanding, controlling, and mitigating it. Effective risk management allows traders to survive losing streaks, capitalize on opportunities, and maintain consistent growth. Key principles include prudent capital allocation, stop-loss usage, diversification, favorable risk-reward ratios, disciplined leverage, hedging, and psychological resilience. Continuous monitoring, adaptation, and emergency preparedness further enhance risk control.
Ultimately, the trader who masters risk management doesn’t merely seek profit but protects the most valuable asset: their capital. Profit is fleeting, but capital preservation ensures a seat at the market table for the long term. By integrating these principles into daily trading routines, traders can navigate the uncertain waters of financial markets with confidence and discipline.
Types of Financial Markets1. Capital Markets
Capital markets are long-term financial markets where instruments such as equities (shares) and long-term debt (bonds) are traded. These markets help businesses and governments raise funds for expansion, infrastructure, or other long-term projects.
a. Stock Market
The stock market enables companies to raise capital by issuing shares to investors. There are two segments:
Primary Market: Companies issue new shares for the first time through Initial Public Offerings (IPO). This is the market where securities are created.
Secondary Market: After issuance, shares are bought and sold among investors via stock exchanges like the NSE, BSE, NYSE, and NASDAQ.
Importance:
Provides companies with capital for expansion
Offers investors opportunities for wealth creation
Acts as a barometer of the economy
b. Bond Market
The bond market, also called the debt market, deals with the issuance and trading of bonds. These are typically issued by governments, corporations, or municipalities to borrow money.
Types of bonds include:
Government bonds
Corporate bonds
Municipal bonds
Convertible bonds
Role:
It offers stable returns, lower risk compared to equities, and is crucial for government financing.
2. Money Markets
Money markets deal with short-term debt instruments with maturities of less than one year. These markets help institutions manage short-term liquidity needs.
Instruments include:
Treasury bills (T-bills)
Commercial paper (CP)
Certificates of deposit (CDs)
Repurchase agreements (Repos)
Participants: Banks, financial institutions, corporations, mutual funds, and central banks.
Purpose:
To provide short-term funding, support liquidity, and stabilize the banking system.
3. Foreign Exchange (Forex) Market
The forex market is the world’s largest and most liquid financial market. It facilitates the global exchange of currencies.
Key features:
Operates 24/5 across global financial centers
Daily trading volume exceeds trillions of dollars
Involves participants like banks, hedge funds, corporations, retailers, and governments
Types of forex markets:
Spot Market: Immediate currency exchange
Forward Market: Future delivery at a pre-agreed rate
Futures Market: Standardized currency contracts traded on exchanges
Importance:
It enables international trade, investment flows, tourism, and global business operations.
4. Derivatives Markets
Derivatives markets trade financial contracts whose value is derived from an underlying asset—such as stocks, currencies, interest rates, or commodities.
Main derivative instruments:
Futures: Obligatory contracts to buy/sell assets at a future date
Options: Contracts giving the right but not the obligation to buy/sell
Swaps: Exchange of cash flows (e.g., interest rate swaps)
Forwards: Customized over-the-counter (OTC) contracts
Use cases:
Hedging risk (price risk, currency risk)
Speculation for profit
Arbitrage opportunities
Portfolio diversification
Derivative markets enhance liquidity and allow businesses to manage financial exposure efficiently.
5. Commodity Markets
Commodity markets deal with physical goods or raw materials such as:
Gold, silver
Crude oil, natural gas
Agricultural products (wheat, sugar, cotton)
Metals (aluminum, copper)
These commodities can be traded in two ways:
a. Spot Commodity Market
Immediate delivery and payment occur. Prices depend on real-time supply and demand.
b. Commodity Derivatives Market
Futures and options contracts allow traders to speculate or hedge commodity price fluctuations.
Importance:
Commodity markets help producers secure price stability and provide investors with opportunities beyond traditional financial assets.
6. Cryptocurrency and Digital Asset Markets
With rapid technological advancement, cryptocurrencies have created a new type of financial market. These markets trade digital tokens like Bitcoin, Ethereum, and thousands of altcoins.
Features:
Decentralized blockchain-based system
Trades through exchanges like Binance, Coinbase, and others
High volatility, high return potential
Instruments Include:
Spot trading
Futures and perpetual contracts
Staking and yield farming
Cryptocurrency markets are reshaping modern finance, introducing decentralized finance (DeFi), NFTs, and Web3 innovations.
7. Insurance Markets
Though not traditional trading markets, insurance markets play a crucial role in risk distribution. They allow individuals and businesses to transfer risks of financial loss to insurance companies.
Types of insurance markets:
Life insurance
Health insurance
Property and casualty insurance
Reinsurance
These markets support economic growth by offering financial protection and risk coverage.
8. Real Estate Markets
Real estate markets involve buying, selling, and leasing residential, commercial, and industrial properties.
Components:
Physical property market
Real estate investment trusts (REITs)
Mortgage-backed securities (MBS)
Real estate offers steady income through rent and long-term appreciation, making it a key investment category.
9. Credit Markets
Credit markets deal with borrowing and lending between parties. They include:
Bank loans
Credit lines
Mortgages
Consumer lending
These markets influence spending, investment, and economic growth by determining the availability and cost of credit.
10. Over-the-Counter (OTC) Markets
OTC markets involve decentralized trading without a centralized exchange. Participants trade directly through brokers or dealers.
Examples:
Currency forwards
Interest rate swaps
Corporate debt
Certain derivatives
OTC markets offer flexibility but carry higher counterparty risk.
11. Auction Markets
Auction markets match buyers and sellers by competitive bidding. The price is determined by supply and demand.
Examples:
Government bond auctions
Commodity auctions
IPO book-building auctions
These markets ensure transparency and fair price discovery.
Conclusion
Financial markets are diverse, interconnected systems that influence every part of the global economy. Each market—whether capital, money, forex, commodity, or derivatives—serves a unique role in facilitating investment, supporting business operations, managing risk, and driving economic growth. Understanding these markets helps investors, businesses, and policymakers make informed decisions. Together, these markets form the complex network through which money flows, value is created, and economies evolve.

Option Trading & Derivatives (F&O) Trading1. What Are Derivatives?
A derivative is a financial contract whose value is derived from an underlying asset. This underlying can be:
Stocks
Indices (Nifty, Bank Nifty)
Commodities
Currencies
Interest rates
Derivatives do not represent ownership of the underlying asset. Instead, they allow traders to speculate on price movements or hedge risks without directly buying the actual asset.
Why derivatives exist:
Hedging (Risk Management):
Businesses and traders use derivatives to protect against adverse price movements.
Speculation:
Traders can predict price moves and earn profits with relatively small capital (leverage).
Arbitrage:
Taking advantage of price differences across markets to generate risk-free returns.
2. What Is F&O Trading?
The F&O (Futures and Options) segment is the derivatives market where futures contracts and option contracts are traded. These instruments are standardized and regulated by exchanges like NSE and BSE in India.
Futures
A future is a contract between two parties to buy or sell the underlying asset at a predetermined price on a future date.
Key features:
Obligation to buy or sell
Mark-to-market settlement daily
High leverage
No upfront premium—margin required
Options
Options are more flexible. Here, the buyer has the right, but not the obligation, to buy or sell the underlying asset at a specific price before expiry.
This structure makes option trading safer for buyers, as maximum loss is limited to the premium paid.
3. What Is Option Trading?
Option trading involves buying or selling option contracts. Options are of two main types:
A. Call Option (CE)
A call option gives the buyer the right to buy the underlying asset at a particular price (strike price).
Used when the trader expects:
Market will go up
Example: If Nifty is at 21,000 and you expect a rise, you may buy a 21,100 CE.
B. Put Option (PE)
A put option gives the buyer the right to sell the underlying asset at a particular price.
Used when the trader expects:
Market will go down
Example: If you expect Nifty to fall from 21,000, you may buy a 20,900 PE.
4. Components of an Option Contract
Understanding option pricing requires knowing its key elements:
1. Strike Price
The price at which the buyer can buy (Call) or sell (Put) the underlying asset.
2. Premium
The cost paid by the buyer to the seller (writer).
Premium depends on volatility, time left to expiry, and price difference from the underlying.
3. Expiry Date
Options expire on a fixed date.
In India:
Index options: Weekly + monthly expiry
Stock options: Monthly expiry only
4. Lot Size
Options are traded in lots, not single shares.
5. Option Buyers vs Option Sellers
Understanding the difference is critical.
Option Buyer (Holder)
Pays premium
Has limited loss
Profit is unlimited (in calls) or high (in puts)
Buyers need strong directional movement.
Option Seller (Writer)
Receives premium
Has limited profit (premium)
Loss can be unlimited
Sellers win when markets stay sideways or move less than expected.
6. Why Do Traders Prefer Options?
1. Limited Risk for Buyers
Even if the market moves drastically against you, the maximum loss is the premium paid.
2. Low Capital Requirement
Compared to futures or stock delivery, options require lesser capital to take large positions.
3. Hedging Tool
Portfolio managers use options to protect investments from downside risk.
4. Flexibility
Options allow strategies for bullish, bearish, or sideways markets.
7. How Options Derive Value — Premium Breakdown
Option premium consists of:
A. Intrinsic Value
The actual value based on the current market price.
B. Time Value
The value of the time remaining before expiry.
Longer duration = higher premium.
C. Volatility Impact
High volatility increases premium as price movement expectations rise.
8. Types of Options Based on Moneyness
1. In-the-Money (ITM)
Call: Strike < Spot
Put: Strike > Spot
These have intrinsic value.
2. At-the-Money (ATM)
Strike price = current market price.
3. Out-of-the-Money (OTM)
Call: Strike > Spot
Put: Strike < Spot
Cheaper but riskier.
9. F&O Trading Strategies Using Options
Options are versatile, enabling a variety of strategies.
1. Directional Strategies
Good for trending markets:
Long Call (Bullish)
Long Put (Bearish)
Call Spread / Put Spread
2. Non-Directional Strategies
Good for sideways markets:
Iron Condor
Short Straddle
Short Strangle
3. Hedging Strategies
Protective Put
Covered Call
Traders select strategies based on volatility, trend strength, and risk appetite.
10. Risks in F&O Trading
Even though options look simple, F&O trading carries significant risks:
1. High Volatility Risk
Unexpected news can move prices sharply.
2. Time Decay Risk
Option buyers lose value each day.
3. Leverage Risk
Small capital controls large positions, increasing both profits and losses.
4. Liquidity Risk
Some stocks in F&O have low volume, making entry/exit difficult.
11. Who Should Trade Options?
Option trading suits:
Traders who understand market direction
Those with small capital
Risk-managed traders
Portfolio investors wanting hedge protection
Advanced traders who use spreads and combinations
However, without knowledge, beginners should avoid naked option selling due to unlimited risk.
12. Role of F&O in the Financial Market
F&O segment plays a crucial role in overall market stability:
1. Risk Transfer Mechanism
Allows shifting risk between participants.
2. Enhances Market Liquidity
More participants → deeper markets.
3. Price Discovery
F&O prices indicate future expectations.
4. Improves Market Efficiency
Arbitrage aligns cash and futures prices.
Conclusion
Option trading and F&O derivatives form the backbone of modern financial markets. They offer traders the ability to hedge risk, speculate with lower capital, and access leverage for higher potential returns. Options, in particular, stand out because they provide flexibility through calls and puts, limited loss for buyers, and strategic combinations that can suit any market condition. However, the power of leverage and complexity also requires strong understanding, disciplined risk management, and strategic execution. For traders who master these skills, the F&O market becomes a powerful tool for generating consistent returns and managing market uncertainty effectively.

PCR Trading Strategies Option Premium
The option premium is the cost of buying an option contract. It is influenced by several factors:
Underlying Price – higher underlying prices increase call premiums and decrease put premiums.
Strike Price – closer the strike price is to current market price, costlier the option.
Time to Expiry – more time means higher premium.
Volatility – higher volatility increases premium as uncertainty rises.
Interest Rates and Dividends – have minor impacts but still contribute.
These factors are modeled using the Black-Scholes model and other pricing techniques.

Part 12 Trading Master ClassCall Options
A call option benefits the buyer when the price of the underlying asset goes up.
For example, if a stock is trading at ₹100 and you buy a call option with strike price ₹105, you expect the price to rise above ₹105 before expiry. If the stock goes to ₹120, you can buy it at ₹105 and profit from the difference (minus premium). If it stays below ₹105, your loss is limited only to the premium paid.
Put Options
A put option benefits the buyer when the price of the underlying asset goes down.
If a stock trades at ₹100 and you buy a put with a strike price of ₹95, you expect it to fall. If the stock goes to ₹80, you can sell at ₹95 and keep the difference as profit. If price stays above ₹95, your maximum loss is only the premium.

Premium Chart Patterns Limitations of Chart Patterns
False breakouts are common.
Patterns may be subjective—two traders may interpret them differently.
Market news can disrupt even perfect setups.
Patterns on lower timeframes are less reliable due to noise.
Therefore, traders often combine patterns with:
Moving averages
RSI
MACD
Volume analysis
Market structure
This improves accuracy.

Part 10 Trade Like Institutions Option Trading in India (NSE)
In India, the National Stock Exchange (NSE) is the largest options market globally in terms of contracts traded.
Features of Indian Options:
Cash-settled for indices (NIFTY, FINNIFTY, BANKNIFTY)
Stock options are physically settled
Weekly expiries every Thursday (for index)
Monthly expiries for stocks
Index options are preferred because they:
Have high liquidity
Offer tight spreads
Enable sophisticated strategies

Part 9 Trading Master ClassRisks in Option Trading
1. High Losses for Option Sellers
Naked call sellers face unlimited loss potential.
2. Time Decay
An option loses value as it approaches expiry.
3. Complex Pricing
Options require understanding of volatility, Greeks, and probability.
4. Liquidity Problems
Illiquid options cause slippage and wide bid-ask spreads.
5. Emotional Trading
Fast-moving markets can cause panic among new traders.

Part 8 Trading Master ClassAdvantages of Option Trading
1. Limited Risk for Buyers
Buying options never risks more than the premium.
2. High Leverage
Small investment can control large quantity.
3. Flexibility
Hundreds of strategies exist.
4. Hedging Power
Investors can protect long-term portfolios.
5. Income Potential
Option writing gives fixed, predictable income.
