Part 8 Trading Master Class With Experts Option Trading and Volume Profile
Option traders use volume profile to identify:
Value area
Low volume nodes
High volume nodes
Breakout zones
Reversal zones
Options premiums react strongly around:
POC
Imbalance zones
Market structure shifts
Trendcontinuation

RBLBANK 1 Day Time Frame 📊 Daily Support & Resistance Levels
Immediate resistances:
~₹315–₹318 area — observed short-term resistance zone and recent highs.
~₹325–₹330 — upper resistance band near recent 52-week highs.
Immediate supports:
~₹300–₹295 — important short-term support zone on daily charts.
~₹285–₹280 — next support cluster if breakdown below ₹295 occurs.
📉 Pivot & Intraday Levels (Indicative)
(These are based on typical pivot calculations from recent sessions — actual values will vary daily)
Pivot: around ₹290–₹295.
R1: ~₹295–₹300
R2: ~₹300–₹305
S1: ~₹285–₹280
S2: ~₹280–₹275
(Pivot-based levels give clues for intraday trading and are often recalculated each day.)
📈 Technical Indicator Context (Daily)
RSI (~50) — neutral momentum, neither overbought nor oversold.
Short MA structure shows mixed signals; some shorter SMAs/EMAs near current price.
MACD slightly bearish to neutral on some sources.
🧠 Notes for Daily Traders
Bullish break above ~₹318–₹320 with volume can open up short-term upside towards ₹325–₹330+.
A daily close below ~₹295 may signal short-term weakness and can expose deeper support around ₹285–₹280.

Trading Plan for SuccessUnderstanding the Purpose of a Trading Plan
The primary purpose of a trading plan is to bring structure and clarity to your trading activities. Markets are unpredictable, and no strategy works all the time. A trading plan does not eliminate losses, but it ensures that losses are controlled and gains are maximized when the market moves in your favor. It defines what you trade, when you trade, how much you trade, and why you trade. By following predefined rules, traders avoid emotional decisions such as overtrading, revenge trading, or holding losing positions for too long.
A trading plan also helps in maintaining consistency. Consistency is more important than occasional big profits. When you apply the same rules repeatedly, you can evaluate your performance objectively and make data-driven improvements.
Defining Clear Trading Goals
Every successful trading plan begins with clear and realistic goals. These goals should align with your financial situation, risk tolerance, and time commitment. Instead of focusing only on profits, goals should emphasize process-oriented objectives such as maintaining discipline, following risk management rules, and improving accuracy over time.
Short-term goals may include learning a specific strategy, reducing impulsive trades, or achieving consistent monthly returns. Long-term goals might involve building capital steadily, transitioning to full-time trading, or generating supplemental income. Clearly defined goals provide motivation and direction while keeping expectations realistic.
Choosing the Right Market and Time Frame
A good trading plan specifies the markets you will trade, such as stocks, indices, commodities, forex, or options. It is important to focus on a limited number of instruments rather than trading everything available. Specialization allows you to understand the behavior, volatility, and patterns of specific markets.
Time frame selection is equally important. Intraday traders focus on shorter time frames like 5-minute or 15-minute charts, while swing traders may use daily or weekly charts. Long-term investors rely on monthly or weekly time frames. Your choice should match your personality, lifestyle, and available time. A plan that does not fit your routine is difficult to follow consistently.
Developing a Trading Strategy
The trading strategy is the core of your trading plan. It defines the conditions under which you enter and exit trades. A strategy may be based on technical analysis, price action, indicators, volume analysis, or a combination of these. Regardless of the method, the strategy must have clear, objective rules.
Entry rules should specify the exact conditions that trigger a trade. Exit rules should define profit targets and stop-loss levels before entering the trade. A successful trading plan never leaves exits to guesswork. Risk-to-reward ratio plays a critical role here. Many professional traders aim for trades where potential reward is at least twice the potential risk, ensuring profitability even with a moderate win rate.
Risk Management: The Key to Survival
Risk management is the most critical component of a trading plan. Even the best strategy can fail without proper risk control. A trading plan must define how much capital you are willing to risk on each trade. Most successful traders risk only a small percentage of their trading capital, typically 1–2% per trade.
Position sizing is directly linked to risk management. It ensures that no single trade can cause significant damage to your account. Stop-loss placement must be logical and based on market structure rather than emotional comfort. Risk management protects traders from large drawdowns and helps them stay in the game during unfavorable market phases.
Emotional Discipline and Trading Psychology
Trading success is not just about strategy; it is also about mindset. Fear and greed are the biggest enemies of traders. A trading plan helps manage emotions by providing predefined rules, but discipline is required to follow those rules consistently.
Traders must accept that losses are part of the process. A loss does not mean failure; it means the plan is working as intended. Overconfidence after winning streaks and frustration after losses can lead to deviation from the plan. Maintaining emotional balance and trusting the process are essential for long-term success.
Maintaining a Trading Journal
A trading journal is an integral part of a successful trading plan. It records every trade, including entry, exit, reasoning, emotional state, and outcome. Over time, the journal becomes a powerful tool for self-analysis. It helps identify strengths, weaknesses, and recurring mistakes.
Reviewing the journal regularly allows traders to refine their strategies, eliminate bad habits, and reinforce good behavior. Continuous improvement is only possible when performance is measured and analyzed objectively.
Continuous Learning and Adaptation
Markets evolve, and a trading plan should be flexible enough to adapt to changing conditions. Continuous learning through market observation, backtesting, and performance review is necessary. However, frequent strategy changes should be avoided. Adjustments should be based on data and experience, not short-term results.
Successful traders treat trading as a business, not a gamble. They invest time in education, stay updated with market developments, and continuously work on improving their skills.
Conclusion
A trading plan for success is a combination of strategy, risk management, discipline, and self-awareness. It provides structure in an uncertain environment and transforms trading from an emotional activity into a systematic process. While profits are the ultimate goal, consistency, discipline, and risk control are the true pillars of long-term success. By creating, following, and refining a well-defined trading plan, traders significantly increase their chances of achieving sustainable success in the financial markets.

Cryptocurrency as a Digital Asset1. Introduction to Cryptocurrency
Cryptocurrency is a form of digital or virtual asset that uses cryptography for security.
Unlike traditional money, it exists only in digital form and is not issued by any central authority like a government or central bank.
Bitcoin, launched in 2009, was the first cryptocurrency, followed by thousands of others such as Ethereum, Solana, and Ripple.
Cryptocurrencies operate on blockchain technology, which ensures transparency and security.
2. Meaning of Digital Asset
A digital asset is any asset that exists in electronic format and has economic value.
Cryptocurrencies qualify as digital assets because they can be:
Owned
Transferred
Traded
Stored digitally
Examples of digital assets include cryptocurrencies, NFTs, digital tokens, and stablecoins.
3. Blockchain Technology as the Foundation
Blockchain is a distributed ledger that records all cryptocurrency transactions.
It is decentralized, meaning no single authority controls it.
Each transaction is stored in a block, and blocks are linked together, forming a chain.
This structure makes data immutable, reducing fraud and manipulation.
4. Decentralization and Trustless System
Cryptocurrencies operate in a trustless environment, meaning users do not need to trust each other or intermediaries.
Transactions are verified by network participants (miners or validators).
Decentralization reduces dependence on banks and financial institutions.
It empowers users with full control over their assets.
5. Ownership and Digital Wallets
Ownership of cryptocurrency is determined by private keys.
Digital wallets store these private keys and allow users to send, receive, and hold crypto assets.
Wallets can be:
Hot wallets (online)
Cold wallets (offline hardware wallets)
Losing a private key can result in permanent loss of assets.
6. Cryptocurrency as an Investment Asset
Cryptocurrencies are widely used as investment instruments.
Investors buy crypto expecting price appreciation.
Some cryptocurrencies offer staking rewards and yield opportunities.
High volatility makes crypto attractive for traders but risky for conservative investors.
7. Limited Supply and Scarcity
Many cryptocurrencies have a fixed maximum supply.
Bitcoin, for example, has a cap of 21 million coins.
Scarcity increases perceived value, similar to precious metals like gold.
This feature makes crypto appealing as a store of value.
8. Transparency and Security
All transactions are publicly visible on the blockchain.
Advanced cryptographic algorithms protect transaction data.
Hacking the blockchain is extremely difficult due to its decentralized structure.
However, exchanges and wallets can still be vulnerable if security is weak.
9. Global and Borderless Nature
Cryptocurrencies can be transferred across borders instantly.
They eliminate the need for currency conversion and banking delays.
This makes them useful for international payments and remittances.
Transaction costs are often lower than traditional banking systems.
10. Use in Payments and Commerce
Many businesses accept cryptocurrency as a form of payment.
It enables peer-to-peer transactions without intermediaries.
Smart contracts automate payments when conditions are met.
Adoption is growing in e-commerce, gaming, and online services.
11. Role in Decentralized Finance (DeFi)
DeFi uses cryptocurrencies to create financial services without banks.
Services include lending, borrowing, insurance, and trading.
Users retain control of their assets through smart contracts.
DeFi expands financial access to people without traditional banking.
12. Regulatory Perspective
Governments classify cryptocurrency as a digital asset rather than currency in many countries.
Regulations aim to prevent money laundering and fraud.
Legal clarity is still evolving across jurisdictions.
Regulation can impact crypto prices and adoption rates.
13. Volatility and Risk Factors
Cryptocurrency prices can fluctuate sharply within short periods.
Market sentiment, regulations, and global events influence prices.
Lack of investor protection increases risk.
Proper risk management is essential for crypto investors.
14. Taxation of Digital Assets
Cryptocurrencies are often subject to capital gains tax.
Tax treatment varies from country to country.
Transactions, trading profits, and staking rewards may be taxable.
Accurate record-keeping is crucial for compliance.
15. Comparison with Traditional Assets
Unlike stocks, crypto does not represent ownership in a company.
Unlike bonds, it does not guarantee fixed returns.
Compared to gold, crypto is easier to store and transfer.
It offers higher potential returns but also higher risk.
16. Environmental Concerns
Some cryptocurrencies consume high energy due to mining.
Bitcoin mining has raised environmental concerns.
Newer blockchains use energy-efficient consensus mechanisms.
Sustainability is becoming a key focus in crypto development.
17. Technological Innovation and Growth
Continuous innovation drives the crypto ecosystem.
Developments include Layer-2 solutions, scalability improvements, and interoperability.
Tokenization allows real-world assets to be represented digitally.
Innovation increases the utility of crypto as a digital asset.
18. Financial Inclusion
Cryptocurrencies provide access to finance for unbanked populations.
Anyone with internet access can participate.
This promotes economic empowerment and inclusion.
It reduces reliance on centralized financial systems.
19. Long-Term Value Proposition
Cryptocurrencies represent a shift toward digital ownership.
They challenge traditional financial models.
Institutional adoption is increasing.
Long-term value depends on adoption, regulation, and technology.
20. Conclusion
Cryptocurrency is a revolutionary digital asset reshaping global finance.
It combines technology, economics, and decentralization.
While it offers transparency, security, and innovation, it also carries risks.
As adoption grows, cryptocurrencies are likely to play a major role in the future digital economy.

Smart Money SecretsHow Institutional Investors Really Win in Financial Markets
In financial markets, the term “smart money” refers to capital controlled by institutions, professional traders, hedge funds, banks, and experienced investors who possess deep knowledge, superior resources, and disciplined strategies. Unlike retail traders, smart money does not chase headlines or react emotionally to short-term price fluctuations. Instead, it moves markets quietly, strategically, and with a long-term perspective. Understanding smart money secrets can help individual traders and investors align themselves with market strength rather than fight against it.
Understanding Who Smart Money Is
Smart money represents participants with access to advanced research, large capital, insider-level understanding of market mechanics, and professional risk management systems. These include mutual funds, pension funds, insurance companies, proprietary trading desks, and seasoned investors. Their decisions are not impulsive; they are based on data, probability, and macro-to-micro analysis. While retail traders often focus on indicators alone, smart money focuses on price behavior, liquidity, and market structure.
Smart Money Thinks in Probabilities, Not Predictions
One of the biggest secrets of smart money is that it never tries to predict the market with certainty. Instead, it operates on probabilities. Every trade is viewed as a calculated risk where losses are controlled and profits are allowed to grow. Smart money accepts losses as part of the game and avoids emotional attachment to any single position. This mindset allows institutions to survive long-term, even through volatile market conditions.
Liquidity Is the Real Target
Smart money does not enter or exit trades randomly. It seeks liquidity—areas in the market where many orders are placed, such as stop-loss zones above resistance or below support. These zones provide enough volume for large players to enter or exit positions without causing extreme price disruption. Many sudden price spikes or sharp reversals occur because smart money is collecting liquidity from retail traders who place predictable stop losses.
Market Structure Over Indicators
Retail traders often overload charts with indicators, while smart money primarily studies market structure—higher highs, lower lows, break of structure (BOS), and change of character (CHOCH). Institutions analyze how price moves from one liquidity zone to another. Indicators may lag, but structure reveals the true intent of price movement. Smart money enters trades during consolidation phases and exits during expansion phases, when retail traders are just entering.
Accumulation and Distribution Phases
A key smart money secret lies in understanding accumulation and distribution. During accumulation, institutions quietly build positions while price moves sideways and volatility remains low. Retail traders often get bored and exit during this phase. Once accumulation is complete, price expands rapidly, attracting retail participation. At the top, smart money distributes its holdings while retail traders buy aggressively, believing the trend will continue forever.
Time Is a Strategic Weapon
Smart money is patient. It can wait weeks, months, or even years for the right opportunity. Retail traders, on the other hand, often feel pressure to trade daily. Institutions understand that not trading is also a position. They focus on high-quality setups aligned with broader trends rather than constant activity. This patience allows smart money to enter at optimal prices and avoid unnecessary losses.
Risk Management Is Non-Negotiable
Another powerful secret is strict risk management. Smart money never risks a large percentage of capital on a single trade. Position sizing is calculated precisely, ensuring survival even during losing streaks. Institutions focus more on capital preservation than on making quick profits. This approach allows compounding to work over time, which is the true source of long-term wealth in markets.
Emotions Are Removed From Decisions
Smart money operates through systems, rules, and predefined strategies. Emotional trading—driven by fear, greed, or revenge—is eliminated as much as possible. Decisions are made before entering a trade, including entry, stop-loss, and exit points. Retail traders often react emotionally to market noise, while institutions remain calm and disciplined.
News Is Used, Not Followed
While retail traders often react to news events, smart money prepares in advance. Institutions understand that markets often price in news before it becomes public. By the time headlines appear, smart money may already be exiting positions. News is used as a liquidity event rather than a signal to enter blindly. This is why markets sometimes move opposite to expectations after major announcements.
Following Smart Money Instead of Fighting It
The most valuable lesson for retail traders is not to compete with smart money, but to align with it. This means trading with the trend, respecting key levels, understanding volume and price behavior, and avoiding overtrading. Observing how price reacts at support and resistance, how breakouts behave, and where false moves occur can offer clues to smart money activity.
Conclusion: Turning Knowledge Into Advantage
Smart money secrets are not about hidden tricks or insider information; they are about discipline, patience, structure, and risk control. Institutions win because they think differently, manage risk professionally, and understand how markets truly function. Retail traders who adopt these principles—focusing on probability, liquidity, market structure, and emotional control—can dramatically improve their performance.
Ultimately, the goal is not to outsmart smart money, but to trade alongside it. When you stop chasing the market and start understanding how and why price moves, you shift from being liquidity for smart money to becoming a more informed and strategic market participant.

Part 3 Learn Institutional TradingOptions vs Futures
Feature Options Futures
Obligation No (buyer), Yes (seller) Yes
Risk Buyer limited Unlimited
Capital Low Higher
Strategies Very flexible Limited

Part 1 Ride The Big Moves Key Participants in Option Trading
There are two primary participants:
Option Buyer
Pays a premium to buy the option
Has limited risk (maximum loss is the premium paid)
Has potentially unlimited profit (in certain cases)
Option Seller (Writer)
Receives the premium
Has limited profit (only the premium received)
Bears higher or unlimited risk
Understanding the mindset of buyers and sellers is crucial because option prices are driven by their interaction.

Part 2 Technical Analysis vs. Institutional Option TradingPut Options (PE) – Explained
A Put Option gives the buyer the right to sell the underlying asset at the strike price.
Why Buy a Put Option?
You buy a put when you expect the price to fall.
Example:
BANKNIFTY is at 49,000
You buy 49,000 PE @ ₹120
If BANKNIFTY falls to 48,500:
Intrinsic value = 49,000 – 48,500 = 500
Profit = 500 – 120 = ₹380 x lot size
If BANKNIFTY stays above 49,000:
Put expires worthless
Loss = ₹120 premium
Why Sell a Put Option?
You sell a put when you expect market to stay above strike.
Put Seller View:
Market will rise OR stay sideways
Premium will decay with time

Part 1 Technical Analysis vs. Institutional Option Trading Call Options (CE) – Explained
A Call Option gives the buyer the right to buy the underlying asset at the strike price.
Why Buy a Call Option?
You buy a call when you expect the price to rise.
Example:
NIFTY is at 22,000
You buy NIFTY 22,000 CE @ ₹100
If NIFTY goes to 22,400 at expiry:
Intrinsic value = 22,400 – 22,000 = 400
Profit = 400 – 100 = ₹300 x lot size
If NIFTY stays below 22,000:
Your call expires worthless
Loss = Premium = ₹100
Why Sell a Call Option?
You sell a call when you expect the price to stay below strike.
Call Seller View:
Market will fall OR stay sideways
Premium will decrease (time decay)

PCR Trading Strategies What Are Options?
An option is a financial contract between two parties:
Buyer of the option — who pays a premium
Seller of the option — who receives the premium
The option gives the buyer the right, but not the obligation, to buy or sell an underlying asset (like stocks, index, commodities) at a fixed price (strike price) before or on a specific date (expiry).
The seller (or writer) has the obligation to fulfill the contract if the buyer chooses to exercise the option.
There are two types of options:
Call options (CE) – Right to buy
Put options (PE) – Right to sell

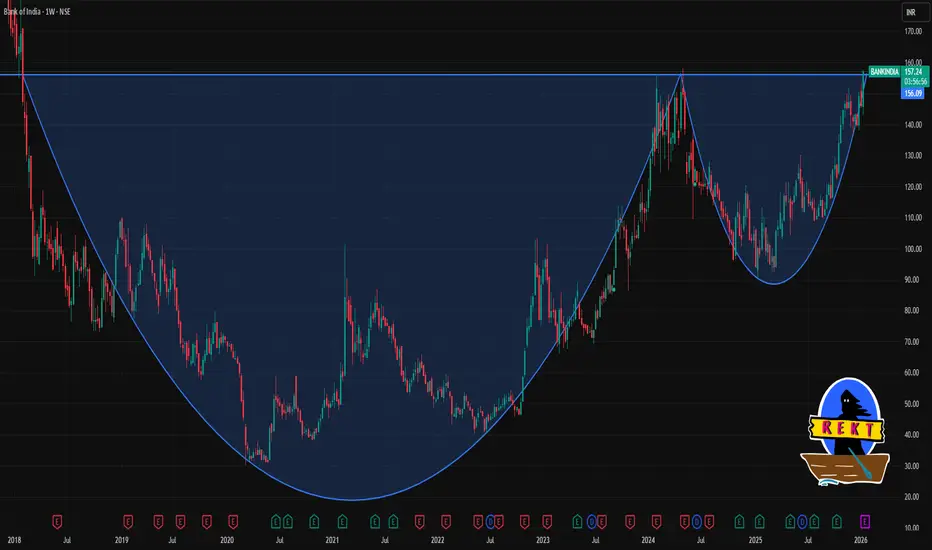
BANKINDIA 1 Week Time Frame 📈 Current Price Context (as of latest available)
Bank of India is trading in the range of ~₹152–157 recently on NSE.
🔁 Weekly Trend / Technical Signals
On TradingView’s aggregated technicals, the 1‑week rating shows a Strong Buy trend, indicating bullish momentum on the weekly timeframe.
📊 Key Levels to Watch (Weekly)
🔹 Resistance (Upside)
1. ~₹158–163 — near recent pivot R2/R3 zones seen on pivot studies.
2. ~₹165–168+ — upper circuit and extended resistance from broader pivot calculations.
If the weekly close stays above ₹158 and builds momentum, higher resistance targets toward ₹165–168 could be tested.
🔸 Support (Downside)
1. ~₹148–150 — immediate support from short‑term pivot and recent intraday bounce zone.
2. ~₹143–145 — next support aligned with 20‑ to 50‑day moving averages and volume support zone.
3. ~₹139–140 — key weekly support; breaking this may open room for deeper pullback.
A weekly close below ~₹143–145 could signal weakening in the short‑term uptrend, and a break under ₹139 may turn the bias more bearish.
Technical Analysis and Chart PatternsUnderstanding Technical Analysis
At its foundation, technical analysis relies on three key assumptions. First, the market discounts everything, meaning price reflects all known information. Second, prices move in trends—once a trend starts, it is more likely to continue than reverse immediately. Third, history tends to repeat itself, as market participants often react similarly to comparable situations due to human psychology such as fear, greed, and herd behavior.
Technical analysis uses tools like price charts, indicators, and oscillators to identify trends, momentum, volatility, and potential reversal points. Charts visually represent price movements over time, making them the backbone of technical analysis. Common chart types include line charts, bar charts, and candlestick charts, with candlesticks being the most popular due to their detailed representation of price action.
Role of Charts in Technical Analysis
Charts help traders understand how price behaves over different time frames. Short-term traders may focus on minute or hourly charts, while swing traders prefer daily charts, and long-term investors may analyze weekly or monthly charts. Regardless of the time frame, the principles of technical analysis remain the same.
Key elements observed on charts include support and resistance levels, trendlines, moving averages, and volume patterns. Support represents a price level where demand is strong enough to prevent further decline, while resistance is where selling pressure prevents further price increases. These levels often act as decision points for traders.
What Are Chart Patterns?
Chart patterns are specific formations created by price movements on a chart. They represent the collective psychology of market participants and often signal continuation or reversal of trends. Chart patterns do not guarantee outcomes, but they increase the probability of a particular move when combined with other technical tools.
Chart patterns are broadly classified into three categories:
Reversal Patterns
Continuation Patterns
Bilateral Patterns
Understanding these patterns allows traders to anticipate potential breakouts, breakdowns, or trend changes.
Reversal Chart Patterns
Reversal patterns indicate a possible change in the prevailing trend. They form after a sustained upward or downward move and suggest that momentum is weakening.
One of the most well-known reversal patterns is the Head and Shoulders pattern. It consists of three peaks: a higher middle peak (the head) flanked by two lower peaks (the shoulders). When price breaks below the neckline, it signals a potential reversal from an uptrend to a downtrend. The inverse head and shoulders pattern works similarly but indicates a reversal from a downtrend to an uptrend.
Another important reversal pattern is the Double Top and Double Bottom. A double top forms when price tests a resistance level twice and fails to break higher, signaling bearish reversal. A double bottom forms when price tests a support level twice and fails to break lower, signaling bullish reversal. These patterns reflect exhaustion of buyers or sellers at critical levels.
Continuation Chart Patterns
Continuation patterns suggest a temporary pause in the market before the prevailing trend resumes. They often occur during periods of consolidation, where the market gathers strength for the next move.
Flags and Pennants are common continuation patterns. Flags appear as small rectangular consolidations sloping against the prevailing trend, while pennants resemble small symmetrical triangles. Both patterns indicate strong momentum prior to consolidation and usually resolve in the direction of the original trend.
Triangles are another popular continuation pattern, including ascending, descending, and symmetrical triangles. An ascending triangle forms with a flat resistance line and rising support, signaling bullish continuation. A descending triangle has flat support and falling resistance, signaling bearish continuation. Symmetrical triangles show contracting price action and can break in either direction, often continuing the previous trend.
Bilateral Chart Patterns
Bilateral patterns indicate uncertainty in the market and can break in either direction. Traders usually wait for confirmation before taking a position.
The Symmetrical Triangle is a prime example of a bilateral pattern. It reflects a balance between buyers and sellers, with lower highs and higher lows converging toward an apex. A breakout above resistance suggests bullish continuation, while a breakdown below support suggests bearish continuation.
Importance of Volume in Chart Patterns
Volume plays a crucial role in validating chart patterns. A breakout or breakdown accompanied by high volume is considered more reliable than one with low volume. Volume confirms the strength of market participation behind a move. For example, in a head and shoulders pattern, increasing volume on the breakdown of the neckline strengthens the bearish signal.
Combining Chart Patterns with Indicators
While chart patterns are powerful, relying on them alone can be risky. Successful traders often combine chart patterns with technical indicators such as Relative Strength Index (RSI), Moving Average Convergence Divergence (MACD), and moving averages. These indicators help confirm momentum, trend strength, and overbought or oversold conditions.
For instance, a bullish breakout from a triangle pattern combined with RSI moving above 50 and price crossing above a moving average provides stronger confirmation. This multi-tool approach reduces false signals and improves decision-making.
Limitations of Technical Analysis and Chart Patterns
Despite their usefulness, technical analysis and chart patterns have limitations. Markets can behave unpredictably due to sudden news, economic events, or geopolitical factors. False breakouts are common, especially in low-volume or highly volatile markets. Additionally, chart patterns are subjective—different traders may interpret the same pattern differently.
Discipline, risk management, and proper position sizing are essential to handle these limitations. Stop-loss orders help protect capital when a pattern fails.
Conclusion
Technical analysis and chart patterns form the backbone of modern trading strategies. By studying price behavior, identifying recurring patterns, and understanding market psychology, traders can gain valuable insights into potential future movements. Chart patterns such as head and shoulders, double tops and bottoms, flags, and triangles help traders anticipate reversals and continuations with higher probability.
However, technical analysis is not a magic formula. Its true power lies in consistent practice, combining multiple tools, and disciplined risk management. When used correctly, technical analysis and chart patterns become a powerful framework for navigating financial markets and making informed, strategic trading decisions.

Divergence Secrets Multi-Leg Strategies
1. Bull Call Spread
Buy lower strike call + Sell higher strike call
Use when moderately bullish.
2. Bear Put Spread
Buy higher strike put + Sell lower strike put
Use when moderately bearish.
3. Iron Condor
Sell OTM call + Sell OTM put
(Hedge using further OTM)
Use when expecting market to remain sideways.
4. Straddle
Buy ATM call + ATM put
Expect big movement (up or down).
5. Strangle
Buy OTM call + OTM put
Expect high volatility.
6. Covered Call
Hold stock + Sell call
Generate income.
7. Protective Put
Hold stock + Buy put
Protect portfolio.

Part 2 Support and Resistance How Option Sellers Earn Money
Option sellers profit when:
Market remains sideways
Time decay reduces premium
Volatility drops
Price stays below (for call) or above (for put) the strike
Option selling is preferred by institutions because:
Premium income is consistent
Probability of profit is higher
Time decay always works in their favour

Part 12 Trading Master Class With Experts Option trading is one of the most dynamic and flexible forms of trading in the financial markets. Unlike conventional stock trading, where investors buy or sell shares of a company, options offer the right, but not the obligation, to buy or sell an underlying asset at a predetermined price within a specific time frame. This feature makes options a powerful tool for hedging, speculation, and income generation.
At its core, an option is a contract between two parties: the buyer and the seller. The buyer pays a premium for the right to exercise the option, while the seller assumes the obligation to fulfill the contract if the buyer chooses to exercise it. Options are classified mainly into two types: call options and put options.
Call Options: Give the holder the right to buy the underlying asset at a predetermined price, called the strike price, before or on the option’s expiration date. Investors purchase call options when they anticipate the underlying asset’s price will rise.
Put Options: Give the holder the right to sell the underlying asset at the strike price within a specific period. Put options are typically bought when traders expect the asset’s price to fall.

Candle Patterns Knowledge Candlestick patterns zoom in and show you immediate price behavior — the battle happening inside intraday or single-session price movement.
Candles reveal:
1. Momentum
2. Rejection
3. Strength of buyers/sellers
4. Trend continuation or reversal
5. Low-risk entries and exits
COMMON MISTAKES TO AVOID
Trading every pattern without context
Ignoring volume confirmation
Not waiting for candle close
Using patterns in low-liquidity markets
Overtrading inside small timeframes
Neglecting market trend
Placing stop losses too tight

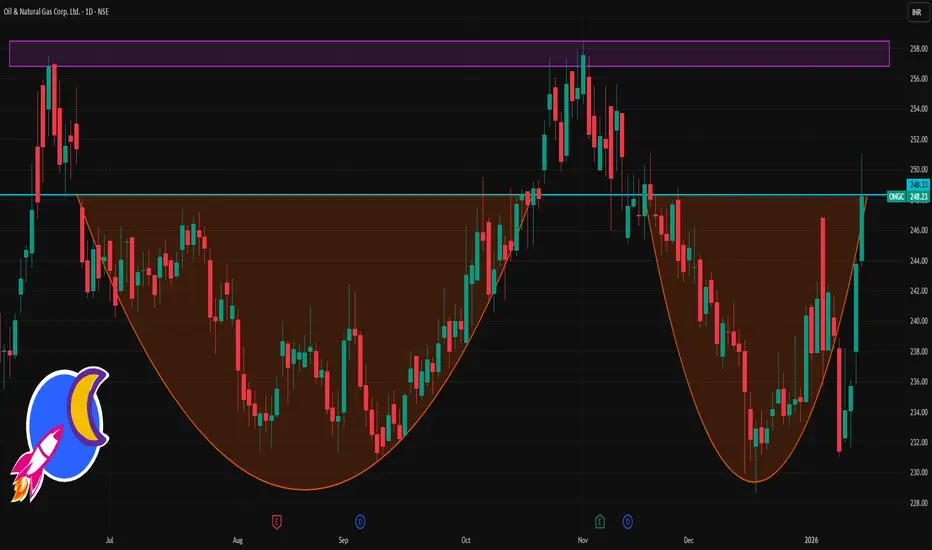
ONGC 1 Day Time Frame 📌 Live Price Snapshot (Latest Available)
Current Price (approx): ₹244 – ₹248 range on NSE today (near ₹248)
Day Low / Day High (intraday): ~₹244 / ₹251
Price may vary slightly based on live market data at the moment.
📊 Daily Pivot‑Based Levels (for Today’s Price Action)
Daily Pivot / Reference Point (based on previous session)
Pivot (PP): ~₹245.36
Daily Resistances (Upside Levels)
R1: ₹248.00
R2: ₹250.13
R3: ₹252.77
Daily Supports (Downside Levels)
S1: ₹243.23
S2: ₹240.59
S3: ₹238.46
Note: These pivot levels are classic calculations from the previous session’s high/low/close — standard for daily timeframe traders.
📌 How to Use These Levels (Daily TF)
Above Pivot (PP ≈ ₹245‑₹246): suggests intraday bullish bias, with first upside target near R1/R2.
Below Pivot: downside pressure may extend toward S1/S2.
Break of R2 (~₹250) / S2 (~₹240): often signals stronger directional continuation for the session.
HCC 1 Week Time Frame 📍 Live Price Snapshot
Approx current price: ~₹18.7–₹19.0 (latest live levels)
📊 1‑Week Technical Levels (Pivot Based)
These levels are useful for short‑term trades this week:
🔹 Weekly Pivot & Resistance
Pivot Point: ₹18.79 (base zone)
R1 (First Resistance): ~₹19.09
R2: ~₹19.56
R3: ~₹19.86
👉 Bullish view: Sustained trade above R1 ~₹19.1–₹19.3 may signal short‑term upside continuation towards R2/R3.
🔻 Weekly Support Levels
S1: ~₹18.32
S2: ~₹18.02
S3: ~₹17.55
👉 Bearish view: A break below S2 ~₹18.0 can open risk toward S3 ~₹17.5.
📌 Short‑Term Trend Indicators
RSI (~neutral): ~46–56 — showing neither strong buy nor oversold pressure currently.
Moving Averages: Price is near short‑term moving averages, but all major mid‑term EMAs/SMAs are above price indicating a bearish bias in broader trend.
Summary of Technical Bias:
Bullish above pivot/R1 (~₹18.8–19.1): Could test R2 ~₹19.5 and R3 ~₹19.8+.
Neutral range: Between ₹18.3–₹19.1.
Bearish below S1/S2 (~₹18.3/₹18.0): Potential move down toward ₹17.5 support.
🧠 Weekly Outlook (Quick Interpret)
✔ Immediate resistance range: ₹19.1–₹19.8
✔ Immediate support range: ₹18.0–₹18.5
✔ Trend context: Short‑term consolidation with a slight bearish edge on broader SMAs; buy setup improves only on clear weekly strength above the pivot/resistance zone.

TORNTPOWER 1 Day Time Frame 📊 Current / Recent Price
• Around ₹1,345 – ₹1,350 (recent close / market price) as per latest exchange data.
🔹 Daily Pivot Levels
These are widely used intraday reference levels calculated from previous price action:
Pivot (central) — ~₹1,336.8
R1 (first resistance) — ~₹1,369 – ₹1,370
R2 (second resistance) — ~₹1,387 – ₹1,395
R3 (third resistance) — ~₹1,419 – ₹1,452
🔸 Support Levels
S1 (first support) — ~₹1,318 – ₹1,329
S2 (second support) — ~₹1,307 – ₹1,313
S3 (third support) — ~₹1,279 – ₹1,301
📈 Interpretation (Daily Time Frame)
• Above Pivot (~₹1,337) → bullish bias for the day; resistance targets around ₹1,370–₹1,395+.
• Below Pivot → bearish bias; downside support levels near ₹1,318, then ₹1,307–₹1,301.
• Strong breakout above ₹1,395–₹1,419 would open room toward higher resistance clusters.
• Key near-term support that protects the downside sits around ₹1,307–₹1,279.

The Framework That Protects Markets and InvestorsTrading Regulations:
Trading regulations form the backbone of modern financial markets. They define how markets operate, who can participate, what instruments can be traded, and how risks are managed. Without regulation, markets would be vulnerable to manipulation, fraud, excessive speculation, and systemic crises. Over time, governments and regulatory bodies across the world have developed comprehensive trading regulations to ensure transparency, fairness, stability, and investor protection. Understanding trading regulations is essential for traders, investors, brokers, and institutions because compliance is not optional—it is fundamental to sustainable participation in financial markets.
Meaning and Purpose of Trading Regulations
Trading regulations are a set of rules, laws, and guidelines established by regulatory authorities to govern the buying and selling of financial instruments such as stocks, bonds, derivatives, commodities, and currencies. The primary purpose of these regulations is to maintain orderly markets, protect investors from unfair practices, reduce systemic risk, and promote confidence in the financial system.
Markets thrive on trust. When participants believe that prices are fair, information is transparent, and misconduct is punished, they are more willing to invest capital. Trading regulations aim to create this trust by enforcing disclosure standards, monitoring trading activity, and penalizing illegal behavior like insider trading or market manipulation.
Key Regulatory Authorities Across the World
Every country has one or more regulatory bodies responsible for overseeing financial markets. In India, the Securities and Exchange Board of India (SEBI) regulates equity, derivatives, and mutual fund markets, while the Reserve Bank of India (RBI) oversees currency markets and banking-related trading. In the United States, agencies like the Securities and Exchange Commission (SEC) and the Commodity Futures Trading Commission (CFTC) regulate securities and derivatives markets. Globally, organizations such as the Financial Stability Board (FSB) and the International Organization of Securities Commissions (IOSCO) help coordinate regulatory standards.
Although the structure differs across countries, the objectives of these regulators are broadly similar: investor protection, market integrity, and financial stability.
Core Principles of Trading Regulation
Most trading regulations are built on a few fundamental principles. Transparency is one of the most important. Companies must disclose accurate financial information, material events, and risks so that investors can make informed decisions. Fairness ensures that no participant has an unfair advantage due to access to non-public information or manipulative practices. Accountability holds intermediaries such as brokers, exchanges, and clearing corporations responsible for their actions. Finally, risk control mechanisms aim to prevent excessive leverage, speculative bubbles, and cascading failures.
These principles are reflected in rules related to disclosures, reporting requirements, position limits, margin norms, and surveillance systems.
Regulation of Market Participants
Trading regulations define who can participate in the markets and under what conditions. Retail investors, institutional investors, foreign investors, brokers, dealers, and market makers all fall under specific regulatory frameworks. Brokers and intermediaries must obtain licenses, meet capital adequacy norms, follow client protection rules, and adhere to strict compliance standards.
Know Your Customer (KYC) and Anti-Money Laundering (AML) regulations are critical components. They require intermediaries to verify the identity of clients and monitor transactions to prevent illegal activities such as money laundering or terrorist financing. These rules not only protect the financial system but also enhance global cooperation among regulators.
Regulation of Trading Instruments
Different financial instruments are regulated differently based on their risk profile and complexity. Equity trading focuses heavily on disclosure, corporate governance, and insider trading prevention. Derivatives trading, such as futures and options, involves additional rules on margin requirements, position limits, and settlement mechanisms due to higher leverage and risk.
Commodity markets are regulated to prevent hoarding, price manipulation, and excessive speculation that could distort real-world supply and demand. Currency and forex trading is often more tightly controlled, especially in emerging economies, to protect macroeconomic stability and manage capital flows.
Market Surveillance and Enforcement
An essential part of trading regulation is continuous market surveillance. Exchanges and regulators use advanced technology to monitor trading patterns, detect unusual price movements, and identify suspicious activities. Algorithms flag potential cases of insider trading, front-running, spoofing, and circular trading.
When violations occur, regulators have the power to investigate, impose penalties, suspend trading accounts, cancel licenses, and even initiate criminal proceedings. Strong enforcement acts as a deterrent and reinforces market discipline.
Investor Protection Measures
Investor protection is at the heart of trading regulation. Regulations mandate segregation of client funds, ensuring that brokers do not misuse investor money. Compensation funds and investor protection funds are established to safeguard investors in case of broker default.
Risk disclosure documents, suitability requirements, and product labeling are also important tools. They ensure that investors understand the risks involved before trading complex products such as derivatives or leveraged instruments. In many jurisdictions, regulators actively promote financial literacy to help investors make informed decisions.
Risk Management and Systemic Stability
Trading regulations play a vital role in controlling systemic risk—the risk that failure in one part of the financial system could trigger widespread instability. Margin requirements, daily mark-to-market settlements, circuit breakers, and position limits are designed to contain losses and prevent panic.
Circuit breakers, for example, temporarily halt trading during extreme market volatility, allowing participants time to absorb information and prevent irrational selling or buying. Clearing corporations and central counterparties reduce counterparty risk by guaranteeing settlements.
Challenges in Modern Trading Regulation
With the rise of algorithmic trading, high-frequency trading, cryptocurrencies, and global interconnected markets, regulators face new challenges. Technology has increased market speed and complexity, making surveillance more difficult. Cross-border trading requires cooperation among regulators with different legal systems and priorities.
Balancing innovation with regulation is another challenge. Over-regulation can stifle market growth and innovation, while under-regulation can lead to instability and crises. Regulators continuously adapt rules to address emerging risks without harming market efficiency.
Conclusion
Trading regulations are essential for the healthy functioning of financial markets. They provide a structured environment where participants can trade with confidence, knowing that rules are in place to ensure fairness, transparency, and stability. While regulations may sometimes seem restrictive, they ultimately serve a protective purpose—safeguarding investors, maintaining market integrity, and preventing systemic crises.
For traders and investors, understanding trading regulations is not just about compliance; it is about making smarter, safer, and more sustainable decisions. As markets evolve, trading regulations will continue to adapt, shaping the future of global finance and ensuring that growth is built on trust and discipline rather than speculation and chaos.

BAJAJ-AUTO 1 Day Time Frame 📊 Live Price Snapshot (Daily Time Frame)
Bajaj Auto Ltd (BAJAJ-AUTO)
📍 Current price: ₹9,579.50 (latest NSE price)
📍 Today’s Intraday Range:
Low: ₹9,494
High: ₹9,610
📈 Daily Pivot & Key Levels
Pivot / Reference Level
Pivot Point: ~₹9,487 ✨
🔼 Immediate Resistance Levels (Upside)
1. R1: ~₹9,655
2. R2: ~₹9,750
3. R3: ~₹9,922 – higher resistance zone
👉 Holding above these on the daily chart suggests bullish intraday momentum.
🔽 Immediate Support Levels (Downside)
1. S1: ~₹9,389
2. S2: ~₹9,220
3. S3: ~₹9,122 – deeper support zone
👉 If price drops below these, bearish pressure may increase intraday.
📌 Short Interpretation (1-Day View)
Bullish view:
✔ If price stays above the pivot (~₹9,487) and breaks R1/R2, momentum can extend toward R3 (~₹9,920+).
Bearish view:
✖ If price breaks below S1 (~₹9,389) and then S2 (~₹9,220), downside may test S3 (~₹9,122).

CCL 1 Day Time Frame 📊 Daily Pivot & Levels (most recent)
Pivot Point: ~₹931 – ₹931.5
Resistance Levels:
• R1: ~₹958 – ₹959
• R2: ~₹975 – ₹976
• R3: ~₹1,000 – ₹1,003
Support Levels:
• S1: ~₹915 – ₹915
• S2: ~₹887 – ₹887
• S3: ~₹871 – ₹871
These pivot levels are calculated from typical daily price action and help indicate intraday sentiment — above pivot shows bullish bias and below pivot shows bearish bias.
📉 Alternate Daily Support/Resistance (classic pivot)
From other daily pivot models:
S1: ~₹920 • S2: ~₹912 • S3: ~₹902
R1: ~₹930 • R2: ~₹940 • R3: ~₹949 – ₹958
(This set is slightly tighter and useful if price action stays rangebound.)
📌 Moving Average Context (Daily)
Current daily price is around ₹920–₹940 range with most short-term moving averages above price, indicating near-term resistance overhead:
• 20-day SMA: ~₹956
• 50-day SMA: ~₹974
• 100-day SMA: ~₹925
• 200-day SMA: ~₹848
These moving averages can act as dynamic support/resistance — especially the 20/50 day averages if price attempts breakout.
📝 How Traders Use These Levels
Bullish view: Above pivot (~₹931) with target at R1/R2 zones (~₹958 / ₹975).
Bearish view: Break below S1 (~₹915) with targets toward S2/S3 (~₹887–₹871).
Range trades: Buying near support and trimming near resistance if volume remains low.

Event Trading Hacks: Maximize Your Profits TodayEvent trading is one of the most powerful short-term trading approaches in financial markets. Unlike long-term investing, which relies on fundamentals playing out over years, event trading focuses on specific, time-bound events that can cause sharp price movements in stocks, indices, commodities, or currencies. When executed with discipline and strategy, event trading can generate significant profits in a relatively short period. However, it also carries high risk, making smart “hacks” and structured planning essential.
Below is a detailed, practical guide to event trading hacks that can help you maximize profits while managing risk effectively.
1. Understand What Truly Moves the Market
The first hack of event trading is knowing which events actually matter. Not every news headline leads to profitable opportunities. Focus on high-impact events, such as:
Corporate earnings announcements
Mergers and acquisitions
Government policy changes and budgets
Central bank interest rate decisions
Inflation, GDP, and employment data
Geopolitical events and global crises
Markets move not just on the event itself, but on the difference between expectations and reality. If results match expectations, prices may barely move. Big profits come when outcomes surprise the market.
2. Trade Expectations, Not Just the Outcome
A common beginner mistake is trading after the news breaks. Professional event traders often position themselves before the event, based on market expectations.
Key expectation indicators include:
Analyst forecasts
Market consensus estimates
Options implied volatility
Price action leading into the event
If a stock has already rallied strongly before earnings, good results may be “priced in.” The real hack is identifying when expectations are too optimistic or too pessimistic and positioning accordingly.
3. Use Volatility as Your Ally
Events create volatility, and volatility is opportunity. One of the smartest event trading hacks is trading volatility instead of direction, especially using derivatives.
Examples:
Straddles and strangles to profit from big moves in either direction
Calendar spreads when volatility is mispriced
Volatility crush strategies after earnings
Rather than guessing whether the market will go up or down, you trade how much it will move. This reduces directional bias and improves consistency.
4. Time Your Entry with Precision
Timing is critical in event trading. Entering too early exposes you to unnecessary risk; entering too late means missing the move.
Smart timing hacks include:
Entering positions after consolidation before an event
Watching volume spikes indicating smart money activity
Using support and resistance levels for precise entry
Avoid impulsive trades just before the announcement unless your strategy is specifically designed for it.
5. Always Define Risk Before Reward
Event trading can wipe out capital if risk is unmanaged. The most important hack is capital protection first, profit second.
Risk management rules:
Never risk more than 1–2% of capital per trade
Use predefined stop-loss levels
Avoid oversized positions during high volatility
Hedge positions when possible
Professionals survive because they focus on staying in the game, not on one big trade.
6. Focus on Liquidity, Not Just News
High-impact events in illiquid stocks can lead to erratic price movements and slippage. One key hack is trading liquid instruments, such as:
Large-cap stocks
Index futures and options
Highly traded commodities and currencies
Liquidity ensures better execution, tighter spreads, and reliable price behavior during volatile moments.
7. Master Post-Event Trading Opportunities
Many traders believe the opportunity ends once the event is over. In reality, post-event trades often offer cleaner setups.
Post-event hacks include:
Trading pullbacks after strong breakout reactions
Entering trend continuation trades after clarity emerges
Exploiting overreactions caused by panic buying or selling
Markets often take time to digest information, creating secondary opportunities with lower risk.
8. Separate Emotion from Execution
Events trigger emotions—fear, greed, excitement—which lead to impulsive decisions. One of the most underrated hacks is strict emotional control.
Best practices:
Follow a written trading plan
Avoid revenge trading after losses
Accept that missing a trade is better than forcing one
Review trades objectively, not emotionally
Consistency beats excitement in event trading.
9. Track Historical Event Behavior
Markets have memory. Certain stocks, sectors, or indices react similarly to recurring events.
For example:
Some stocks consistently rise before earnings and fall after
Certain sectors react strongly to interest rate changes
Commodities follow seasonal patterns around reports
Studying historical event reactions gives you a statistical edge and improves decision-making.
10. Combine Technicals with Fundamentals
The best event trading setups come from confluence—when fundamentals and technicals align.
Examples:
Strong earnings expected + bullish chart breakout
Weak macro data expected + breakdown below key support
Policy change rumor + volume expansion
This alignment increases probability and improves risk-to-reward ratios.
11. Avoid Overtrading Events
Not every event is worth trading. One of the smartest hacks is selectivity.
Professional traders:
Trade only high-conviction events
Skip unclear or low-impact announcements
Wait patiently for ideal setups
Quality over quantity is the foundation of long-term success.
12. Build a Repeatable Event Trading Framework
Consistency comes from structure. Your event trading framework should include:
Event selection criteria
Entry and exit rules
Position sizing formula
Risk management guidelines
Post-trade review process
This turns event trading from gambling into a professional system.
Conclusion
Event trading offers exceptional profit potential because markets move fastest when information changes. However, speed without strategy leads to losses. The real edge lies in preparation, expectation analysis, volatility management, and disciplined execution.
By applying these event trading hacks—understanding market psychology, managing risk, trading volatility, and staying emotionally neutral—you can significantly improve your odds of success. Remember, event trading is not about predicting the future perfectly; it’s about positioning intelligently when opportunity and probability align.
