Part 4 Learn Institutional Trading Participants in the Options Market
There are four types of participants in the options market:
Buyers of Call Options – Expect the price to go up.
Sellers of Call Options – Expect the price to stay the same or fall.
Buyers of Put Options – Expect the price to fall.
Sellers of Put Options – Expect the price to stay the same or rise.
Buyers take limited risk (the premium) with unlimited profit potential, while sellers take limited profit (the premium received) but unlimited risk.
Trendcontinuation

Part 3 Learn Institutional Trading How Option Trading Works
When you trade options, you’re speculating on how the price of the underlying asset will move within a specific time frame. Here’s how it works for both types of options:
a) Call Option Example
Suppose Reliance stock is trading at ₹2,500. You buy a Call Option with a strike price of ₹2,520, paying a premium of ₹20.
b) Put Option Example
You buy a Put Option on Reliance with a strike price of ₹2,480 and pay a ₹15 premium.

Part 2 Ride The Big Moves Key Terminology in Option Trading
To understand option trading, you must be familiar with a few important terms:
Underlying Asset: The financial instrument (e.g., NIFTY, Bank NIFTY, Reliance Industries) on which the option is based.
Strike Price: The fixed price at which the underlying can be bought or sold.
Premium: The price paid by the buyer to the seller for owning the option contract.
Expiry Date: The last day on which the option can be exercised. In India, index options usually expire weekly or monthly.
Lot Size: The minimum quantity of the underlying asset that can be traded per option contract.
In the Money (ITM): When exercising the option gives a profit.
At the Money (ATM): When the strike price equals the current market price.
Out of the Money (OTM): When exercising the option gives no profit.

ANGELONE 1 Day Time Frame 📌 Key Levels (Daily)
Pivot (Classic): ≈ ₹2,675.77.
Resistance zones:
R1 (Classic): ~ ₹2,713.73
R2: ~ ₹2,747.97
Support zones:
S1 (Classic): ~ ₹2,641.53
S2: ~ ₹2,603.57
⚠️ Important Caveats
These levels are calculated from daily data — they do not guarantee the stock will only move within these ranges or behave exactly as outlined.
Market conditions, news, F&O flows, and broader sector moves can invalidate these levels rapidly.
Use these levels along with your own risk management: stop-losses, position size, and timeframe.
The data may have a delay or slight inaccuracy — always cross-verify with live quotes.

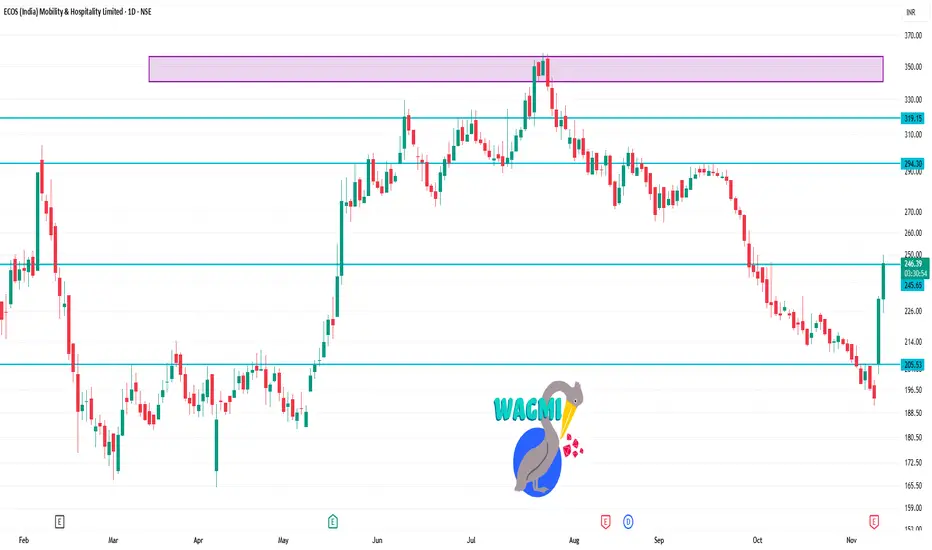
ECOSMOBLTY 1 Day Time Frame Last traded price: ₹ 246.55 (up ~6.69% today)
Day’s range: Low ~ ₹ 225.20, High ~ ₹ 248.50
52-week range: Low ~ ₹ 165.00, High ~ ₹ 361.40
⚠️ Caveats
Technical outlook alone doesn’t account for fundamental news, upcoming earnings, macro factors. For example, their upcoming board meeting/earnings may influence price sharply.
The “oversold” RSI does not guarantee a reversal — especially in a strong downtrend, oversold can persist.
Trading on a 1-day time-frame is riskier (higher volatility, noise) — keep tight risk control.
Part 1 Ride The Big Moves What is an Option?
An option is a financial derivative whose value is derived from an underlying asset such as a stock, index, or commodity. Options come in two primary forms:
Call Option: It gives the holder the right to buy the underlying asset at a predetermined price (known as the strike price) before or on the expiry date.
Put Option: It gives the holder the right to sell the underlying asset at a predetermined strike price before or on the expiry date.
The buyer of an option pays a premium to the seller (also called the writer) for this right. The seller receives the premium as income but takes on the obligation to buy or sell the asset if the buyer chooses to exercise the option.

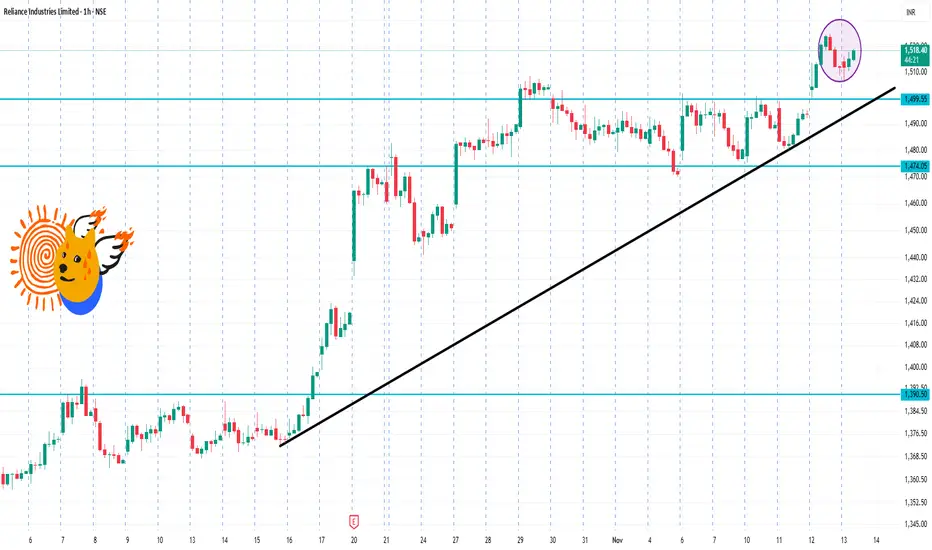
RIL 1 Hour Time Frame🔍 Current basics
Latest traded price: ~ ₹1,518 on NSE.
52-week range: Low ~ ₹1,114.85, High ~ ₹1,551.00.
Technical indicator summary (on 1-hour/higher timeframes) shows a “Strong Buy” bias.
⚠️ Risks / Caveats
Even though the technicals are bullish, the stock is close to its 52-week high (~ ₹1,551). Highs often mean less “room” for upside without some pullback.
Intraday patterns can change quickly with macro news or sector moves (eg: oil & gas, regulatory).
Support at ~₹1,500 is fairly close to current; a break could expose the ₹1,470–₹1,480 region.
Because this is a large-cap and widely held stock, institutional moves and volume matter a lot.
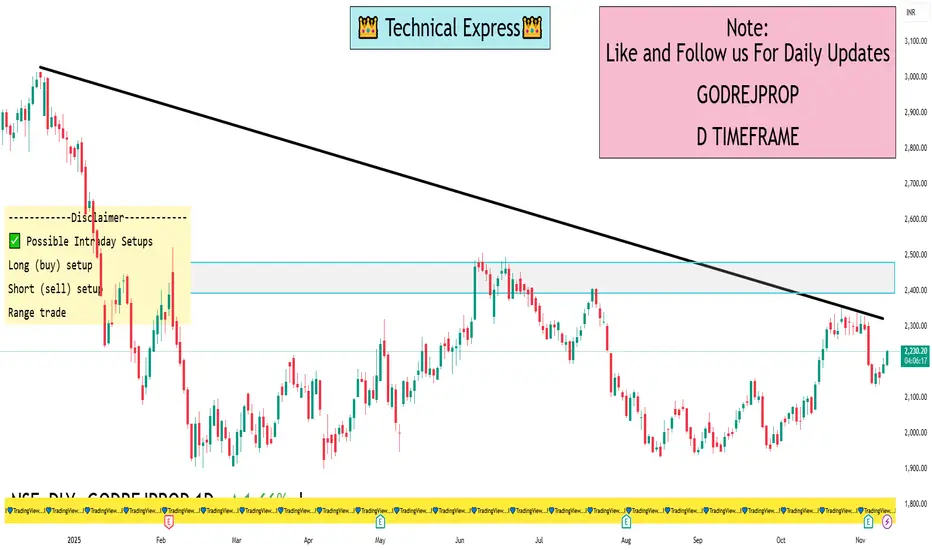
GODREJPROP 1 Day Time Frame📊 Current Intraday Snapshot
Day’s range: approx ₹ 2,187.10 (low) to ₹ 2,225.90 (high).
Recent price hovering around ₹ 2,213-2,225 region.
52-week range: ~ ₹ 1,900 (low) to ₹ 3,015.90 (high).
🔍 Key Levels to Watch (1-Day)
Support zone: The lower end of today’s range (~ ₹ 2,187) acts as immediate support. If price falls below this, short-term weakness may show up.
Resistance zone: The upper end (~ ₹ 2,225-2,226) is the immediate intraday resistance. A clean breakout above this with volume could open a momentum leg.
Mid-range pivot: Around ~ ₹ 2,210-2,220 could act as a pivot region — price consolidating here may indicate indecision before a directional move.
If breakout up: If price breaks above ~ ₹ 2,225 with conviction, next upside may target maybe ~ ₹ 2,250-2,270 (intraday extension zone) though this requires confirmation.
If breakdown: If price drops below ~ ₹ 2,187, downside could test prior support zones (which might lie closer to ~ ₹ 2,150-2,160 based on recent history) though I don’t have that exact level today.
✅ Possible Intraday Setups
Long (buy) setup: Wait for price to break above resistance (~ ₹ 2,225) with strong volume → enter long with stop just below pivot (~ ₹ 2,210) → target near ~ ₹ 2,250-2,270.
Short (sell) setup: If price drops and closes below support (~ ₹ 2,187) and shows weakness → enter short with stop just above pivot (~ ₹ 2,210) → target maybe ~ ₹ 2,150-2,160.
Range trade: If price stays between support and resistance (₹ 2,187-₹ 2,225) → consider trading the range: buy near support, sell near resistance, with tight risk control.
How Businesses Can Grow in the Trading Market1. Understanding the Trading Market
The trading market encompasses multiple segments—stock trading, forex (foreign exchange), commodity trading, derivatives, and cryptocurrency trading. Each market functions under different regulatory, economic, and technological frameworks but shares a common goal: facilitating the exchange of value and risk between buyers and sellers.
For businesses entering trading, the first step to growth is a deep understanding of the market structure, participant behavior, and factors influencing price movements. Knowledge of supply-demand dynamics, macroeconomic indicators, and geopolitical influences helps in making informed trading decisions. Companies that invest in market intelligence and data analysis often find themselves ahead of competitors.
2. Building a Strong Trading Infrastructure
A key driver of growth in the trading market is technological infrastructure. In today’s environment, speed, accuracy, and connectivity define success. Businesses must invest in:
Trading Platforms: Using robust platforms like MetaTrader, Bloomberg Terminal, or proprietary systems ensures efficiency in execution.
Data Analytics Tools: Real-time data processing, AI-driven insights, and predictive analytics help in identifying opportunities early.
Connectivity and APIs: Fast internet connections and integration with exchanges through APIs enhance automation and scalability.
Cybersecurity: As trading becomes digital, safeguarding systems from cyber threats is essential for operational continuity and client trust.
A business that leverages advanced technology can scale operations globally while minimizing transaction errors and latency.
3. Strategic Diversification
One of the fundamental principles for business growth in the trading market is diversification. Relying on a single asset class or market exposes a company to unnecessary risk. Successful trading businesses diversify in several ways:
Asset Diversification: Engaging in equities, forex, commodities, and derivatives reduces dependence on one market.
Geographical Diversification: Expanding into international markets allows firms to capitalize on regional opportunities and time-zone differences.
Product Diversification: Offering products like ETFs, mutual funds, or structured products can attract a broader client base.
Diversification not only stabilizes revenue but also opens multiple income streams that cushion the impact of market volatility.
4. Leveraging Technology and Automation
Technology plays a transformative role in the trading market. Automated and algorithmic trading systems have revolutionized how businesses operate. Algorithms can execute large volumes of trades within milliseconds based on pre-set strategies, removing emotional bias and increasing efficiency.
Key technological advancements supporting business growth include:
Artificial Intelligence (AI) and Machine Learning (ML): AI helps forecast price movements using pattern recognition and big data analysis.
Blockchain Technology: It enhances transparency and reduces settlement times, especially in cryptocurrency and cross-border trading.
Cloud Computing: Enables real-time access to trading data and remote operation, allowing global teams to collaborate seamlessly.
Firms that embrace automation and digital transformation gain a competitive advantage through reduced costs, higher accuracy, and faster decision-making.
5. Developing a Risk Management Framework
Trading is inherently risky due to market fluctuations, leverage, and liquidity issues. Businesses can grow sustainably only when they balance risk and reward. A strong risk management strategy involves:
Position Sizing: Limiting exposure per trade to a fixed percentage of total capital.
Stop-Loss Orders: Automatically exiting losing trades to prevent large losses.
Hedging: Using derivatives like options and futures to protect against adverse price movements.
Stress Testing: Simulating different market scenarios to assess potential impacts on the portfolio.
Risk management not only safeguards capital but also builds confidence among investors and clients.
6. Regulatory Compliance and Transparency
Growth in the trading market depends heavily on maintaining regulatory compliance. Governments and financial authorities such as SEBI (India), SEC (USA), and FCA (UK) impose rules to ensure fair trading and investor protection. Businesses that adhere to these regulations gain credibility and attract institutional clients.
Transparency in reporting, accurate record-keeping, and ethical conduct are vital for long-term growth. A reputation for integrity can distinguish a trading firm in a competitive marketplace.
7. Building a Skilled Team
A successful trading business requires a mix of analytical, technical, and strategic expertise. Recruiting skilled professionals—traders, analysts, risk managers, and developers—creates a strong foundation for growth. Additionally, ongoing training ensures the team stays updated with market trends, tools, and compliance requirements.
Companies should encourage knowledge sharing, foster innovation, and provide performance-based incentives. Human capital remains one of the most valuable assets in trading operations.
8. Adopting Data-Driven Decision Making
Data has become the new currency of the trading world. Businesses that leverage data effectively can identify trends, forecast market behavior, and optimize trading strategies. Using big data analytics allows traders to process massive volumes of historical and real-time information for better decision-making.
Predictive analytics tools can detect early signs of market shifts, while sentiment analysis (e.g., through news or social media data) provides insights into investor psychology. Data-driven approaches minimize guesswork and enhance precision.
9. Strategic Partnerships and Networking
Collaborations with financial institutions, liquidity providers, and technology vendors can accelerate growth. For instance, partnering with brokers or fintech platforms enables access to liquidity pools and advanced market tools. Networking at global financial conferences or online forums also helps in building relationships that open doors to new opportunities and insights.
Strategic alliances expand reach, enhance credibility, and reduce operational costs through shared resources.
10. Marketing and Branding in the Trading Sector
In a competitive trading environment, marketing and brand differentiation are crucial. Businesses must position themselves as reliable, transparent, and technologically advanced. Effective strategies include:
Content Marketing: Publishing insightful market analyses and trading education to attract clients.
Social Media Presence: Using platforms like LinkedIn, X (formerly Twitter), and YouTube to engage traders.
Client Support and Service Quality: Building trust through prompt assistance and transparent communication.
A strong brand helps attract both retail and institutional clients, fueling growth.
11. Expanding into New Markets
Globalization has made it easier for trading businesses to enter emerging markets where trading activity is growing rapidly. Markets in Asia, Africa, and Latin America offer rising participation and economic potential. Understanding local regulations and customizing products for regional demand helps in capturing new audiences.
Expanding internationally diversifies revenue and increases resilience against downturns in any single economy.
12. Continuous Innovation and Adaptability
The trading market evolves constantly with changing technologies, regulations, and investor preferences. To grow, businesses must remain adaptable—embracing new tools like decentralized finance (DeFi), sustainable investing, and tokenized assets.
Innovation in products, strategies, and services keeps a firm relevant and competitive. Regular review of trading models ensures alignment with current market realities.
Conclusion
Growth in the trading market is not achieved overnight—it results from a blend of strategic planning, technological investment, skilled management, and disciplined execution. Businesses that focus on diversification, automation, risk management, and compliance can build a robust foundation for sustainable expansion.
In a world where financial markets are interconnected and data-driven, success depends on how well a business can adapt to change, leverage technology, and maintain trust. By combining innovation with prudence, any trading enterprise can evolve from a small participant to a global leader in the dynamic world of trading.

Derivatives Trading Strategies and Option Trading ExplainedUnderstanding Derivatives
A derivative is a financial contract whose value depends on the performance of an underlying asset. Common derivatives include:
Futures contracts: Agreements to buy or sell an asset at a future date at a predetermined price.
Forwards: Similar to futures but traded over-the-counter (OTC), meaning they are privately negotiated.
Options: Contracts that give the holder the right, but not the obligation, to buy or sell an asset.
Swaps: Agreements to exchange cash flows or other financial instruments.
Derivatives help investors manage price risk, hedge exposure, or profit from volatility. However, they also carry significant leverage, which can amplify both profits and losses.
Major Derivative Trading Strategies
1. Hedging Strategies
Hedging is a risk management approach used to protect against adverse price movements. For instance, a farmer expecting to sell wheat in three months can use futures contracts to lock in the selling price, ensuring stable revenue even if prices fall later. Similarly, companies dealing in foreign currencies use currency futures or options to protect themselves from exchange rate volatility.
Example:
A portfolio manager holding large equity exposure may use index futures to hedge against a potential market downturn. If the market falls, losses in the stock portfolio can be offset by gains in the futures position.
2. Speculative Strategies
Speculators use derivatives to profit from anticipated price movements. They take positions based on their market outlook without owning the underlying asset.
For example, if a trader expects oil prices to rise, they might buy oil futures to benefit from price appreciation. If the prediction is correct, the trader profits from the difference between the buying and selling price.
Speculative trades are risky but can offer high rewards due to leverage. However, they require careful risk control to avoid substantial losses.
3. Arbitrage Strategies
Arbitrage exploits price discrepancies of the same asset across different markets or forms. Traders buy the asset where it’s undervalued and sell it where it’s overvalued, locking in risk-free profits.
Example:
If a stock’s price in the cash market differs from its futures price beyond theoretical limits, an arbitrageur can simultaneously buy the stock and sell the future, profiting when prices converge.
4. Spread Trading
Spread trading involves taking offsetting positions in related derivatives to profit from the price difference between them rather than outright price movements. Examples include:
Calendar spreads: Buying and selling futures with different expiry dates.
Inter-commodity spreads: Trading between related commodities, like crude oil and heating oil.
Inter-market spreads: Exploiting price differences between similar assets on different exchanges.
These strategies reduce exposure to market direction and focus on relative performance.
Introduction to Option Trading
Options are among the most versatile derivative instruments. An option contract gives the buyer the right, but not the obligation, to buy or sell an asset at a predetermined price (called the strike price) before or at the contract’s expiration date.
There are two main types of options:
Call Option: Gives the holder the right to buy the underlying asset.
Put Option: Gives the holder the right to sell the underlying asset.
The seller (or writer) of the option has the obligation to fulfill the contract if the buyer chooses to exercise it. Option trading strategies range from simple directional bets to complex multi-leg structures designed to profit in various market conditions.
Key Components of Option Trading
Premium: The price paid by the option buyer to the seller for the contract.
Strike Price: The price at which the asset can be bought or sold.
Expiration Date: The date the option contract expires.
Intrinsic Value: The actual value if the option were exercised today.
Time Value: The additional value based on volatility and time remaining until expiration.
Options are influenced by factors such as volatility, interest rates, time decay, and the price of the underlying asset.
Option Trading Strategies
1. Directional Strategies
These strategies aim to profit from a forecasted price move.
a) Long Call
A trader buys a call option expecting the asset’s price to rise.
Profit: Unlimited as price increases.
Loss: Limited to the premium paid.
Example: Buying a call on Nifty at 22,000 strike if you expect it to rise above that level.
b) Long Put
Used when expecting a decline in price.
Profit: Rises as asset price falls.
Loss: Limited to the premium paid.
c) Short Call and Short Put
Writing calls or puts allows traders to collect premiums, but they face potentially unlimited loss if the market moves against them. These are generally used by experienced traders or those with a hedge in place.
2. Neutral Strategies
When traders expect little movement, they use strategies that benefit from time decay or low volatility.
a) Covered Call
The trader holds the underlying asset and sells a call option on it.
Generates income from the premium.
Ideal when expecting limited upside.
b) Iron Condor
Combines both call and put spreads to earn premium income when the asset stays within a range.
Profit: Limited to net premium received.
Loss: Limited if price breaks out of the range.
c) Butterfly Spread
Involves buying one in-the-money option, selling two at-the-money options, and buying one out-of-the-money option. It profits when prices remain stable around the middle strike.
3. Volatility Strategies
These strategies target changes in volatility rather than price direction.
a) Straddle
Buying both a call and put at the same strike price and expiry.
Profits from large price movements in either direction.
Loss occurs if the price remains stable (premium decay).
b) Strangle
Similar to a straddle but uses different strike prices for the call and put. It is cheaper but requires a larger move to profit.
c) Calendar Spread
Involves buying and selling options of the same strike but different expiration dates, betting on changes in time decay or volatility.
Risk Management in Derivative Trading
Derivatives and options can magnify returns but also amplify losses. Therefore, risk management is critical:
Position sizing: Limit exposure to a fixed percentage of total capital.
Stop-loss orders: Automatically exit losing positions.
Diversification: Spread trades across assets and maturities.
Hedging: Use options to protect portfolios against extreme moves.
Greeks management: Monitor option sensitivities—Delta (price movement), Theta (time decay), Vega (volatility), and Gamma (rate of Delta change)—to understand risk dynamics.
Conclusion
Derivatives and option trading represent a sophisticated domain within financial markets, offering vast opportunities for hedging, speculation, and income generation. While derivatives like futures and forwards help manage risk or exploit arbitrage opportunities, options add flexibility through their asymmetrical payoff structure. Mastering derivatives requires understanding market behavior, volatility, and strategic planning. When used responsibly, derivatives can protect portfolios and generate consistent returns. However, due to leverage and complexity, disciplined risk control and continuous learning are essential for long-term success.
Crypto Assets Secrets: The Hidden Dynamics of Digital Wealth1. The Foundational Secret: Blockchain is the Core
The first and most fundamental secret of crypto assets lies in the technology that powers them — the blockchain. Unlike traditional financial systems controlled by banks or governments, blockchain is a decentralized digital ledger that records transactions securely, transparently, and permanently. Each transaction is verified through a consensus mechanism, ensuring trust without intermediaries.
What makes this technology revolutionary is its immutability and transparency. Every coin or token can be traced to its origin, which eliminates fraud and enables a new form of digital ownership. Investors who understand blockchain’s technical structure — from proof-of-work (PoW) to proof-of-stake (PoS) — gain insights into which crypto projects are sustainable versus those that are purely speculative.
2. The Scarcity Secret: Supply Mechanisms Define Value
Another major secret behind crypto value lies in tokenomics — the economic design of a cryptocurrency. Bitcoin, for example, has a fixed supply of 21 million coins, making it deflationary. This limited availability fuels demand, positioning Bitcoin as a “digital gold.”
In contrast, many altcoins use different supply models — such as inflationary tokens or tokens with burning mechanisms. Understanding supply dynamics, such as halving events, staking rewards, and token burns, can provide an edge. Long-term investors often look for assets with a balanced token supply and strong utility, as these tend to appreciate in value over time.
3. The Adoption Secret: Utility Drives Sustainability
While many cryptocurrencies emerge daily, few achieve lasting success. The secret to survival in the crypto market is real-world utility. Coins that solve genuine problems — such as Ethereum’s smart contracts, Chainlink’s decentralized oracles, or Ripple’s cross-border payment systems — tend to achieve mainstream adoption.
Utility also extends into DeFi platforms, NFT marketplaces, and metaverse ecosystems. Projects that integrate their tokens into actual services or decentralized applications (dApps) create intrinsic demand. The secret is to identify projects where use cases and network effects fuel organic growth rather than mere hype.
4. The Liquidity Secret: Market Depth and Whale Control
Liquidity — the ease of buying or selling an asset without drastically affecting its price — is a critical yet often overlooked secret of crypto trading. Cryptocurrencies with high liquidity (like Bitcoin and Ethereum) are more stable and less prone to manipulation. In contrast, low-liquidity altcoins can experience extreme volatility due to the influence of whales — large holders who can manipulate prices with a few transactions.
Smart traders monitor order books, volume profiles, and whale wallet movements to predict short-term market fluctuations. Tools like on-chain analytics (Glassnode, Santiment, Nansen) reveal where big money is flowing, offering insight into potential price trends before they hit mainstream awareness.
5. The Psychological Secret: Fear and Greed Index
Crypto markets are driven more by emotion than fundamentals. The Fear and Greed Index, which tracks market sentiment, often predicts price movements better than technical indicators. Extreme fear signals potential buying opportunities, while extreme greed suggests a bubble.
Successful traders understand that patience and discipline are their greatest assets. They use emotional intelligence to avoid panic-selling during downturns or over-leveraging during bull runs. The secret lies in contrarian thinking — buying when others are fearful and selling when others are euphoric.
6. The Timing Secret: Market Cycles and Halving Events
Crypto markets move in predictable cycles, often tied to Bitcoin halving events (which occur approximately every four years). These events reduce the number of new Bitcoins entering circulation, historically triggering bull markets as scarcity increases.
Understanding the crypto cycle — accumulation, expansion, euphoria, and correction — gives traders an edge. The secret is to accumulate during bear markets when prices are undervalued and to take profits strategically during euphoric phases. Experienced investors don’t chase trends; they anticipate them through cycle analysis and macroeconomic awareness.
7. The DeFi Secret: Earning Passive Income
Decentralized Finance (DeFi) has unlocked a secret layer of wealth generation in crypto: passive income. Through staking, yield farming, and liquidity mining, investors can earn rewards without actively trading. For example, staking Ethereum 2.0 provides returns of 4–6% annually, while liquidity providers in decentralized exchanges like Uniswap or PancakeSwap earn transaction fees.
However, the secret to success in DeFi lies in risk management — avoiding projects with unaudited smart contracts or unsustainable yields. Genuine DeFi opportunities combine transparency, security, and innovation to create long-term income potential.
8. The Security Secret: Custody and Privacy
Many investors underestimate the importance of security. The crypto space is rife with hacks, phishing attacks, and rug pulls. The secret here is self-custody — storing crypto in hardware wallets (like Ledger or Trezor) instead of centralized exchanges.
Private key management is crucial. “Not your keys, not your coins” is a golden rule — meaning that if an exchange holds your keys, they control your assets. Using multi-signature wallets, two-factor authentication (2FA), and cold storage ensures protection against digital theft. Privacy coins like Monero and Zcash also provide enhanced confidentiality for transactions, appealing to users who value financial anonymity.
9. The Innovation Secret: Layer 2, Web3, and AI Integration
The next wave of crypto innovation revolves around scalability and interoperability. Layer 2 solutions such as Polygon, Arbitrum, and Optimism are solving Ethereum’s high gas fee and congestion issues. These projects are crucial to the long-term scalability of the blockchain ecosystem.
Simultaneously, the emergence of Web3 — the decentralized internet — is redefining data ownership and monetization. AI integration into blockchain is another secret growth area, where artificial intelligence can enhance smart contracts, fraud detection, and algorithmic trading. Investors who identify early-stage projects in these emerging sectors gain significant advantages.
10. The Regulatory Secret: Compliance Determines Longevity
While decentralization is a key appeal, regulation is the ultimate test for a cryptocurrency’s survival. Governments worldwide are developing frameworks for crypto taxation, anti-money laundering (AML), and investor protection. The secret here is that regulated compliance breeds legitimacy.
Projects that adapt to evolving laws — such as stablecoins backed by audited reserves or exchanges with proper licensing — tend to attract institutional investment. Understanding the regulatory landscape helps investors separate credible projects from high-risk ventures that might face legal challenges.
11. The Institutional Secret: Big Money Shapes the Market
Since 2020, major financial institutions have entered the crypto space, adding liquidity and credibility. Firms like BlackRock, Fidelity, and Grayscale have introduced Bitcoin ETFs and custody services. The secret is to watch institutional behavior — accumulation patterns, ETF flows, and custody adoption — as these signal market direction.
Institutional involvement also bridges the gap between traditional finance (TradFi) and decentralized finance (DeFi), paving the way for mass adoption. Investors who align with institutional trends rather than retail speculation often achieve more consistent returns.
12. The Education Secret: Knowledge Outperforms Hype
Ultimately, the greatest secret in crypto is education. Markets reward those who understand blockchain fundamentals, on-chain analytics, risk assessment, and macroeconomics. Many retail investors lose money due to lack of research and herd mentality.
Continuous learning — through whitepapers, developer updates, and reputable crypto analysts — is the real key to long-term success. The crypto world evolves rapidly, and only informed participants can adapt to its volatility and innovation.
Conclusion
Crypto assets are more than speculative digital tokens; they represent a paradigm shift in how the world perceives money, value, and trust. The “secrets” of crypto lie not in hidden tricks but in understanding its core principles — decentralization, scarcity, utility, and innovation. By mastering the fundamentals of blockchain technology, emotional discipline, market cycles, and security, investors can navigate this digital revolution wisely.
In essence, success in crypto isn’t about timing the market; it’s about understanding the market — its psychology, technology, and evolving potential. Those who embrace this knowledge stand to uncover not just financial rewards, but also a front-row seat to the future of global finance.
Volume Profile and Market Analysis1. Understanding Volume Profile
The Volume Profile is a histogram plotted on the price axis of a chart, showing the amount of traded volume at each price level during a specified period. Rather than displaying how much volume was traded per time unit (like a standard volume bar at the bottom of a chart), it shows where the majority of trading occurred within a price range.
This data allows traders to see which prices attracted the most attention from buyers and sellers, and which levels were quickly rejected. In essence, Volume Profile reveals the “market’s memory”—where the majority of market participants placed their bets.
2. Key Components of Volume Profile
To fully understand how to interpret Volume Profile, traders must become familiar with its key elements:
Point of Control (POC):
The price level with the highest traded volume during the selected period. It represents the fairest price—where buyers and sellers reached the greatest consensus.
Value Area (VA):
Typically, this covers about 70% of total traded volume and represents the range of prices considered “fair value” for the market. Prices outside this range are often seen as overbought or oversold.
Value Area High (VAH) and Value Area Low (VAL):
These boundaries mark the upper and lower limits of the Value Area. They act as important support and resistance levels.
High Volume Nodes (HVN):
Price zones where a large amount of trading occurred, indicating acceptance and stability. These levels often act as magnets for price.
Low Volume Nodes (LVN):
Price zones with very little trading activity, indicating rejection or imbalance. These often serve as breakout or reversal points.
3. Interpreting Volume Profile in Market Context
The market moves through cycles of accumulation, distribution, expansion, and contraction, and the Volume Profile helps visualize these phases:
Balanced Profile (D-shaped):
Indicates a period of consolidation where supply and demand are balanced. Price oscillates within a range around the POC, suggesting indecision. Breakouts from such zones often lead to strong directional moves.
Trending Profile (P-shaped or b-shaped):
A P-shaped profile shows a short-covering rally, where price moved upward and volume concentrated near the top of the profile. Conversely, a b-shaped profile indicates long liquidation—strong selling followed by stabilization at lower prices.
Double Distribution Profile:
This occurs when the market transitions between two value areas, indicating a shift in sentiment or a major fundamental change.
By reading these structures, traders can identify whether the market is in a state of balance (range-bound) or imbalance (trending), and adjust their strategies accordingly.
4. Volume Profile vs. Market Profile
Although they sound similar, Volume Profile and Market Profile are distinct:
Market Profile (developed by Peter Steidlmayer) organizes price and time data to show where the market spent the most time.
Volume Profile focuses purely on volume traded at each price level.
While Market Profile emphasizes time-based value areas, Volume Profile provides a clearer view of actual market participation, making it more precise for detecting liquidity zones and institutional activity.
5. Volume Profile in Different Market Types
a) In Forex Markets
Volume in spot forex is decentralized and not directly measurable like in stocks or futures. Traders often rely on tick volume as a proxy, using Volume Profile tools provided by brokers that aggregate order flow data. Volume analysis helps identify key price levels where large participants—such as banks or hedge funds—are active.
b) In Stock Markets
Volume Profile is particularly effective since exchanges record every share traded. Traders use it to find areas of institutional accumulation or distribution, often near earnings announcements, mergers, or economic reports.
c) In Futures and Commodities
Volume Profile is integral to futures trading because these markets are centralized. Traders often overlay Volume Profile with open interest and Cumulative Delta (buy vs. sell volume) to interpret real market intent.
6. Combining Volume Profile with Market Analysis
Volume Profile on its own is powerful, but when integrated into broader market analysis, it produces deeper insights.
a) Technical Analysis Integration
Support and Resistance:
VAH and VAL naturally act as strong support and resistance zones.
Breakouts:
Price breaking above VAH or below VAL with high volume often signals a continuation of the trend.
Trend Confirmation:
Aligning the slope of the profile with moving averages or trendlines helps confirm momentum.
b) Fundamental Analysis Connection
Fundamental events such as interest rate decisions, earnings reports, or geopolitical news can trigger high-volume shifts. By analyzing how the Volume Profile responds, traders can identify whether institutions are building or exiting positions in reaction to the news.
c) Sentiment and Order Flow
Volume Profile aligns naturally with order flow analysis—tracking buying and selling pressure at key price levels. Combining it with sentiment indicators (like COT reports or social sentiment data) helps validate whether retail traders or institutions dominate a move.
7. Institutional Trading and Volume Profile
Institutional players often execute trades at specific volume levels to mask their intentions. The Volume Profile reveals these footprints:
Accumulation Zones:
Large volumes at stable prices after a decline often indicate institutional buying.
Distribution Zones:
Heavy volume after an uptrend suggests institutions are offloading positions.
Liquidity Traps:
Price spikes into low-volume zones followed by rejections often represent false breakouts designed to trap retail traders.
By reading these patterns, retail traders can align with institutional behavior instead of being trapped by it.
8. Advantages of Volume Profile Analysis
Precision: Identifies key price levels where volume is concentrated.
Market Context: Reveals balance vs. imbalance zones.
Institutional Insight: Shows where large traders are active.
Support/Resistance Accuracy: More reliable than indicators based on time.
Adaptability: Works across all asset classes and timeframes.
9. Limitations of Volume Profile
Lagging Nature: It shows historical participation, not future intent.
Data Dependency: Requires accurate tick or trade data; less reliable in decentralized markets like spot forex.
Complex Interpretation: Needs context—volume alone can mislead without price action or trend confirmation.
Short-Term Noise: Small timeframes may show excessive detail that obscures meaningful levels.
10. Practical Application in Trading
A practical Volume Profile-based strategy might look like this:
Identify Balance Area: Observe where the majority of volume has occurred over recent sessions.
Mark VAH, VAL, and POC: These become your reference levels.
Wait for Imbalance: Watch for price breaking out of the value area with high volume.
Confirm with Price Action: Look for retests of VAH/VAL or the POC for potential entries.
Manage Risk: Use low-volume nodes or opposite side of the value area as stop-loss levels.
This method aligns trading decisions with institutional activity and real market structure rather than arbitrary indicators.
11. The Future of Volume and Market Analysis
As financial markets become increasingly algorithm-driven, volume-based analytics are evolving through machine learning, order book heatmaps, and real-time flow data visualization. These tools allow traders to not only see where the market has traded, but where orders are currently resting—providing predictive insight into potential price reactions.
Volume Profile remains the backbone of this new generation of trading tools, bridging the gap between traditional chart reading and data-driven market intelligence.
Conclusion
Volume Profile is more than a charting tool—it’s a framework for understanding the psychology of the market. By showing how volume is distributed across price levels, it uncovers the footprints of professional traders and institutions. When combined with technical, fundamental, and sentiment analysis, it allows traders to operate with greater precision, confidence, and understanding of market structure.
In a world of fast-moving markets and complex algorithms, mastering Volume Profile and integrating it into comprehensive market analysis is an essential skill for any serious trader seeking an edge in today’s global financial landscape.
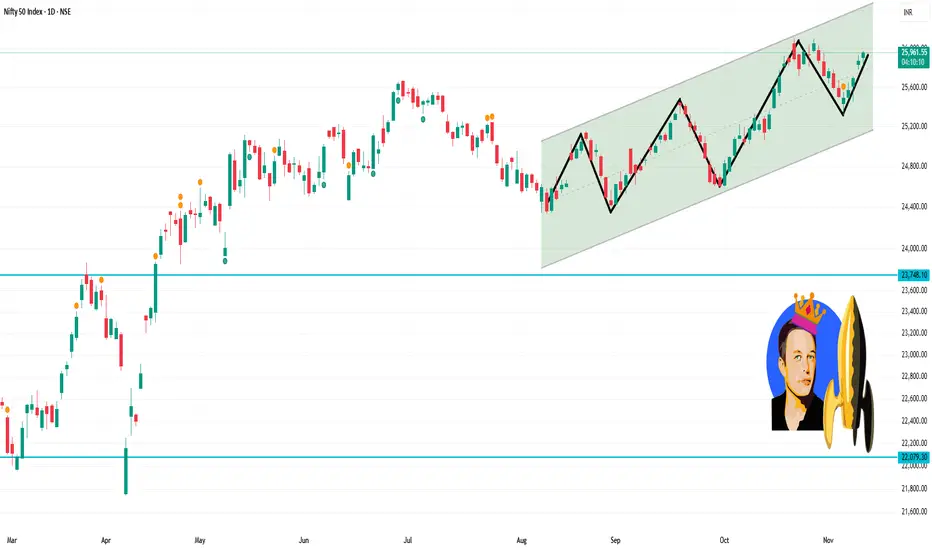
Nifty 50 1 Day Time Frame Current level: ≈ 25,876 INR.
Key resistance zone: ~26,000-26,100 INR.
Immediate support zone: ~25,500-25,600 INR.
📊 Key levels to watch today
Resistance (near-term): ~ 26,000-26,100 – a decisive breakout above this could open further upside.
Support (near-term): ~ 25,500-25,600 – if price falls below this, the structure could weaken.
Intermediate support: ~ 25,300-25,400 as a lower boundary in case of deeper pull-back.
Candle Patterns Understanding the Basics of a Candlestick
Each candlestick represents the price movement of an asset within a specific time period — it could be one minute, one hour, one day, or even one week.
A candlestick consists of four main components:
Open – the price at which the asset started trading for the period.
Close – the price at which the asset finished trading for that period.
High – the highest price reached during the period.
Low – the lowest price reached during the period.
The body (the thick part of the candle) shows the range between the open and close prices.
If the close is higher than the open, the candle is bullish (usually green or white).
If the close is lower than the open, it’s bearish (usually red or black).
The thin lines above and below the body are called wicks or shadows, showing the highest and lowest traded prices.

Real Knowledge Premium Charts 🔶 What Are Premium Chart Patterns?
Premium chart patterns are advanced price structures that go beyond basic formations like triangles or flags. They reveal institutional activity, market psychology, and volume–price alignment.
These patterns often indicate major breakouts, reversals, or continuation trends — giving traders an edge when combined with volume profile, market structure, and confirmation indicators.

PCR-Based Trading StrategiesFactors Affecting Option Prices
Option prices (or premiums) are influenced by several variables, collectively known as the Option Greeks:
Delta: Measures how much the option price changes for a ₹1 move in the underlying asset.
Gamma: Measures how much Delta changes with each ₹1 move in the underlying.
Theta: Measures time decay — how much the option loses value as expiry approaches.
Vega: Measures sensitivity to volatility — higher volatility increases option prices.
Rho: Measures sensitivity to interest rates (less relevant for short-term trades).
Among these, Theta (time decay) and Vega (volatility) play a major role in intraday and short-term trading.

Divergence Explained with ClarityOption Trading in India: Settlement and Expiry
In India, options are European-style, meaning they can only be exercised on the expiry date (unlike American options, which can be exercised anytime).
Most traders don’t hold options till expiry — they square off (buy or sell back) before expiry to realize profits or cut losses.
Expiry cycles:
Index Options (like NIFTY/BANK NIFTY): Weekly and Monthly expiries.
Stock Options: Monthly expiries only.
The settlement happens in cash; there’s no physical delivery for index options, while stock options can have physical settlement at expiry.

Part 1 How to Draw Accurate Support and Resistance LevelsThe Key Components of an Option Contract
Underlying Asset:
The financial instrument (e.g., stock or index) on which the option is based.
Strike Price:
The price at which the holder of the option can buy (for calls) or sell (for puts) the underlying asset.
Expiry Date:
The date on which the option contract expires. In India, options can be weekly or monthly.
Premium:
The price the buyer pays to purchase the option contract from the seller (also known as the writer). This premium is non-refundable.
Lot Size:
Each option contract represents a fixed quantity of the underlying. For example, one NIFTY option lot equals 50 units, while one BANK NIFTY option equals 15 units.

Part 2 Understanding the Master Candle ConceptWhat Are Options?
Options are derivative instruments, meaning their value is derived from an underlying asset. The underlying asset can be a stock, index, commodity, or currency.
There are two types of options:
Call Option:
Gives the buyer the right to buy the underlying asset at a specific price (called the strike price) before the expiry date.
Put Option:
Gives the buyer the right to sell the underlying asset at a specific price before the expiry date.
For example:
If you buy a NIFTY 50 call option at a strike price of 22,000, you are betting that the NIFTY will rise above 22,000 before expiry. If it does, your call option increases in value.
If you buy a NIFTY put option at 22,000, you’re betting the index will fall below 22,000 — and the value of your put option will rise as the index drops.

BAJFINANCE 1 Day time frame 🔍 Current Price Snapshot
Last quoted price: ₹1,012.30 (approx) on 12 Nov 2025.
Today’s intraday range: roughly ₹1,008.80 (low) to ₹1,017.70 (high).
52-week range: ~ ₹645.10 (low) to ~ ₹1,102.50 (high).
📌 Key Levels to Watch (1-day timeframe)
Resistance zone: Around ~ ₹1,100-₹1,105, near the 52-week high of ~ ₹1,102.50.
Support zone: Around ~ ₹1,000-₹1,020 — the current price area, with possible support below near ~ ₹990-₹1,000 if the price drifts downward.
If the stock breaks above ~ ₹1,100 with momentum, it may try to test higher levels. If it breaks down below ~ ₹1,000, watch for potential drop to next support zones (which could be ~ ₹950 or lower) though one would need to check historical intraday charts for those.

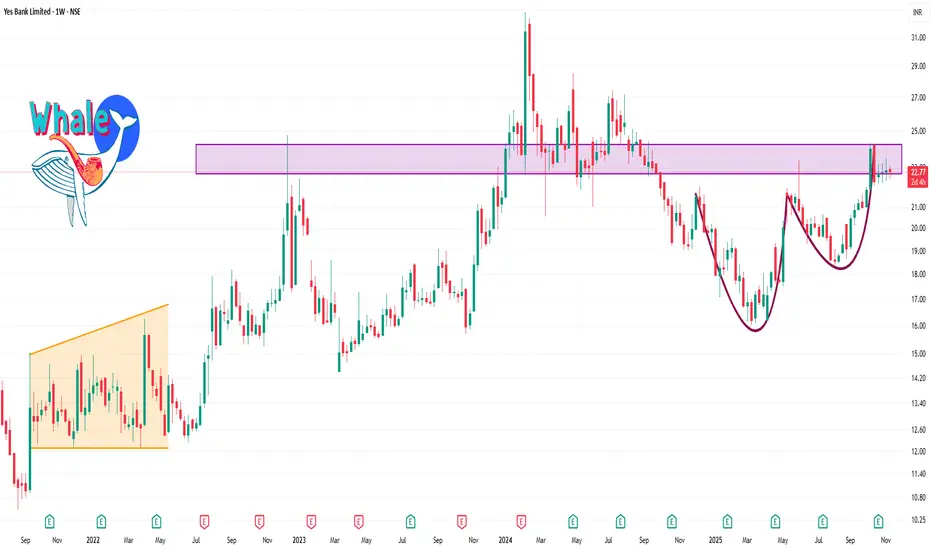
YESBANK 1 Week TIme Frame 📊 Key Technical Levels
Current price: ~ ₹22.70 (approx) per share.
52-week range: Low ~ ₹16.02, High ~ ₹24.30.
Recent support zone: around ₹22.00–₹22.50 appears to be a floor (given recent trades near ₹22.70)
Immediate resistance: near the recent highs ~ ₹24.00-₹24.30
If the price falls, next support might be around ₹20.50–₹21.00, given the lower circuit band was ~ ₹20.36.
✅ Short-term trading scenario
Bullish scenario: Enter (or hold) around ₹22.70 if momentum is positive and target ~₹25 with a stop-loss around ₹21.50.
Bearish scenario: If it breaks down below ~₹22.00 decisively, look for stop-loss trigger and potential target ~₹20.50 or lower.
Risk management is key: Because the price is relatively low and volatility can be higher, ensure stop-loss and position sizing are in line with your risk tolerance.
TCS 1 Month Time Frame 📊 1-Month Price Overview
On ~12 Nov 2025, TCS was trading at around ₹3,116.
Over the past month, highs in the ~₹3,120 range and lows around ~₹2,943.10 were observed.
The 1-month return is modest: about +2.9% according to one source.
Volatility: According to sector data, the beta over the last month is very low (~0.04) – indicating relatively low sensitivity in that timeframe.
✅ Key Levels
Support zone: ~₹2,940 to ~₹2,970 looks like a recent low range where the stock found some footing.
Resistance zone: ~₹3,090 to ~₹3,120 is a range where the stock has struggled to significantly break above in the past few weeks.
If those break:
A break above ~₹3,120 with conviction could open up upward move potential.
A break below ~₹2,940 may signal more downside risk in the near term.

TRENT 1 Day Time Frame 🎯 Key Current Levels
Last close (approx): ₹4,375.
Recent intraday traded range: High around ~₹4,396, Low around ~₹4,295.
52-week low: ~₹4,262.60; 52-week high: ~₹7,493.05.
✅ What to Watch During the Day
If price drops and holds above support ~₹4,260-4,220, it may bounce back — this is a potential intraday buyable support region (if other conditions align).
If price breaks below ~₹4,220 decisively (= strong volume, no immediate bounce), next support ~₹4,160 could come into play.
For upside: If price moves up and clears resistance around ~₹4,416-4,468 with good volume, it might test the nearer moving averages (~₹4,663) but that’s a larger move.
Be mindful of stock being in a weaker trend (below key moving averages) and recent earnings/growth concerns (which may limit upside) — fundamental headwinds matter too.
