Biggest Mistakes New Traders Make (A Detailed Guide)1. Trading Without Proper Education
One of the biggest mistakes new traders make is jumping into live markets without learning the basics. Many start trading after watching a few YouTube videos or copying trades from Telegram or WhatsApp groups. They don’t understand market structure, risk management, or how price actually moves.
Trading is a skill, not a shortcut to fast money. Without understanding concepts like support and resistance, trends, volatility, position sizing, and psychology, traders are essentially gambling. Education doesn’t guarantee success, but lack of education almost guarantees failure.
2. Unrealistic Profit Expectations
New traders often expect to double their money in weeks or become full-time traders within months. Social media plays a major role in creating these illusions by showcasing only winning trades and luxury lifestyles.
In reality, consistent trading success takes years. Professional traders focus on process, not daily profits. Unrealistic expectations push beginners to overtrade, use excessive leverage, and take unnecessary risks—all of which lead to rapid losses.
3. Poor Risk Management
This is the number one reason traders blow up their accounts.
New traders often risk too much on a single trade, sometimes 10–50% of their capital. They believe one good trade will “change everything.” When the market moves against them, the damage becomes irreversible.
Successful traders focus on capital protection first. They typically risk only 1–2% per trade. Without risk management, even a good strategy will fail. You can be right 60% of the time and still lose money if your losses are uncontrolled.
4. Not Using Stop Losses Properly
Many beginners either don’t use stop losses at all or move them emotionally. When a trade goes against them, they hope the price will come back. Hope is not a trading strategy.
Markets don’t care about your entry price. A stop loss is a tool to protect your capital and your psychology. Avoiding stop losses leads to large, unexpected losses that wipe out weeks or months of gains.
5. Emotional Trading (Fear and Greed)
New traders are highly emotional. Fear makes them exit winning trades too early. Greed makes them hold losing trades too long. After a loss, revenge trading kicks in—placing impulsive trades to recover money quickly.
Emotions cloud judgment. Professional traders accept losses as part of the business. Beginners take losses personally, which leads to impulsive decisions. Mastering emotions is more important than mastering indicators.
6. Overtrading
Overtrading happens when traders take too many trades without valid setups. Beginners feel they must be in the market all the time. If the market is open, they feel obligated to trade.
This behavior increases transaction costs, mental fatigue, and mistakes. Quality matters far more than quantity. Some of the best traders take only a few high-probability trades per week.
7. Strategy Hopping
New traders constantly switch strategies. One week it’s price action, next week indicators, then options scalping, then crypto futures. After a few losses, they abandon the strategy and look for a “better one.”
Every strategy has losing streaks. Without consistency, traders never master anything. Success comes from executing one well-defined strategy over hundreds of trades, not from constantly chasing the next shiny method.
8. Ignoring Trading Psychology
Many beginners focus only on technical analysis and ignore psychology. They believe indicators will solve everything. But trading is a mental game.
Discipline, patience, confidence, and emotional control matter more than entry techniques. Without psychological stability, even the best strategy will fail under pressure. Traders must learn to follow rules even when emotions are high.
9. No Trading Plan
Trading without a plan is like driving without a destination. New traders often enter trades randomly without knowing:
Why they entered
Where they will exit if wrong
Where they will take profit
How much they are risking
A trading plan creates structure and accountability. Without it, decisions become emotional and inconsistent, leading to unpredictable results.
10. Blindly Following Tips and Signals
Many beginners rely on tips, paid signals, or social media “experts.” They don’t know why a trade is taken or how risk is managed. When trades fail, they blame others instead of improving their own skills.
Signals create dependency. Real traders build independence. Learning how to analyze and execute trades yourself is essential for long-term success.
11. Overusing Indicators
New traders often clutter charts with too many indicators. This creates confusion and conflicting signals. More indicators do not mean better analysis.
Price itself is the most important indicator. Indicators should support decisions, not replace thinking. Simplicity improves clarity and execution.
12. Not Keeping a Trading Journal
Most beginners don’t track their trades. Without a journal, they repeat the same mistakes again and again without realizing it.
A trading journal helps identify strengths, weaknesses, emotional patterns, and strategy flaws. Growth is impossible without self-review.
13. Trading With Money They Can’t Afford to Lose
Trading with borrowed money or essential savings adds extreme emotional pressure. Fear of loss leads to poor decisions and panic exits.
Only risk capital you can emotionally and financially afford to lose. Peace of mind is a hidden edge in trading.
Conclusion
New traders don’t fail because markets are impossible. They fail because they underestimate the complexity of trading and overestimate their readiness. The biggest mistakes—poor risk management, emotional trading, lack of discipline, and unrealistic expectations—are completely avoidable.
Trading is a marathon, not a sprint. Success comes from patience, continuous learning, self-awareness, and strict risk control. If new traders focus on survival first and profits second, they give themselves a real chance to succeed in the long run.
Trendcontinuationpatterns
Risk Management & Position Sizing in Trading1. Introduction
Risk management and position sizing are the foundation of long-term trading success. Many traders focus heavily on entry strategies—chart patterns, indicators, or news—but ignore risk. In reality, you can be profitable even with an average strategy if your risk management is strong, and you can lose everything with a great strategy if risk is uncontrolled.
Risk management answers one key question:
“How much am I willing to lose if this trade fails?”
Position sizing answers another:
“How many shares/lots should I trade based on that risk?”
Together, they protect your capital, control emotional stress, and allow you to survive long enough to benefit from market opportunities.
2. Understanding Risk in Trading
In trading, risk is the potential loss on a trade, not uncertainty. Every trade has three known variables:
Entry Price
Stop Loss
Position Size
Risk exists because the market can move against you. Professional traders accept losses as business expenses, not failures. The goal is not to avoid losses, but to keep losses small and controlled.
3. The Golden Rule: Capital Preservation
The first objective of trading is not to make money—it is to protect capital. Without capital, you cannot trade.
Key principles:
Never risk a large portion of capital on one trade
Avoid revenge trading after losses
Focus on consistency, not jackpots
A trader who protects capital gains a powerful advantage: the ability to stay in the game.
4. Fixed Percentage Risk Model
One of the most widely used risk management methods is the Fixed Percentage Risk Model.
How it Works:
You risk a fixed percentage of your total capital on each trade—usually 0.5% to 2%.
Example:
Trading Capital: ₹5,00,000
Risk per Trade: 1%
Maximum Loss Allowed per Trade: ₹5,000
No matter how confident you are, you never exceed this limit.
This method:
Prevents large drawdowns
Automatically reduces risk after losses
Allows compounding after profits
5. Position Sizing: The Core of Risk Control
Position sizing converts your risk limit into trade quantity.
Position Size Formula:
Position Size = (Capital × Risk %) ÷ (Entry Price – Stop Loss)
Example:
Capital: ₹5,00,000
Risk per trade: 1% = ₹5,000
Entry Price: ₹500
Stop Loss: ₹490
Risk per share: ₹10
Position Size = 5,000 ÷ 10 = 500 shares
This ensures:
Loss stays within ₹5,000
Emotions remain controlled
Decisions stay objective
6. Stop Loss: The Backbone of Risk Management
A stop loss defines where you admit you are wrong.
Types of Stop Loss:
Technical Stop: Based on support, resistance, trendline, or indicator
Percentage Stop: Fixed % from entry
Volatility Stop: Based on ATR
Time-Based Stop: Exit if trade doesn’t move in expected time
A stop loss must be:
Logical, not emotional
Decided before entering the trade
Never widened to avoid loss
7. Risk–Reward Ratio (RRR)
Risk management is incomplete without understanding reward potential.
Risk–Reward Ratio:
Risk : Reward = Stop Loss : Target
Common professional standards:
Minimum 1:2
Ideal 1:3 or higher
Example:
Risk per trade: ₹5,000
Target: ₹10,000 to ₹15,000
Even with a 40% win rate, a good RRR keeps you profitable.
8. Maximum Drawdown Control
Drawdown is the decline from peak capital.
Rules professionals follow:
Stop trading if drawdown reaches 10–15%
Reduce position size after consecutive losses
Never try to “recover quickly”
Survival during drawdowns is what separates amateurs from professionals.
9. Position Sizing in Different Markets
Intraday Trading:
Lower risk per trade (0.25%–0.5%)
Tight stop losses
Smaller targets
Positional Trading:
Risk per trade: 1%–2%
Wider stop losses
Fewer trades
F&O Trading:
Use defined-risk strategies
Avoid over-leveraging
Lot size must fit risk, not margin
10. Psychological Benefits of Proper Risk Management
Good risk management:
Reduces fear and greed
Prevents overtrading
Builds confidence
Makes results predictable
When you know the maximum possible loss, your mind stays calm and focused.
11. Common Risk Management Mistakes
Risking more after losses
Increasing position size emotionally
Trading without stop loss
Over-leveraging in options
Ignoring drawdown rules
One big loss can destroy months of discipline.
12. Professional Risk Management Rules
Risk small, trade consistently
Never risk more than you can afford to lose
Protect capital first, profits second
Think in series of trades, not single outcomes
Let probability work over time
13. Conclusion
Risk management and position sizing are not optional tools—they are the trading system itself. Entries and indicators only decide where you trade, but risk management decides whether you survive and grow.
The market rewards discipline, patience, and consistency—not aggression. Traders who master risk management stop chasing money and start building a professional trading business.
If you control risk, profits become a byproduct.
DATAPATTNS 1 Week time Frame 📌 Current Price Snapshot (Live / Latest Data)
Data Patterns (India) Ltd price (approx): ~ ₹2,592 — ₹2,620 per share (NSE) based on latest trading session updates.
52‑Week Range:
• High: ₹3,268.80
• Low: ₹1,351.15
📈 Weekly Pivot & Levels (classic method)
Level Price (Approx)
Weekly Pivot (central) ₹2,943.7
Weekly R1 ₹3,277.0
Weekly R2 ₹3,453.4
Weekly R3 ₹3,786.7
Weekly S1 ₹2,767.3
Weekly S2 ₹2,433.9
Weekly S3 ₹2,257.6
🔁 Weekly Fibonacci Pivot Levels (Alternate)
Level Price (Approx)
Weekly Pivot (Fibo) ₹2,943.7
R1 (Fib) ₹3,138.4
R2 (Fib) ₹3,258.7
R3 (Fib) ₹3,453.4
S1 (Fib) ₹2,748.9
S2 (Fib) ₹2,628.7
S3 (Fib) ₹2,433.9
📌 Quick Weekly Levels Summary
Current level (approx): ₹2,592 – ₹2,620
Weekly Pivot: ~₹2,943
Weekly Resistance 1: ~₹3,277
Weekly Resistance 2: ~₹3,453
Weekly Support 1: ~₹2,767
Weekly Support 2: ~₹2,433
Weekly Support 3: ~₹2,258

Part 1 Support and Resistance Introduction to Option Trading
Option trading is a part of the derivatives market where traders buy and sell contracts whose value is derived from an underlying asset like Nifty, BankNifty, stocks, FINNIFTY, SENSEX, commodities, currency, etc.
Unlike equity trading, where you buy shares directly, in options you buy rights (not obligations) to buy or sell the underlying asset at a fixed price.
This fixed price is called the Strike Price.
The unique thing about option trading is that your risk can be limited while your profit potential can be unlimited, especially when buying options.
Options are used by retail traders, big institutions, hedge funds, FIIs, HNIs, and even companies to hedge and speculate.
The attractive part of option trading is the leverage—small premium can control large value of underlying.
But leverage is a double-edged sword; wrong decisions can result in rapid premium decay.
Options can be traded in two ways: buying options or selling/writing options.
Option trading involves understanding price action, sentiment, volatility, open interest, volume, structure, and momentum.
It is one of the most powerful instruments for intraday, swing, positional, and hedged strategies.

Renewable Energy Certificates & Carbon Credits1. What Are Renewable Energy Certificates (RECs)?
Definition
A Renewable Energy Certificate (REC) represents the environmental attributes of electricity generated from renewable sources such as solar, wind, hydro, biomass, or geothermal. One REC is issued for every 1 megawatt-hour (MWh) of renewable electricity generated and supplied to the grid.
When renewable power is produced, two components are created:
Physical electricity (indistinguishable once on the grid)
Environmental benefit (tracked separately through RECs)
The REC allows the renewable benefit to be claimed, traded, or retired, even if the actual electricity is consumed elsewhere.
2. Purpose of RECs
RECs exist primarily to:
Promote renewable energy adoption
Enable compliance with renewable energy mandates
Allow organizations to claim renewable energy usage
Support corporate sustainability and ESG goals
Because electricity on the grid is a mix of sources, RECs solve the attribution problem—allowing buyers to say, “We used renewable electricity,” even if electrons came from mixed sources.
3. Types of REC Markets
a) Compliance RECs
These are used to meet government-mandated renewable obligations, such as:
Renewable Purchase Obligations (RPOs) in India
Renewable Portfolio Standards (RPS) in the US
Utilities and obligated entities must procure a certain percentage of power from renewable sources or purchase RECs to comply.
b) Voluntary RECs
Corporates, institutions, and individuals purchase these to:
Reduce their carbon footprint
Meet net-zero or carbon neutrality commitments
Enhance brand sustainability credentials
4. How REC Markets Work
Renewable generator produces electricity
REC is issued by a registry
REC is sold to buyers
Buyer retires the REC to claim renewable usage
Once retired, a REC cannot be resold, ensuring no double counting.
5. Benefits and Limitations of RECs
Benefits
Encourages renewable project viability
Provides additional revenue to clean energy producers
Enables corporate climate action
Transparent and standardized tracking
Limitations
RECs do not directly reduce emissions; they support cleaner generation
Risk of greenwashing if used without broader decarbonization
Impact depends on market integrity and additionality
6. What Are Carbon Credits?
Definition
A carbon credit represents the reduction, removal, or avoidance of 1 metric tonne of carbon dioxide (CO₂) or equivalent greenhouse gases (CO₂e).
Carbon credits are generated by projects that:
Reduce emissions (e.g., energy efficiency)
Avoid emissions (e.g., clean cooking stoves)
Remove carbon (e.g., afforestation, carbon capture)
7. Purpose of Carbon Credits
Carbon credits exist to:
Put a price on carbon emissions
Encourage emission reductions where they are cheapest
Help entities offset unavoidable emissions
Support climate finance in developing regions
They are especially useful for hard-to-abate sectors like aviation, cement, steel, and shipping.
8. Types of Carbon Markets
a) Compliance Carbon Markets
Governed by regulations such as:
Emissions Trading Systems (ETS)
Cap-and-Trade programs
Governments cap total emissions and allocate or auction allowances. Companies exceeding limits must buy credits.
b) Voluntary Carbon Markets (VCM)
Corporations and individuals voluntarily purchase credits to:
Offset emissions
Achieve carbon neutrality
Support sustainability initiatives
Credits are certified by standards like Verra, Gold Standard, or national registries.
9. How Carbon Credits Are Created
Project is designed (e.g., wind farm, forest conservation)
Emission reductions are calculated using approved methodologies
Independent verification is conducted
Credits are issued
Credits are sold and eventually retired
Key principles include additionality, permanence, measurability, and no double counting.
10. Benefits and Challenges of Carbon Credits
Benefits
Cost-effective emission reductions
Mobilizes private climate finance
Encourages innovation and clean technologies
Supports sustainable development goals (SDGs)
Challenges
Concerns about quality and credibility
Risk of overstated reductions
Permanence risks (e.g., forest fires)
Complexity in measurement and verification
11. Key Differences Between RECs and Carbon Credits
Aspect RECs Carbon Credits
Unit 1 MWh renewable electricity 1 tonne CO₂e
Purpose Promote renewable energy Offset or reduce emissions
Market Electricity & sustainability Climate & emissions
Emission Impact Indirect Direct
Usage Claim “We used renewable energy” “We offset emissions”
12. Role in Corporate ESG and Net-Zero Strategies
Modern climate strategies typically follow a hierarchy:
Avoid emissions
Reduce emissions
Replace fossil energy with renewables (RECs)
Offset residual emissions (Carbon Credits)
RECs help decarbonize Scope 2 emissions (electricity), while carbon credits often address Scope 1 and Scope 3 residuals.
13. Future Outlook
The role of RECs and carbon credits is expanding due to:
Global net-zero commitments
Increasing carbon disclosure regulations
Growth in ESG investing
Rising corporate accountability
However, future markets will demand:
Higher transparency
Stronger standards
Better alignment with real-world emission reductions
Governments are also exploring Article 6 mechanisms under the Paris Agreement, which could reshape international carbon trading.
14. Conclusion
Renewable Energy Certificates and Carbon Credits are powerful yet distinct climate instruments. RECs accelerate the transition to clean electricity by monetizing renewable attributes, while carbon credits enable emissions reductions beyond organizational boundaries. When used responsibly—not as substitutes for direct decarbonization but as complementary tools—they play a crucial role in achieving global climate goals.

Fastest-growing sectors in 2026: Renewables, EV, Tech, Infra1. Renewables: Powering the Energy Transition
Global Growth & Investment
Renewable energy — including solar, wind, hydro, bioenergy, and emerging technologies such as green hydrogen and energy storage — is one of the fastest-growing sectors worldwide. Governments, investors, and corporations are pouring capital into clean energy to decarbonize economies, meet climate targets, and reduce reliance on fossil fuels. According to international forecasts, renewables are projected to increase their share of global energy consumption significantly by 2030, with renewable electricity expanding rapidly in the industry, transport, and buildings sectors.
Key Drivers
Climate Commitments & Policy Incentives – Governments across Europe, Asia, and the Americas are implementing policies that subsidize renewable projects, penalize carbon emissions, and set net-zero targets. For example, India’s push for 500 GW of renewable capacity by 2030 is driving solar and wind expansion alongside storage solutions.
Cost Reductions – Technological improvements have dramatically lowered the cost of solar panels and wind turbines, making renewables competitive with conventional energy.
Integration with Storage & Smart Grids – Growth in advanced energy storage technologies (including battery systems) and smart grid integration is solving the intermittency problem — a major historical barrier to renewables.
Emerging Trends
Solar innovation — new technologies like perovskite solar cells and floating solar farms are expanding opportunities.
Offshore wind growth — deeper water installations and floating turbines are enabling significant offshore capacity.
Green hydrogen scaling — as electrolyzer costs fall, hydrogen is gaining traction for heavy industry decarbonization.
Corporate demand — companies are committing to renewable power as part of ESG and net-zero strategies.
Economic Impact
Renewables are a major job creator and investment destination. For example, installation, manufacturing, and maintenance roles in solar and wind are among the fastest-growing occupations globally. With investments exceeding traditional fossil fuel project financing in some markets, renewables are reshaping how energy systems are built and financed.
2. Electric Vehicles (EVs): Redefining Transportation
Market Expansion
The electric mobility market continues its rapid global expansion. Electric vehicle sales — including passenger cars, trucks, buses, and two-wheelers — are accelerating due to stronger emissions regulations, consumer demand, and falling battery costs. One estimate suggests the global EV fleet could reach roughly 116 million vehicles in 2026, up about 30 % from the previous year.
Growth Drivers
Emissions Regulations – Many regions are phasing out internal combustion engine vehicles, pushing manufacturers and consumers toward EVs.
Battery Technology & Cost Declines – As battery performance improves and prices drop, EVs become more affordable and attractive to a broader consumer base.
Charging Infrastructure Expansion – Investment in EV charging networks — including fast chargers and grid-connected systems — is enabling longer trips and better usability.
Integration with Renewables
A key growth area is the integration of EVs with renewable energy systems. Solar-powered charging points and vehicle-to-grid (V2G) technologies help EVs not only use clean energy but also stabilize the grid by providing stored electricity when needed.
Sector Challenges & Opportunities
Charging infrastructure gap — expansion still needs to catch up with adoption.
Battery recycling and sustainability — as EV deployment scales, end-of-life battery recycling will become vital.
Despite challenges, EVs are a centerpiece of electrified transport and decarbonization strategies globally, with significant implications for energy demand patterns, oil markets, and automotive industry structures.
3. Technology: The Digital Acceleration
Redefining Industries
Technology — particularly artificial intelligence (AI), cloud computing, cybersecurity, data centers, and digital services — is expanding rapidly as organizations across sectors invest heavily in digital transformation.
AI & Machine Learning
AI is no longer just a tool — it’s becoming a core infrastructure component for enterprise and industrial systems. From autonomous energy grid management to predictive maintenance and business analytics, AI adoption is growing fast. AI systems are optimizing energy distribution, managing EV charging demand, and enhancing industrial productivity.
Cloud & Data Centers
Cloud computing and data center infrastructure remain vital as demand for digital services — including streaming, remote work, big data, and AI training — grows. Forecasts indicate that cloud infrastructure revenue will exceed hundreds of billions of dollars in 2026, with data centers expanding capacity globally.
Cybersecurity & Digital Services
With digital expansion comes higher cybersecurity needs. Investments in digital defenses, secure cloud platforms, and compliance solutions are booming as businesses safeguard data and ensure continuity.
Emerging Tech Sub-sectors
Edge computing — for low-latency processing in IoT and industrial use cases.
Generative AI and automation tools — reshaping workflows across industries.
Quantum computing and next-gen semiconductors — these are nascent yet rapidly emerging areas.
The tech sector’s evolution is foundational to every other growth theme — from enabling smart energy grids to powering autonomous vehicles and delivering digital public services.
4. Infrastructure: Building the Backbone of Growth
Why Infrastructure Matters
Infrastructure — including energy systems, transport networks, digital networks, and urban development — is central to sustained economic growth. By 2026, infrastructure investment is one of the fastest-growing areas because it supports all the other sectors (renewables, EVs, tech).
Key Infrastructure Drivers
Energy Systems Modernization – To support renewable energy growth and EV charging, grid modernization and energy storage infrastructure are critical. Projects include upgraded transmission lines, substation automation, and decentralized power networks.
Transport & Mobility Networks – Beyond EV adoption, there’s demand for integrated transport infrastructure including smart highways, electrified public transit, and urban mobility solutions.
Digital Infrastructure Expansion – With cloud services and digital adoption rising, infrastructure for broadband, fiber optic networks, 5G/6G, and data centers is expanding rapidly.
Sector Trends
Clean Energy Infrastructure — integrating renewables, storage and EV charging to support resilient and sustainable grids.
Smart Cities & Urban Systems — digital and sensor networks to optimize traffic, utilities, and public services.
Public-Private Partnerships (PPPs) — governments are increasingly partnering with private investors to finance large infrastructure projects.
Economic Impact
Infrastructure spending stimulates economic activity through job creation, supply chain demand, and enhanced productivity. Upgrading infrastructure is directly linked to long-term competitiveness, economic resilience, and quality of life improvements.
How These Sectors Interact
These four sectors — Renewables, EVs, Technology, and Infrastructure — are deeply interconnected:
Renewables and EVs both depend on grid upgrades, storage systems, and digital control systems.
Technology (especially AI, cloud, and digital services) enables smarter energy grids, efficient logistics, and responsive urban systems.
Infrastructure investment is the foundation that makes large-scale transitions feasible — from renewable generation to electrified mobility and digital economies.
This synergy creates a multiplier effect for economic growth: advancements in one sector accelerate progress in the others, leading to broader innovation and productivity gains.
What This Means for 2026 and Beyond
Investment Opportunities – These sectors are attracting capital from sovereign wealth funds, institutional investors, and venture capital, reflecting confidence in long-term growth.
Jobs & Skills Transformation – Employment will rise in clean energy, software engineering, EV manufacturing, AI development, infrastructure planning, and data management.
Policy Focus – Governments are enacting supportive regulations, subsidies, and targets to accelerate adoption and market formation.
Global Competitiveness – Countries leading in these sectors stand to benefit from economic growth, technological leadership, and improved energy security — shaping the next era of global economic power.
Conclusion
In 2026, the expansion of renewables, electric vehicles, technology, and infrastructure is not just a trend — it’s a structural shift in the global economy. Driven by sustainability goals, technological advancement, and changing consumer and business behaviors, these sectors offer significant opportunities for growth, investment, employment, and innovation.
Together, they represent the backbone of a future-ready economy — one that is cleaner, more connected, and more resilient.
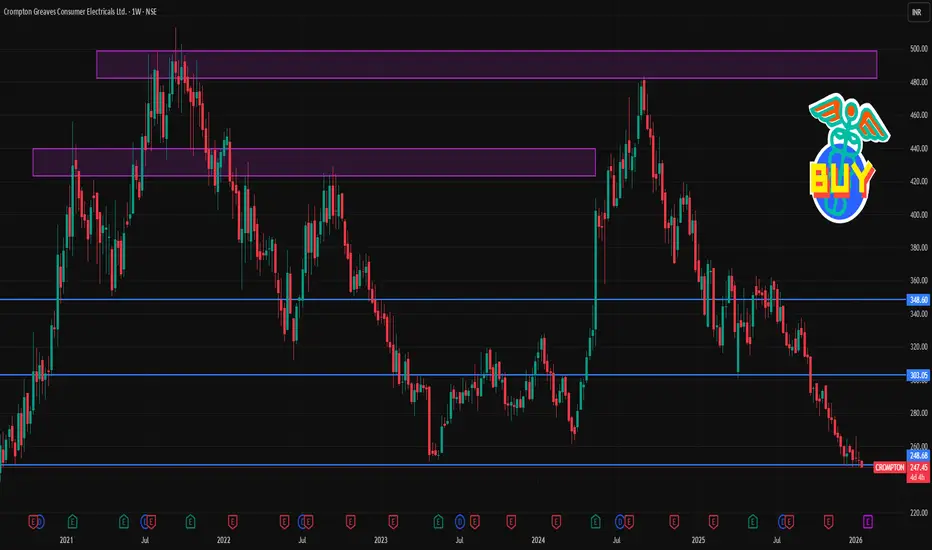
CROMPTON 1 Week Timw Frame 📊 Current Price Snapshot (Recent Close)
📌 Last traded price: ~₹251–₹255 range (as per latest market data).
📈 Key 1‑Week Technical Levels (Support & Resistance)
🔻 Support Levels — Where Buyers May Step In
Immediate support: ~₹248–₹252 (current level area)
Secondary support: ~₹245–₹247 (short‑term downside buffer)
Lower support: ~₹241–₹242 (deeper short‑term demand zone)
➡️ If price stays above ~₹248, short‑term weakness may stabilize.
🔺 Resistance Levels — Where Selling Might Appear
R1 (first resistance): ~₹255–₹256 (near immediate intraday hurdle)
R2 (next resistance): ~₹259–₹260 (near short‑term pivot barrier)
R3 (higher resistance): ~₹262–₹263 (short‑term rally target on strength)
➡️ A breakout above ~₹259–₹260 with volume could signal a short‑term bounce.
📅 1‑Week Scenario Outlook
➡️ Bearish scenario (higher probability given current momentum):
Price remains below ₹259–₹260 resistance → likely to trade lower toward ₹245 and possibly at ₹241–₹242 zone.
➡️ Bullish reversal setup (requires catalyst):
Price breaks and sustains above ₹259–₹260 with decent volume → could see rally toward ₹262+ within week.
⚠️ Important Notes
This is a technical perspective only (not investment advice).
Price movements can change rapidly with market news, volumes, and macro catalysts.
Use stop‑loss and risk management if planning any trades.
Algorithmic AI Trading Strategies: Transforming Modern Markets1. Meaning of Algorithmic AI Trading
Algorithmic AI trading refers to the use of computer programs powered by AI to execute trades based on predefined rules and adaptive learning models.
Unlike traditional algorithmic trading, AI-based systems can learn from historical and real-time data, improving decisions over time.
These strategies reduce emotional bias and enable data-driven decision-making.
2. Core Components of AI Trading Strategies
Data Collection: Market prices, volume, order book data, news, social media sentiment, and macroeconomic indicators.
Data Processing: Cleaning, normalization, and feature extraction for accurate analysis.
AI Models: Machine learning, deep learning, reinforcement learning, and neural networks.
Execution Engine: Automatically places, modifies, and exits trades at optimal prices.
Risk Management Module: Controls exposure, position sizing, and drawdowns.
3. Types of Algorithmic AI Trading Strategies
Trend-Following Strategies:
AI identifies price momentum and trends using historical patterns.
Trades are placed in the direction of the prevailing trend.
Mean Reversion Strategies:
AI assumes prices revert to historical averages.
Trades are triggered when prices deviate significantly from the mean.
Arbitrage Strategies:
AI detects price inefficiencies across markets or instruments.
Executes simultaneous buy and sell orders to lock risk-free or low-risk profits.
Market-Making Strategies:
AI places buy and sell orders continuously to capture bid-ask spreads.
Requires ultra-low latency and precise risk control.
Sentiment-Based Strategies:
AI analyzes news, earnings reports, and social media sentiment.
Trades are aligned with positive or negative market sentiment signals.
4. Role of Machine Learning in Trading
Supervised Learning:
Uses labeled data to predict price direction or volatility.
Unsupervised Learning:
Identifies hidden patterns, clusters, and market regimes.
Reinforcement Learning:
AI learns by trial and error, optimizing strategies through rewards and penalties.
Deep Learning:
Neural networks analyze complex, non-linear relationships in market data.
5. Strategy Development Process
Idea Generation: Identifying inefficiencies or repeatable patterns.
Backtesting: Testing strategies on historical data to evaluate performance.
Optimization: Fine-tuning parameters to improve risk-adjusted returns.
Paper Trading: Simulating trades in real-time without real money.
Live Deployment: Executing strategies in real market conditions.
6. Risk Management in AI Trading
Position Sizing: Limits capital allocation per trade.
Stop-Loss Mechanisms: Automatically exit losing trades.
Diversification: Trading across multiple assets and strategies.
Drawdown Control: Prevents excessive losses during adverse market phases.
Model Risk Monitoring: Detects when AI models stop performing effectively.
7. Advantages of Algorithmic AI Trading
Speed and Efficiency: Executes trades in milliseconds.
Emotion-Free Trading: Eliminates fear, greed, and hesitation.
Scalability: Can trade multiple markets simultaneously.
Consistency: Follows rules strictly without deviation.
Data Utilization: Analyzes vast datasets beyond human capability.
8. Limitations and Challenges
Overfitting Risk: Models may perform well historically but fail in live markets.
Data Quality Issues: Poor data can lead to inaccurate signals.
Market Regime Changes: AI models may struggle during unexpected events.
High Infrastructure Costs: Requires powerful hardware and low-latency systems.
Regulatory Constraints: Compliance with market regulations is essential.
9. Ethical and Regulatory Considerations
Market Fairness: High-frequency AI trading can disadvantage retail traders.
Transparency: Black-box AI models are difficult to interpret.
Risk of Flash Crashes: Rapid automated trading can amplify volatility.
Regulatory Oversight: Authorities monitor algorithmic trading to prevent manipulation.
10. Role of AI Trading in Retail vs Institutional Markets
Institutional Traders:
Use advanced AI systems with large datasets and capital.
Focus on high-frequency and statistical arbitrage strategies.
Retail Traders:
Use simplified AI tools, bots, and platforms.
Emphasize swing trading, trend-following, and signal-based automation.
11. Integration with Other Technologies
Cloud Computing: Enables scalable data processing and storage.
Big Data Analytics: Enhances pattern recognition and forecasting.
Blockchain Integration: Improves transparency and settlement efficiency.
APIs and Trading Platforms: Allow seamless execution and monitoring.
12. Future of Algorithmic AI Trading
AI systems will become more adaptive and self-learning.
Greater use of alternative data such as satellite images and web traffic.
Improved explainable AI models for better transparency.
Increased regulatory frameworks to ensure market stability.
Wider adoption among retail traders through user-friendly platforms.
13. Conclusion
Algorithmic AI trading strategies represent a major evolution in financial markets.
They enhance efficiency, accuracy, and scalability of trading operations.
Despite challenges, proper risk management and ethical practices can make AI trading sustainable.
As technology advances, AI-driven strategies will continue to redefine how markets operate and how traders participate globally.
Mistakes Traders Must Avoid to Succeed in Financial Markets1. Trading Without a Plan
One of the most common and dangerous mistakes traders make is entering the market without a clear trading plan. A trading plan defines entry points, exit targets, stop-loss levels, position size, and risk tolerance. Without a plan, decisions are driven by emotions rather than logic. Traders who operate impulsively often overtrade, exit too early, or hold losing positions for too long. A well-defined plan provides structure, reduces confusion, and helps traders stay disciplined even during volatile market conditions.
2. Ignoring Risk Management
Risk management is the backbone of successful trading, yet many traders overlook it. Risking too much capital on a single trade can wipe out weeks or even months of gains. Professional traders usually risk only a small percentage of their capital—often 1–2%—per trade. Ignoring stop-loss orders, increasing position size after losses, or using excessive leverage exposes traders to catastrophic losses. Protecting capital should always be the first priority.
3. Letting Emotions Control Decisions
Emotional trading is a silent account killer. Fear, greed, hope, and frustration influence traders to make irrational decisions. Fear may cause early exits from profitable trades, while greed can lead to holding positions longer than planned. Revenge trading—placing impulsive trades after a loss to recover money quickly—is another emotional trap. Successful traders learn to detach emotionally from trades and follow their strategy consistently, regardless of short-term outcomes.
4. Overtrading
Overtrading occurs when traders place too many trades, often without valid setups. This usually happens due to boredom, overconfidence, or the desire to recover losses quickly. Excessive trading increases transaction costs, reduces focus, and leads to poor-quality decisions. Markets do not offer opportunities all the time, and waiting patiently for high-probability setups is a key skill every trader must develop.
5. Lack of Proper Market Knowledge
Many traders enter the market without fully understanding how it works. Trading without knowledge of market structure, technical analysis, fundamental factors, or economic events increases the chances of failure. For example, ignoring earnings announcements, economic data releases, or central bank decisions can lead to unexpected volatility. Continuous learning and staying updated with market dynamics are essential for long-term success.
6. Not Using Stop-Loss Orders
Refusing to use stop-loss orders is a costly mistake. Some traders avoid stop-losses hoping the market will reverse in their favor. Unfortunately, losses can grow rapidly, damaging both capital and confidence. Stop-loss orders act as a safety net, limiting losses and allowing traders to live to trade another day. Accepting small losses is a part of trading and is far better than suffering large, uncontrollable drawdowns.
7. Chasing the Market
Chasing trades after a big price move often results in entering at the worst possible time. Traders see a stock or asset moving sharply and fear missing out (FOMO). As a result, they enter late, just before a reversal or correction. Successful traders wait for proper pullbacks, confirmations, and setups rather than reacting emotionally to sudden price movements.
8. Poor Position Sizing
Even a good strategy can fail if position sizing is incorrect. Taking positions that are too large increases emotional stress and amplifies losses. Conversely, positions that are too small may not justify the effort or risk taken. Proper position sizing ensures that each trade aligns with the trader’s risk tolerance and overall capital management strategy.
9. Lack of Patience and Discipline
Markets reward patience, but many traders want quick profits. Impatience leads to entering trades prematurely, ignoring confirmation signals, or exiting winning trades too early. Discipline is required to follow the trading plan consistently, even after a series of losses or wins. Traders who lack discipline often change strategies frequently, never giving one approach enough time to prove its effectiveness.
10. Failing to Keep a Trading Journal
A trading journal is a powerful learning tool, yet many traders neglect it. Without reviewing past trades, it is difficult to identify mistakes, strengths, and patterns in behavior. A journal helps traders understand what works, what doesn’t, and why. Over time, this self-analysis leads to improved strategies and better decision-making.
11. Unrealistic Expectations
Many traders enter the market expecting quick and easy money. This mindset leads to excessive risk-taking and disappointment. Trading is a skill that requires time, practice, and patience. Unrealistic expectations often cause traders to abandon good strategies prematurely or take unnecessary risks in pursuit of fast profits.
12. Not Adapting to Market Conditions
Markets change over time—trends, volatility, and liquidity are not constant. Traders who fail to adapt their strategies to changing conditions often struggle. A strategy that works in a trending market may fail in a sideways market. Successful traders regularly review and adjust their approach based on current market behavior.
Conclusion
Avoiding common trading mistakes is just as important as finding profitable opportunities. Trading success is not about perfection, but about consistency, discipline, and continuous improvement. By developing a solid trading plan, practicing effective risk management, controlling emotions, and committing to lifelong learning, traders can significantly improve their performance. Markets will always be uncertain, but traders who avoid these critical mistakes place themselves in a far stronger position to achieve long-term success.

Indian Trading Market Reports: Trends and PerformanceStructure of the Indian Trading Market
India’s trading market is primarily driven by its two major stock exchanges: the National Stock Exchange (NSE) and the Bombay Stock Exchange (BSE). These exchanges facilitate trading in equities, derivatives, currencies, and commodities. Equity markets form the backbone of trading activity, while derivatives such as futures and options contribute significantly to daily volumes, particularly in indices like NIFTY 50 and BANK NIFTY.
Market reports usually begin by outlining index performance. Benchmark indices such as the NIFTY 50, Sensex, NIFTY Bank, and sectoral indices are closely monitored to gauge overall market sentiment. A rising index typically reflects optimism and economic strength, while a declining index may signal caution, uncertainty, or external pressures.
Role of Market Reports in Trading
Indian trading market reports act as a bridge between raw market data and actionable insights. They consolidate vast amounts of information—price movements, volumes, volatility, and technical indicators—into a structured narrative. These reports help traders identify trends, key support and resistance levels, momentum shifts, and potential breakout or breakdown zones.
For investors, market reports provide a broader view of economic health, corporate earnings, and policy developments. Long-term participants rely on these reports to assess valuation levels, sector rotation, and growth opportunities. In essence, trading market reports transform complex market behavior into understandable analysis.
Market Trends and Sentiment Analysis
A major component of Indian trading market reports is trend analysis. Trends can be short-term (intraday or weekly), medium-term (monthly), or long-term (yearly). Reports often highlight whether the market is in an uptrend, downtrend, or consolidation phase.
Sentiment analysis is equally important. Indian markets are influenced by both domestic and global cues. Positive sentiment may arise from strong GDP growth, declining inflation, stable interest rates, or robust corporate earnings. Negative sentiment can be triggered by geopolitical tensions, global market sell-offs, rising crude oil prices, or currency volatility.
Market reports frequently classify sentiment as bullish, bearish, or neutral, helping traders align their strategies accordingly.
Sectoral Performance Insights
Indian trading market reports place strong emphasis on sectoral analysis. Sectors such as banking, information technology, pharmaceuticals, metals, energy, FMCG, and infrastructure are tracked individually. Sectoral indices reveal where money is flowing and which areas are under pressure.
For example, strong performance in banking and financial stocks often indicates confidence in economic growth and credit expansion. A rally in IT stocks may be driven by currency depreciation or strong global demand. Conversely, weakness in metal stocks could reflect declining global commodity prices or reduced industrial demand.
By studying sectoral trends, traders can identify leadership sectors and laggards, enabling better capital allocation and risk management.
Derivatives and F&O Market Overview
Derivatives play a significant role in Indian trading, and market reports dedicate special sections to futures and options (F&O) data. Open interest, option chain analysis, put-call ratios, and rollover data are commonly analyzed.
These indicators help traders understand institutional positioning and market expectations. High call open interest at a particular strike price may indicate resistance, while high put open interest can suggest support. Changes in open interest along with price movements reveal whether positions are being built or unwound.
F&O insights are especially valuable for short-term traders who rely on volatility and momentum.
Influence of Macroeconomic Factors
Indian trading market reports closely track macroeconomic variables such as inflation, interest rates, fiscal deficit, industrial production, and trade data. Announcements by the Reserve Bank of India (RBI), Union Budget, and government policy reforms have immediate and sometimes long-lasting impacts on the market.
Global factors also play a vital role. Movements in US markets, Federal Reserve decisions, crude oil prices, and global risk sentiment significantly influence Indian markets. Market reports integrate these factors to explain sudden spikes or declines in prices.
Technical and Fundamental Perspectives
A comprehensive Indian trading market report balances both technical and fundamental analysis. Technical analysis focuses on charts, indicators, patterns, and price action to forecast short-term movements. Fundamental analysis evaluates company earnings, balance sheets, management quality, and growth prospects to assess intrinsic value.
By combining both approaches, reports cater to a wide range of market participants—from day traders to long-term investors.
Risk Factors and Volatility
Volatility is an inherent part of trading, and Indian market reports emphasize risk awareness. Sudden news events, policy changes, or global shocks can increase volatility sharply. Reports often include volatility index (India VIX) analysis to indicate expected market fluctuations.
Understanding risk factors helps traders position themselves prudently, use stop-loss strategies, and avoid emotional decision-making.
Future Outlook and Conclusion
Indian trading market reports usually conclude with a forward-looking outlook. This section highlights key levels to watch, upcoming economic events, earnings schedules, and potential risk triggers. While no report can predict the market with certainty, a well-structured outlook prepares traders for multiple scenarios.
In conclusion, Indian trading market reports are indispensable tools in today’s fast-moving financial environment. They provide clarity, structure, and perspective amid market noise. By analyzing trends, sectors, derivatives, and macroeconomic factors, these reports empower market participants to make informed, disciplined, and strategic trading decisions.
Part 1 Ride The Big Moves Key Participants in Option Trading
There are two primary participants:
Option Buyer
Pays a premium to buy the option
Has limited risk (maximum loss is the premium paid)
Has potentially unlimited profit (in certain cases)
Option Seller (Writer)
Receives the premium
Has limited profit (only the premium received)
Bears higher or unlimited risk
Understanding the mindset of buyers and sellers is crucial because option prices are driven by their interaction.

Part 1 Technical Analysis vs. Institutional Option Trading Call Options (CE) – Explained
A Call Option gives the buyer the right to buy the underlying asset at the strike price.
Why Buy a Call Option?
You buy a call when you expect the price to rise.
Example:
NIFTY is at 22,000
You buy NIFTY 22,000 CE @ ₹100
If NIFTY goes to 22,400 at expiry:
Intrinsic value = 22,400 – 22,000 = 400
Profit = 400 – 100 = ₹300 x lot size
If NIFTY stays below 22,000:
Your call expires worthless
Loss = Premium = ₹100
Why Sell a Call Option?
You sell a call when you expect the price to stay below strike.
Call Seller View:
Market will fall OR stay sideways
Premium will decrease (time decay)

Understanding the Power of Volume in Financial MarketsWhat Is Volume in Trading?
Volume represents the total number of shares, contracts, or lots traded in a security or market during a specific period. In stocks, it is the number of shares exchanged; in futures and options, it is the number of contracts traded. Volume is typically displayed as vertical bars below price charts, giving traders a visual sense of market activity.
High volume indicates strong interest and participation from traders and investors, while low volume suggests weak interest or indecision. Importantly, volume does not predict direction on its own, but when combined with price action, it provides powerful confirmation.
Why Volume Is Important in Trading
Volume is often called the “heartbeat of the market” because it reflects real commitment behind price movements. Price can move up or down on low volume, but such moves are often unreliable and prone to failure. When price movement is accompanied by high volume, it shows conviction and increases the probability that the move will continue.
Key reasons volume is crucial:
Confirms trends – Strong trends are supported by rising volume.
Validates breakouts – Breakouts with high volume are more likely to succeed.
Signals reversals – Sudden volume spikes can indicate a change in trend.
Shows institutional activity – Large players usually leave volume footprints.
Volume and Trend Confirmation
One of the most common uses of volume is to confirm trends. In an uptrend, volume should generally increase during upward price movements and decrease during pullbacks. This pattern shows that buyers are aggressive and sellers are weak. Conversely, in a downtrend, volume tends to increase during price declines and decrease during rallies, confirming seller dominance.
If prices are rising but volume is falling, it creates a bearish divergence, warning that the uptrend may be losing strength. Similarly, falling prices on declining volume may indicate that selling pressure is weakening and a reversal could be near.
Trading Breakouts with Volume
Breakouts occur when price moves beyond a key support or resistance level. Many false breakouts happen in low-volume environments. Volume helps traders filter out these traps.
High-volume breakout: Indicates strong participation and higher chances of continuation.
Low-volume breakout: Often lacks conviction and may result in a pullback or false move.
Professional traders wait for volume expansion during a breakout to confirm that the market agrees with the price move.
Volume Spikes and Market Reversals
Sudden, unusually high volume—known as a volume spike—often appears near market tops or bottoms. These spikes may represent panic selling, aggressive buying, or institutional accumulation/distribution.
For example:
After a long downtrend, a sharp fall with extremely high volume followed by price stabilization may signal capitulation, often leading to a reversal.
Near market tops, high volume combined with slow price progress may suggest distribution, where smart money is selling to late buyers.
Understanding these volume clues helps traders anticipate turning points.
Popular Volume-Based Indicators
Traders often enhance raw volume analysis with technical indicators, such as:
Volume Moving Average: Smooths volume data to identify unusual activity.
On-Balance Volume (OBV): Measures cumulative buying and selling pressure.
Volume Weighted Average Price (VWAP): Shows the average price weighted by volume, widely used by institutions.
Accumulation/Distribution Line: Identifies whether money is flowing into or out of a stock.
These tools help traders align price action with underlying market participation.
Volume in Different Market Conditions
Volume behaves differently depending on market structure:
Trending markets: Volume expands in the direction of the trend.
Range-bound markets: Volume contracts as price oscillates between support and resistance.
News-driven markets: Volume spikes sharply due to sudden influx of orders.
Recognizing these patterns allows traders to adapt strategies to current conditions.
Volume and Risk Management
Trading with volume also improves risk management. Entering trades during high-volume periods ensures better liquidity, tighter spreads, and smoother execution. Low-volume trading environments increase the risk of slippage and erratic price movements.
Volume can also help traders decide when not to trade. If volume is significantly below average, it may be better to stay on the sidelines rather than force trades in uncertain conditions.
Common Mistakes When Using Volume
While volume is powerful, it must be used correctly. Common mistakes include:
Using volume alone without price context
Ignoring volume during key chart patterns
Misinterpreting low volume as always bearish or bullish
Overreacting to single volume spikes without confirmation
Successful traders combine volume with price action, support-resistance levels, and broader market context.
Conclusion
Trading with volume adds depth, clarity, and confidence to market analysis. Volume reveals the strength behind price movements, exposes institutional activity, and helps traders avoid false signals. Whether confirming trends, validating breakouts, or spotting reversals, volume acts as a crucial companion to price action.
In essence, price tells you where the market is going, but volume tells you whether it is worth following. Traders who learn to read volume effectively gain a significant edge, improving both accuracy and consistency in their trading decisions.

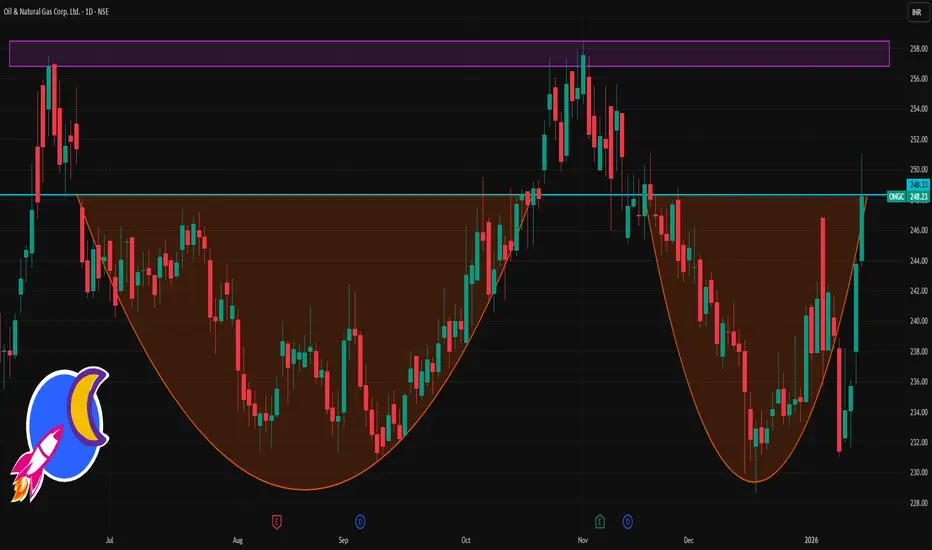
ONGC 1 Day Time Frame 📌 Live Price Snapshot (Latest Available)
Current Price (approx): ₹244 – ₹248 range on NSE today (near ₹248)
Day Low / Day High (intraday): ~₹244 / ₹251
Price may vary slightly based on live market data at the moment.
📊 Daily Pivot‑Based Levels (for Today’s Price Action)
Daily Pivot / Reference Point (based on previous session)
Pivot (PP): ~₹245.36
Daily Resistances (Upside Levels)
R1: ₹248.00
R2: ₹250.13
R3: ₹252.77
Daily Supports (Downside Levels)
S1: ₹243.23
S2: ₹240.59
S3: ₹238.46
Note: These pivot levels are classic calculations from the previous session’s high/low/close — standard for daily timeframe traders.
📌 How to Use These Levels (Daily TF)
Above Pivot (PP ≈ ₹245‑₹246): suggests intraday bullish bias, with first upside target near R1/R2.
Below Pivot: downside pressure may extend toward S1/S2.
Break of R2 (~₹250) / S2 (~₹240): often signals stronger directional continuation for the session.
HCC 1 Week Time Frame 📍 Live Price Snapshot
Approx current price: ~₹18.7–₹19.0 (latest live levels)
📊 1‑Week Technical Levels (Pivot Based)
These levels are useful for short‑term trades this week:
🔹 Weekly Pivot & Resistance
Pivot Point: ₹18.79 (base zone)
R1 (First Resistance): ~₹19.09
R2: ~₹19.56
R3: ~₹19.86
👉 Bullish view: Sustained trade above R1 ~₹19.1–₹19.3 may signal short‑term upside continuation towards R2/R3.
🔻 Weekly Support Levels
S1: ~₹18.32
S2: ~₹18.02
S3: ~₹17.55
👉 Bearish view: A break below S2 ~₹18.0 can open risk toward S3 ~₹17.5.
📌 Short‑Term Trend Indicators
RSI (~neutral): ~46–56 — showing neither strong buy nor oversold pressure currently.
Moving Averages: Price is near short‑term moving averages, but all major mid‑term EMAs/SMAs are above price indicating a bearish bias in broader trend.
Summary of Technical Bias:
Bullish above pivot/R1 (~₹18.8–19.1): Could test R2 ~₹19.5 and R3 ~₹19.8+.
Neutral range: Between ₹18.3–₹19.1.
Bearish below S1/S2 (~₹18.3/₹18.0): Potential move down toward ₹17.5 support.
🧠 Weekly Outlook (Quick Interpret)
✔ Immediate resistance range: ₹19.1–₹19.8
✔ Immediate support range: ₹18.0–₹18.5
✔ Trend context: Short‑term consolidation with a slight bearish edge on broader SMAs; buy setup improves only on clear weekly strength above the pivot/resistance zone.

Market Focus: The Foundation of Smart Trading and InvestingUnderstanding What “Market Focus” Really Means
Market focus is the ability to observe, analyze, and respond to market behavior with clarity and purpose. It is not about watching every price tick or reacting to every news headline. Instead, it involves identifying key drivers such as trends, volume, macroeconomic signals, sector strength, and risk sentiment. A focused market participant knows where to look, what to ignore, and when to act.
Many participants confuse activity with focus. Constant trading, excessive chart watching, or chasing hot tips often reduces focus rather than enhancing it. True market focus simplifies complexity. It narrows attention to high-probability setups, reliable data, and repeatable processes.
The Role of Market Structure
A focused approach begins with understanding market structure. Markets move in trends, ranges, and transitions. Recognizing whether the market is bullish, bearish, or sideways provides a framework for decision-making. Trading against the dominant structure often leads to unnecessary losses, while trading with structure improves probability.
Market structure also includes support and resistance zones, supply and demand areas, and liquidity levels. These are not random points but areas where institutional participation is often concentrated. Focusing on structure helps traders avoid emotional entries and instead act where risk and reward are clearly defined.
Filtering Noise and Distractions
One of the biggest challenges in maintaining market focus is information overload. Social media, financial news channels, and constant alerts can distort perception. Not every piece of news is actionable. Not every market move requires participation.
A focused market participant develops the ability to separate signal from noise. This includes ignoring rumors, avoiding impulsive trades based on headlines, and sticking to predefined criteria. By reducing unnecessary inputs, clarity improves, and decision-making becomes calmer and more rational.
Importance of Time Frame Alignment
Market focus also depends on aligning with the correct time frame. Short-term traders, swing traders, and long-term investors all view the same market differently. Confusion arises when time frames are mixed—such as taking long-term positions based on short-term emotions or exiting long-term investments due to short-term volatility.
A disciplined focus requires committing to a specific time horizon and analyzing the market accordingly. Weekly and monthly trends guide investors, while intraday and daily structures guide traders. Time frame alignment reduces stress and improves consistency.
Risk Management as a Focus Tool
Risk management is often discussed as protection, but it is also a powerful focus mechanism. When risk is predefined, emotions are controlled. Knowing how much capital is at risk allows the mind to stay objective rather than fearful or greedy.
Focused market participants think in terms of probabilities, not predictions. Losses are accepted as part of the process, not personal failures. This mindset keeps attention on execution quality rather than outcomes of individual trades.
Psychological Discipline and Market Focus
The market constantly tests patience, confidence, and emotional control. Fear, greed, revenge trading, and overtrading are all symptoms of lost focus. Psychological discipline restores market focus by reinforcing rules, routines, and self-awareness.
Successful participants often follow structured routines—pre-market analysis, defined entry and exit rules, and post-market reviews. These habits anchor attention and prevent impulsive decisions. Focused traders and investors understand that consistency comes from behavior, not brilliance.
Adapting to Changing Market Conditions
Market focus does not mean rigidity. Markets evolve due to economic cycles, interest rate changes, geopolitical events, and technological shifts. A focused participant remains adaptable without becoming reactive.
This adaptability comes from continuous learning and observation. When volatility rises, position sizing adjusts. When trends weaken, expectations change. Focus allows participants to respond intelligently rather than emotionally to changing conditions.
Long-Term Vision and Market Focus
For investors, market focus is deeply connected to long-term vision. Short-term market fluctuations are inevitable, but long-term value creation follows fundamentals, earnings growth, and economic expansion. A focused investor resists panic during corrections and avoids euphoria during rallies.
Long-term market focus emphasizes asset allocation, diversification, and compounding rather than frequent trading. This perspective reduces stress and improves wealth-building outcomes over time.
Technology and Tools Supporting Focus
Modern tools—charts, indicators, scanners, and data platforms—can enhance focus when used correctly. However, overuse leads to confusion. Focused market participants select a limited set of tools that complement their strategy and ignore the rest.
Technology should support decision-making, not replace thinking. Simplicity often outperforms complexity in maintaining clarity and discipline.
Conclusion: Focus as a Competitive Advantage
In competitive financial markets, information is widely available, but focus is rare. The ability to concentrate on what truly matters—market structure, risk, time frame, and psychology—creates a lasting edge. Market focus is not built overnight; it develops through experience, discipline, and self-control.
Whether trading short-term or investing long-term, focusing on the market with clarity and purpose transforms uncertainty into opportunity. In the end, success in markets is less about predicting the future and more about maintaining focus in the present.
Part 10 Trade Like Institutions Single-Leg Strategies
A. Long Call
Buy call when expecting uptrend.
B. Long Put
Buy put when expecting downtrend.
C. Covered Call
Sell call against stocks you own.
D. Cash-Secured Put
Sell put when you want to buy stock at a lower price.

IEX 1 Month View 📊 Current Price Context (Recent 1-Month)
• Latest available quote (as of Jan 9, 2026 close): ~₹138 – ₹140.
📈 1-Month Technical Levels (Short-Term)
Key Resistance Levels (Upside)
These are levels where price may face selling pressure:
₹144 – ₹145 — Immediate resistance zone near recent moving average / pivot cluster.
₹147 – ₹150 — Secondary resistance around recent swing highs.
₹150 + — Broader psychological resistance zone; breakout above this could signal short-term bullish shift.
📉 Key Support Levels (Downside)
These are levels where buyers may step in:
₹138 – ₹139 — Immediate support aligned with recent lows.
₹135 – ₹136 — Next short-term support on pullbacks.
₹132 – ₹133 — Deeper support area reflecting recent range lows.
~₹130 — Longer buffer support zone seen in broader weekly context.
📊 Moving Averages & Technical Indicators
From the most recent technical snapshot (2 days ago):
Short-term moving averages (5/10/20/50 SMA & EMA): Bearish bias — price below most averages.
RSI ~47-51: Neutral zone, not strongly overbought or oversold.
MACD slightly bullish signal but trend weak.
👉 This setup suggests range-bound movement in the near term unless a breakout/ breakdown occurs.
⚠️ Important Context
The stock has recently been volatile due to regulatory news (market coupling debates) affecting sentiment and price action. This has led to wide swings and lower structural confidence in trend direction.

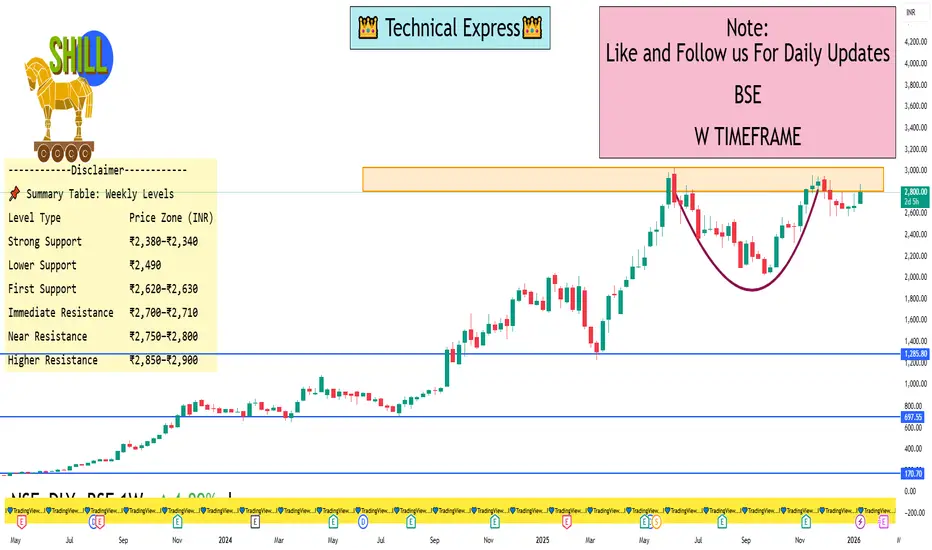
BSE 1 Week View📊 Current approximate price: around ₹2,800–₹2,830 on NSE at latest close.
📈 Weekly Time-Frame Key Levels
🔥 Resistance Levels (Upside Zones)
Immediate weekly resistance: ~₹2,700–₹2,710 — first hurdle above current price on weekly candles.
Next resistance: ~₹2,750–₹2,800 zone — if weekly closes above ₹2,700 area, bulls target this.
Higher breakout area: ~₹2,850–₹2,900 — next range of selling interest above the prior highs.
💡 So weekly up move usually needs a weekly candle close above ~₹2,700–₹2,710 to extend gains.
📉 Support Levels (Downside Zones)
First support: ~₹2,620–₹2,630 — short-term weekly support zone.
Lower support: ~₹2,490 — next zone if price loses the above support.
Strong support / base area: ~₹2,380–₹2,340 — deeper weekly support below ~₹2,490.
➡️ If price closes below ~₹2,620 on weekly, risk increases toward ₹2,490 and ₹2,380 supports.
📊 Weekly Trading Interpretation
Bullish Case (if Weekly Holds/Closes Above):
Above ₹2,700–₹2,710 weekly → potential squeeze toward ₹2,750–₹2,800 then ₹2,850–₹2,900+.
Bearish Case (if Weekly Breaks Below):
Weekly close below ₹2,620 opens downside toward ₹2,490 then ₹2,380–₹2,340.
Neutral/Range:
Between ₹2,620 – ₹2,700, expect choppy sideways movement.
Part 2 Intraday Master Class How Option Prices Are Determined
The price of an option (premium) is influenced by several factors. The most important include:
1. Underlying Price
As price moves up:
Calls become expensive
Puts become cheaper
As price moves down:
Puts become expensive
Calls become cheaper
2. Volatility
Volatility (IV – Implied Volatility) has a huge impact.
High IV → Expensive premiums
Low IV → Cheaper premiums
IV reflects expected future movement.
3. Time to Expiry
Options decay faster as expiry approaches.
This is called Theta Decay.
Weekly options decay rapidly (especially last 3 days).
4. Interest Rates & Dividends
These influence option pricing slightly but are more relevant for institutional traders.

Mastering High-Speed Profits in the Stock MarketIntraday Scalping:
Intraday scalping is one of the most fast-paced and skill-intensive trading strategies in financial markets. It focuses on capturing small price movements multiple times within a single trading day, often within minutes or even seconds. Unlike swing trading or positional investing, scalping does not rely on large trends. Instead, it exploits micro-price fluctuations, liquidity, and volatility to generate consistent profits through volume and precision.
Below is a detailed 1000-word explanation of intraday scalping, covering its philosophy, tools, strategies, risks, and mindset.
1. What Is Intraday Scalping?
Intraday scalping is a short-term trading technique where traders:
Enter and exit trades within the same trading session
Hold positions for a few seconds to a few minutes
Target small price movements
Execute multiple trades per day
The core idea is simple: small profits × high frequency = meaningful returns.
Scalpers do not carry positions overnight, avoiding gap risk, global news shocks, and overnight volatility.
2. Why Scalping Works in Intraday Markets
Scalping thrives because markets constantly fluctuate due to:
Order flow imbalance
High liquidity in index stocks and derivatives
Algorithmic trading activity
Institutional participation
News-driven momentum bursts
In highly liquid instruments, prices rarely stay still. Scalpers capitalize on these continuous movements with disciplined execution.
3. Key Characteristics of a Scalping Strategy
Intraday scalping has distinct features:
Very Short Timeframes
Common charts include 1-minute, 2-minute, and 5-minute
High Trade Frequency
10–50 trades per session is common for active scalpers
Small Stop Loss & Target
Typical risk-reward ranges from 1:1 to 1:1.5
High Accuracy Over High Reward
Win rate matters more than big profits per trade
Strict Discipline
No emotional trading, no hope-based holding
4. Instruments Best Suited for Scalping
Not all instruments are suitable for scalping. The best ones offer high liquidity and tight spreads:
Index futures (NIFTY, BANK NIFTY, FINNIFTY)
Large-cap stocks with high volume
Highly liquid options (near-ATM strikes)
Forex major pairs (for global traders)
Index ETFs
Illiquid stocks are avoided due to slippage and erratic price behavior.
5. Technical Tools Used in Intraday Scalping
Scalpers rely heavily on technical analysis and market structure:
A. Moving Averages
9 EMA, 20 EMA, VWAP
Used for trend direction and dynamic support/resistance
B. VWAP (Volume Weighted Average Price)
A critical tool for intraday bias
Above VWAP = bullish sentiment
Below VWAP = bearish sentiment
C. Support & Resistance
Previous day high/low
Opening range
Intraday demand and supply zones
D. Momentum Indicators
RSI (short periods like 7 or 9)
Stochastic Oscillator
MACD histogram for momentum bursts
E. Volume & Price Action
Volume spikes confirm breakout validity
Candlestick patterns like engulfing, pin bars, and inside bars
6. Popular Intraday Scalping Strategies
1. VWAP Rejection Strategy
Trades are taken when price rejects VWAP with strong volume confirmation.
2. Opening Range Breakout (ORB) Scalping
The first 5–15 minutes define a range. Breakout with volume leads to quick scalps.
3. Pullback Scalping
Trade in the direction of the main trend after a shallow retracement to EMA or VWAP.
4. Momentum Burst Scalping
Quick entries during sudden volume and price expansion caused by news or institutional orders.
5. Range Scalping
Buying near support and selling near resistance in sideways markets.
7. Risk Management in Scalping
Risk control is the foundation of successful scalping:
Fixed stop loss for every trade
Risk only 0.25%–0.5% of capital per trade
Daily maximum loss limit
Stop trading after consecutive losses
Never average losing trades
In scalping, capital protection is more important than profit chasing.
8. Psychology of a Successful Scalper
Scalping is mentally demanding. Successful scalpers develop:
Emotional neutrality
Ability to accept small losses quickly
High focus and alertness
Discipline to follow rules strictly
Detachment from individual trade outcomes
Overtrading, revenge trading, and hesitation are the biggest enemies of scalpers.
9. Technology & Execution Speed
Because scalping depends on precision:
Fast internet connection is essential
Reliable trading platform
Low brokerage and transaction costs
Quick order execution
Direct market access where possible
Even a small delay can turn a profitable trade into a loss.
10. Advantages of Intraday Scalping
No overnight risk
Quick feedback and learning curve
Works in both trending and ranging markets
Capital efficiency
Clear entry and exit rules
11. Challenges and Risks
High stress and screen time
Requires constant attention
Transaction costs can eat profits
Emotional fatigue
Not suitable for part-time traders
Scalping is not a shortcut to quick money—it is a professional-level trading approach.
12. Who Should Choose Scalping?
Intraday scalping is ideal for traders who:
Can monitor markets actively
Have strong discipline
Enjoy fast decision-making
Are comfortable with frequent trades
Prefer short exposure durations
It is not suitable for investors or traders who dislike screen-based work.
Conclusion
Intraday scalping is a precision-driven, high-discipline trading methodology designed for traders who thrive in fast environments. Success in scalping does not come from prediction, but from probability, execution, and consistency. When combined with proper risk management, sound psychology, and robust technical frameworks, scalping can become a powerful tool for generating steady intraday income.

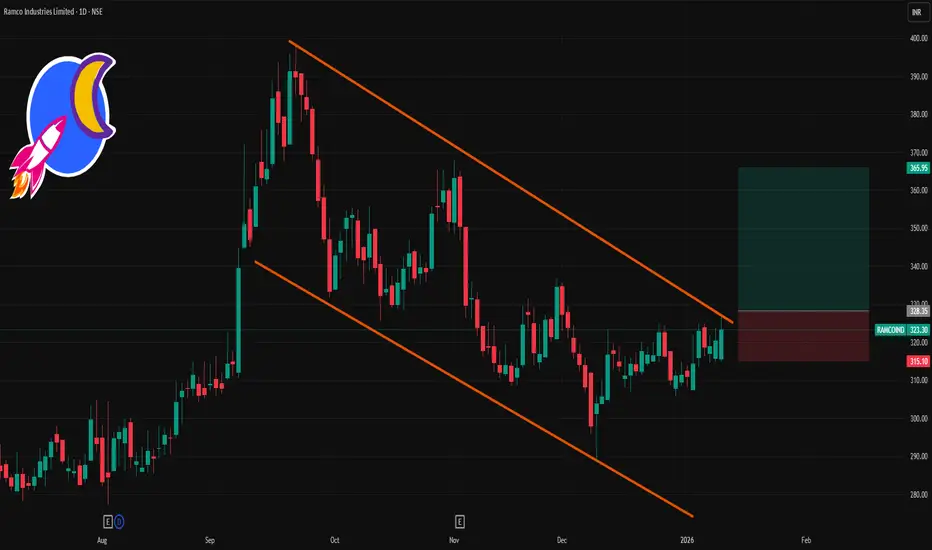
RAMCOIND 1 Day Time Frame 📈 Current Price (Approx Latest Close)
📌 Last Traded / Closing Price: ~₹323.30 on NSE (as of Jan 9, 2026)
📊 Daily Pivot & Support/Resistance Levels
Classic Pivot Levels (Daily)
These are useful for intraday and short‑term directional bias:
Level Price (Approx)
R3 ~₹336.23
R2 ~₹329.12
R1 ~₹321.78
Pivot ~₹314.67
S1 ~₹307.33
S2 ~₹300.22
S3 ~₹292.88
Interpretation:
Above Pivot (~314–315): bullish bias.
Above R1 (~321–322): stronger upside view.
Break above R2 (~329): could shift momentum higher intraday.
Below Pivot: more bears in control.
📌 Alternate Daily Pivot (Standard)
Another reliable pivot view from recent technical data:
Level Price
R3 ~₹324.02
R2 ~₹321.03
R1 ~₹316.62
Pivot ~₹313.63
S1 ~₹309.22
S2 ~₹306.23
S3 ~₹301.82
This set is slightly tighter but confirms similar zones near ₹310–₹322.
📌 How to Use These Levels Today
Bullish below/above strategy:
Bullish view: Price staying above Pivot (~₹314–315) and ideally R1 (~₹321–322) — targets R2 (~₹329) then R3 (~₹336).
Bearish risk: If price fails below Pivot (~₹314), next stops are S1 (~₹307) → S2 (~₹300).
🧾 Summary — 1D Levels Snapshot
Zone Level
Resistance 3 ~₹336
Resistance 2 ~₹329
Resistance 1 ~₹322
Pivot ~₹315
Support 1 ~₹307
Support 2 ~₹300
Support 3 ~₹293
KRISHNADEF 1 Week Time Frame 📌 Current Price Snapshot (as of 9 Jan 2026)
NSE Live Price: ~₹937 – ₹947 area (closed ~₹947)
Day Range: ₹850 – ₹1,019
RSI: ~68 → near bullish strength but not extreme overbought yet
📊 1‑Week Timeframe Key Levels (Estimated Technicals)
🟢 Resistance (Upside Targets)
R1: ~₹1,000 – ₹1,020 zone — near recent intra‑week high and psychological round number
R2: ~₹1,030 – ₹1,040 — close to 52‑week high resistance area
R3: ~₹1,060 + — stretch target if momentum continues strong
🔵 Pivot / Decision Zone
Pivot: ~₹930 – ₹940 — central decision point this week
• Above this → near‑term bullish
• Below this → potential sideways/pullback action
🔴 Support (Downside Defense)
S1: ~₹880 – ₹900 — first meaningful support (near recent opening/low area)
S2: ~₹840 – ₹860 — secondary support zone
S3: ~₹800 – ₹820 — stronger support if deeper pullback occurs
⏱ How to Use These Levels This Week
Bullish bias
Keep price trading above ₹930 pivot
Targets: ₹1,000 → ₹1,020 → ₹1,040+
Pullback / Correction Alert
Break below ₹900 and then ₹880 may signal deeper retracement
Strong support for bounce: ₹840 → ₹800
