Technology and Innovation in Trading1. Evolution of Trading Technology
From Open Outcry to Electronic Trading
Earlier, trading occurred through open outcry systems, where traders physically gathered at exchanges to buy and sell assets. This method was slow, prone to human error, and limited participation. The introduction of electronic trading platforms revolutionized markets by allowing orders to be placed digitally, improving speed and accuracy.
Rise of Online Trading Platforms
The emergence of the internet enabled online trading platforms, giving retail investors direct access to markets. Platforms such as terminal-based systems and broker apps democratized trading, reducing dependency on intermediaries and lowering transaction costs.
2. Algorithmic Trading (Algo Trading)
What Is Algorithmic Trading?
Algorithmic trading uses computer programs to execute trades automatically based on predefined rules such as price, volume, time, or technical indicators. These algorithms can process vast amounts of data faster than humans.
Benefits of Algo Trading
Speed: Executes trades in milliseconds
Accuracy: Eliminates emotional bias
Efficiency: Handles large order sizes with minimal market impact
Consistency: Follows rules strictly without fatigue
Types of Trading Algorithms
Trend-following algorithms
Mean reversion strategies
Statistical arbitrage
Execution algorithms (VWAP, TWAP)
Algo trading is now widely used by hedge funds, investment banks, and proprietary trading firms.
3. High-Frequency Trading (HFT)
High-frequency trading is an advanced form of algorithmic trading that relies on ultra-low latency systems and high-speed data connections. HFT firms make profits from tiny price inefficiencies by executing thousands of trades per second.
Key Innovations Behind HFT
Co-location services (servers placed near exchange servers)
Fiber-optic and microwave data transmission
Low-latency hardware and software optimization
While HFT improves market liquidity, it has also raised concerns about market fairness and volatility.
4. Artificial Intelligence and Machine Learning in Trading
Role of AI in Trading
Artificial Intelligence (AI) and Machine Learning (ML) enable systems to learn from historical data, identify complex patterns, and adapt strategies dynamically.
Applications of AI and ML
Predictive price modeling
Pattern recognition in charts
Sentiment analysis from news and social media
Risk management and portfolio optimization
Unlike traditional algorithms, AI-based systems improve over time, making them highly valuable in uncertain and fast-changing markets.
5. Big Data and Data Analytics
Explosion of Market Data
Modern trading relies on big data, including:
Tick-by-tick price data
Order book data
Economic indicators
Corporate fundamentals
News, earnings calls, and social media sentiment
Importance of Data Analytics
Advanced analytics tools help traders:
Identify hidden market trends
Measure volatility and correlations
Optimize entry and exit points
Improve backtesting accuracy
Big data analytics has become a cornerstone of institutional trading strategies.
6. Blockchain Technology and Trading
Blockchain in Financial Markets
Blockchain introduces decentralization, transparency, and immutability into trading systems. It enables peer-to-peer transactions without traditional intermediaries.
Innovations Enabled by Blockchain
Cryptocurrency trading
Decentralized exchanges (DEXs)
Smart contracts for automated settlement
Tokenization of assets (stocks, bonds, real estate)
Blockchain reduces settlement time, lowers costs, and enhances trust, especially in cross-border trading.
7. Cloud Computing and Trading Infrastructure
Cloud computing has transformed trading infrastructure by providing scalable, flexible, and cost-efficient computing resources.
Benefits of Cloud-Based Trading Systems
Real-time data access from anywhere
Faster deployment of trading strategies
Reduced hardware and maintenance costs
Enhanced disaster recovery and data security
Both retail traders and institutions increasingly rely on cloud-based analytics and execution platforms.
8. Mobile Trading and Fintech Innovation
Rise of Mobile Trading
Smartphones have enabled anytime, anywhere trading, increasing market participation. Mobile trading apps offer advanced charting, real-time alerts, and instant execution.
Fintech Disruption
Fintech innovations have introduced:
Zero-commission trading
Fractional investing
Robo-advisors
Integrated trading and banking solutions
These innovations have lowered entry barriers and increased financial inclusion.
9. Risk Management and Technology
Technology-Driven Risk Control
Modern trading systems integrate real-time risk management tools, including:
Automated stop-loss execution
Margin monitoring systems
Stress testing and scenario analysis
Exposure and drawdown limits
Technology helps traders identify risks early and take corrective actions before losses escalate.
10. Regulatory Technology (RegTech)
RegTech uses technology to ensure compliance with complex trading regulations. It enables:
Automated reporting
Trade surveillance
Fraud detection
Market abuse monitoring
As markets grow more complex, RegTech plays a critical role in maintaining transparency and investor protection.
11. Impact on Retail Traders
Technology has empowered retail traders by providing:
Advanced charting and indicators
Low-cost execution
Access to global markets
Educational tools and simulators
However, it also demands discipline and continuous learning, as sophisticated tools can amplify both profits and losses.
12. Challenges and Risks of Technological Trading
Despite its benefits, technology-driven trading comes with risks:
System failures and glitches
Over-optimization of strategies
Cybersecurity threats
Over-reliance on automation
Successful traders combine technology with sound judgment and robust risk management.
Conclusion
Technology and innovation have fundamentally transformed trading into a fast-paced, data-driven, and highly competitive activity. From algorithmic execution and AI-driven insights to blockchain-based settlement and mobile trading platforms, innovation continues to redefine how markets function. While technology enhances efficiency, accessibility, and profitability, it also increases complexity and risk. The future of trading belongs to those who can adapt, learn, and responsibly leverage technology while maintaining discipline and strategic clarity. In an increasingly digital financial world, technology is no longer a support tool—it is the backbone of modern trading.
Trendindicator

Inflation Nightmare Continues1. Understanding the Inflation Nightmare
Inflation refers to a sustained rise in the general price level of goods and services, reducing the purchasing power of money. When inflation remains high for a prolonged period and becomes difficult to control, it turns into an “inflation nightmare.” This nightmare is characterized by persistent cost pressures, declining real incomes, policy dilemmas, and economic uncertainty. In many economies, inflation has stopped being a short-term shock and has become a structural problem, affecting households, businesses, and governments alike.
2. Persistent Rise in Cost of Living
One of the most visible effects of continuing inflation is the relentless rise in the cost of living. Prices of essential items such as food, fuel, housing, healthcare, and education continue to increase faster than income growth. Middle-class and lower-income households suffer the most, as a larger portion of their earnings goes toward necessities. Even salaried individuals with stable jobs find it increasingly difficult to maintain their previous standard of living.
3. Erosion of Purchasing Power
High inflation steadily erodes purchasing power. Money saved today buys fewer goods and services tomorrow. Fixed-income groups such as pensioners, retirees, and low-wage workers are hit hardest because their incomes do not adjust quickly to rising prices. Over time, this erosion discourages savings and pushes people toward risky investments just to preserve wealth.
4. Food Inflation and Supply-Side Pressures
Food inflation plays a central role in prolonging the inflation nightmare. Factors such as climate change, erratic monsoons, droughts, floods, rising fertilizer costs, and supply chain disruptions push food prices higher. Since food constitutes a significant share of household expenditure, especially in developing economies, even moderate food inflation causes severe social and political stress.
5. Energy Prices and Fuel Shock
Energy prices remain a major driver of inflation. Rising crude oil, natural gas, and electricity costs increase transportation, manufacturing, and logistics expenses. These higher input costs are passed on to consumers, creating second-round inflation effects. Fuel inflation also affects public transport fares and freight costs, amplifying price pressures across the economy.
6. Global Factors Fueling Inflation
The inflation nightmare is not limited to one country; it is global in nature. Geopolitical conflicts, trade disruptions, sanctions, and de-globalization trends have increased the cost of imports and reduced supply efficiency. Currency depreciation in emerging markets further worsens inflation by making imported goods more expensive, particularly energy and technology-related products.
7. Wage-Price Spiral Risk
As inflation persists, workers demand higher wages to cope with rising living costs. While wage hikes are necessary for survival, they can lead to a wage-price spiral. Businesses facing higher wage bills raise product prices, which in turn triggers fresh wage demands. This self-reinforcing cycle makes inflation harder to control and prolongs the nightmare.
8. Impact on Businesses and Profit Margins
Businesses face rising input costs, higher borrowing rates, and uncertain demand. Small and medium enterprises (SMEs) are particularly vulnerable because they have limited pricing power and thinner margins. Many companies are forced to either reduce output, compromise on quality, or pass costs onto consumers, further fueling inflationary pressures.
9. Central Bank Policy Dilemma
Central banks play a critical role in fighting inflation, but persistent inflation puts them in a policy dilemma. Raising interest rates helps control inflation but slows economic growth, increases unemployment, and raises borrowing costs. Keeping rates low supports growth but risks allowing inflation to spiral out of control. This delicate balance makes policy decisions more complex and politically sensitive.
10. High Interest Rates and Borrowing Stress
To curb inflation, central banks often increase interest rates. While this helps cool demand, it also raises EMIs on home loans, personal loans, and business credit. Households delay spending, and companies postpone expansion plans. High interest rates can eventually lead to economic slowdown or even recession, deepening public anxiety.
11. Government Fiscal Challenges
Inflation increases government expenditure on subsidies, welfare schemes, and interest payments on debt. At the same time, governments face pressure to reduce taxes or provide relief to citizens. Balancing fiscal discipline with social support becomes increasingly difficult, especially for developing economies with limited resources.
12. Rising Inequality
Persistent inflation worsens income and wealth inequality. Wealthier individuals often hold assets like real estate, equities, or commodities that appreciate with inflation, while poorer households rely on cash incomes and savings that lose value. As a result, the gap between rich and poor widens, leading to social tension and dissatisfaction.
13. Decline in Consumer Confidence
When inflation remains high, consumer confidence weakens. People become cautious, postpone discretionary spending, and focus only on essentials. Reduced consumption affects business revenues, slows economic growth, and increases the risk of stagflation—a situation where high inflation coexists with low growth.
14. Impact on Financial Markets
Inflation uncertainty creates volatility in financial markets. Equity markets struggle as higher interest rates reduce corporate earnings valuations. Bond prices fall as yields rise. Investors constantly rebalance portfolios to hedge against inflation, often favoring commodities, gold, or inflation-protected assets, which further shifts capital flows.
15. Long-Term Economic Damage
If the inflation nightmare continues unchecked, it can cause long-term economic damage. Investment slows, productivity growth weakens, and innovation suffers. Economic planning becomes difficult for both households and businesses, reducing overall efficiency and confidence in the system.
16. Psychological and Social Stress
Beyond economics, inflation creates psychological stress. Constant worry about rising expenses affects mental health, family stability, and social harmony. Public frustration often manifests in protests, political pressure, and demands for policy changes, increasing social instability.
17. The Road Ahead
Ending the inflation nightmare requires coordinated efforts. Structural reforms, supply-side improvements, stable monetary policy, fiscal discipline, and global cooperation are essential. Short-term relief measures must be balanced with long-term solutions to ensure sustainable price stability without sacrificing growth.
18. Conclusion
The continuation of the inflation nightmare is one of the most pressing challenges facing modern economies. It affects every layer of society—from households and businesses to governments and financial markets. Persistent inflation erodes purchasing power, fuels inequality, distorts investment decisions, and creates policy dilemmas. Addressing it requires patience, credibility, and well-coordinated economic strategies. Until inflation is firmly under control, the nightmare remains far from over.

Index Rebalancing Impact 1. What Is Index Rebalancing?
An index is a benchmark that tracks the performance of a selected group of securities, such as the Nifty 50, Sensex, S&P 500, or MSCI indices. Each index follows predefined rules regarding:
Number of constituents
Eligibility criteria (market capitalization, liquidity, free float)
Weighting methodology (market-cap weighted, equal-weighted, factor-based)
Index rebalancing occurs at regular intervals—quarterly, semi-annually, or annually—when the index provider reviews and updates its constituents and weights. Stocks may be added, removed, or reweighted based on changes in market capitalization, liquidity, corporate actions, or methodology updates.
2. Why Index Rebalancing Is Necessary
Markets are dynamic. Company valuations, liquidity profiles, and business fundamentals change over time. Without rebalancing, an index could become outdated or misrepresentative. Rebalancing ensures:
The index remains aligned with its objective
Accurate representation of the market or sector
Consistency and credibility for benchmark users
For example, if a fast-growing company’s market cap increases significantly, its index weight must rise. Conversely, declining or illiquid companies may be removed.
3. Role of Passive Investing in Rebalancing Impact
The rise of passive investing has dramatically increased the importance of index rebalancing. Exchange-Traded Funds (ETFs), index mutual funds, and pension funds replicate indices mechanically. When an index changes, these funds must buy or sell stocks to match the new composition—regardless of price or fundamentals.
This forced buying and selling creates predictable demand and supply shocks, leading to:
Sudden price movements
Volume spikes
Temporary mispricing
As passive assets grow, rebalancing effects have become stronger and more visible.
4. Impact on Stock Prices
a) Stocks Added to an Index
When a stock is added:
Passive funds must buy the stock
Demand increases sharply
Prices often rise before and on the rebalancing date
This phenomenon is known as the “index inclusion effect.” In many cases, the price rally begins after the announcement and peaks near the effective date.
b) Stocks Removed from an Index
When a stock is removed:
Passive funds are forced sellers
Supply increases suddenly
Prices often decline
This is referred to as the “index exclusion effect.” The negative impact may persist for some time due to reduced visibility and lower institutional ownership.
5. Liquidity and Volume Effects
Index rebalancing days are among the highest-volume trading sessions in markets. Key impacts include:
Sharp increase in traded volumes
Higher market depth in index-heavy stocks
Temporary liquidity stress in smaller stocks
Large-cap stocks usually absorb flows smoothly, while mid-cap and small-cap stocks may experience exaggerated price moves due to thinner liquidity.
6. Volatility During Rebalancing
Rebalancing can increase short-term volatility, especially:
Near the closing session on the effective date
In stocks with large weight changes
In indices with high passive ownership
Intraday price swings, large block trades, and closing-auction imbalances are common. However, this volatility is usually event-driven and short-lived, not necessarily a reflection of fundamental risk.
7. Impact on Index Weights and Sector Allocation
Rebalancing does not only change individual stocks—it also affects sectoral exposure. For example:
Higher weight to IT or banking if those sectors outperform
Reduced weight to underperforming sectors
This has a cascading effect:
Sector ETFs must rebalance
Portfolio asset allocation changes
Relative sector performance may shift temporarily
8. Effects on Active Investors and Traders
a) Arbitrage Opportunities
Active traders often try to profit from predictable rebalancing flows:
Buying stocks expected to be added
Short-selling stocks likely to be removed
However, these strategies are competitive and require precise timing, cost control, and liquidity management.
b) Tracking Error Considerations
Active funds benchmarked to indices must manage tracking error. Sudden index changes can:
Increase deviation from benchmark
Force portfolio realignment
Impact short-term performance metrics
9. Long-Term Fundamental Impact
A key debate is whether index rebalancing has lasting fundamental effects. Research suggests:
Short-term price impact is strong
Long-term impact is mixed
Inclusion can improve:
Analyst coverage
Institutional ownership
Corporate visibility
However, it does not automatically improve business fundamentals. Over time, stock prices tend to realign with earnings, growth, and balance-sheet strength.
10. Market Efficiency and Criticism
Index rebalancing has raised concerns about market efficiency:
Prices move due to flows, not fundamentals
Passive investing may amplify bubbles
Overcrowding in index heavyweights
Critics argue that excessive index concentration can distort capital allocation. Supporters counter that rebalancing improves transparency, discipline, and cost efficiency for investors.
11. Indian Market Perspective
In India, index rebalancing of Nifty 50, Nifty Bank, Nifty Next 50, Sensex, and MSCI India has significant impact due to:
Rising ETF and FPI participation
Increasing passive AUM
Lower liquidity in mid-cap stocks
MSCI rebalancing, in particular, attracts large foreign flows and often causes sharp price and volume changes in affected stocks.
12. How Investors Should Approach Rebalancing Events
Long-term investors should avoid emotional reactions and focus on fundamentals
Short-term traders should be cautious of volatility and execution risks
Portfolio managers should plan transitions early to reduce market impact
Understanding announcement dates, effective dates, and expected flows is crucial.
13. Conclusion
Index rebalancing is far more than a technical adjustment—it is a powerful market-moving event. Driven by the growth of passive investing, rebalancing influences prices, liquidity, volatility, and investor behavior across global and Indian markets. While the immediate impact is often mechanical and temporary, the broader implications for market structure, efficiency, and capital allocation are profound.
For anyone active in financial markets, understanding index rebalancing is no longer optional—it is essential for informed decision-making, risk management, and opportunity identification.

BTC/USD 1 Day Time Frame Live intraday BTC/USD price (1‑day timeframe): ~$90,368 USD (with a high near ~$92,705 and low near ~$89,560 today) — updated in real‑time.
Real‑time exchange aggregator sites also show similar live ranges:
• BTC ranges roughly $89,500 – $92,700 (24h low/high) on major exchanges.
• Live price data from CoinMarketCap & CoinGecko shows ~$90,100 – $92,300 in recent pricing.
📊 Daily (1D) Key Levels — BTC/USD
Support Levels (bullish buffers where price may bounce):
S1: ~$90,200 – $90,300 — near current trading zone and pivot support.
S2: ~$87,600 – $88,000 — secondary support zone from recent range structure.
S3: ~$85,500 – $86,000 — stronger support if sellers push deeper.
Resistance Levels (sell pressure zones / breakout targets):
R1: ~$94,800 – $95,000 — first upside resistance from pivot targets.
R2: ~$97,000 – $97,500 — medium‑term resistance from recent range highs.
Psychological / higher area: ~$100,000 round number. Traders watch this as a big breakout level if BTC climbs above R2. (Observed market behavior)
📈 Daily Price Range (Current 24h)
Approximate intraday price band:
Low: ~$89,500
High: ~$92,700
This defines today’s 1‑day candle range — useful for intraday support/resistance decisions.

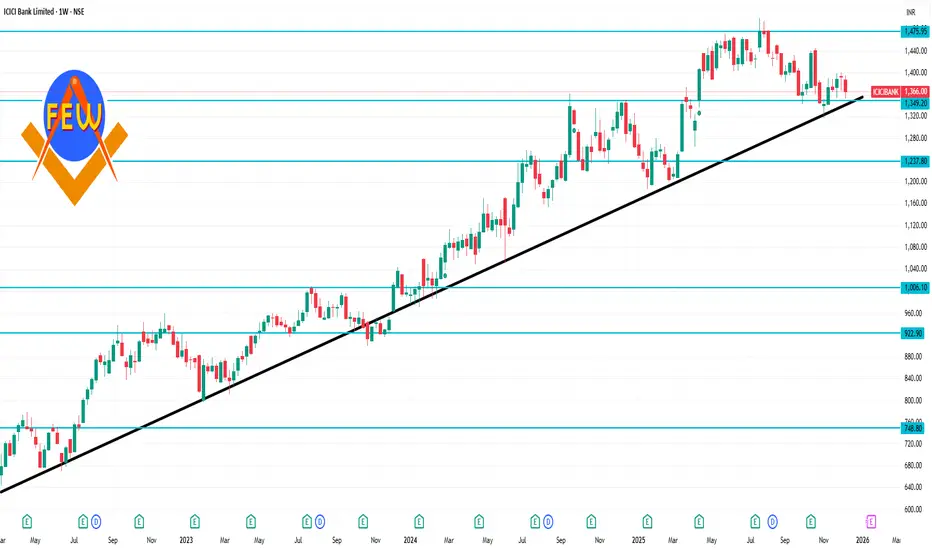
ICICIBANK 1 Week Time Frame 📌 Current Price Snapshot
ICICIBANK ~ ₹1,366 – ₹1,390 (approx) on NSE (recent trading range).
📈 Weekly Pivot Levels (Key Levels for the Week)
(These are calculated using the previous week’s high, low, and close)
Level Type Value
Weekly Pivot (CP) ₹1,337
Weekly Resistance 1 (R1) ₹1,357
Weekly Resistance 2 (R2) ₹1,371
Weekly Resistance 3 (R3) ₹1,391
Weekly Support 1 (S1) ₹1,323
Weekly Support 2 (S2) ₹1,303
Weekly Support 3 (S3) ₹1,289
Central Pivot Range (CPR):
Top CPR: ₹1,340
Bottom CPR: ₹1,334
(CPR is often a good intraday/weekly trend indicator: above CPR = bullish, below = bearish)
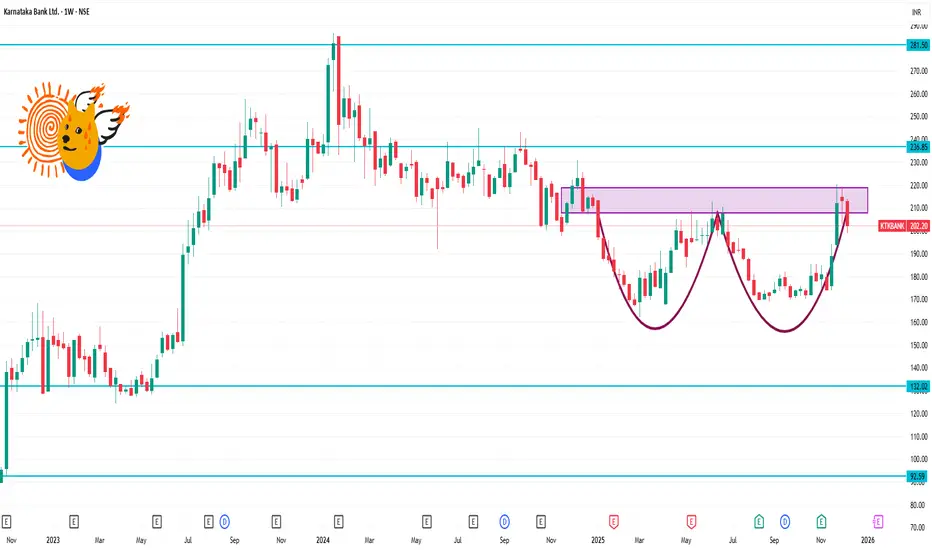
KTKBANK 1 Week Time Frame 📊 Weekly Time-Frame Levels (Support & Resistance)
🔁 Current Context (Price ~ ₹200-₹205 area)
Latest share price is around ₹202-₹206 on NSE.
🛑 Resistance Zones
₹205–₹208 – Near weekly pivot resistance/short-term supply zone
₹210–₹214 – Major horizontal resistance from recent price action
₹220–₹225+ – Next higher resistance cluster / previous swing area
(Break above ₹214/₹220 could signal further strength)
🟩 Support Zones
₹196–₹200 – Immediate weekly support zone
₹188–₹192 – Stronger weekly support (near prior consolidation lows)
₹180–₹185 – Key level if broader pullback continues
(Break below ₹188 could accelerate declines)
Part 1 Candle Stick Patterns How Traders Use Options
a. Directional Trading
Buying call/put based on expected movement.
Example:
If NIFTY is bullish → Buy Call
If NIFTY is bearish → Buy Put
b. Non-Directional Trading
Option sellers earn money when the market stays in a range.
c. Breakout Trading
Buy options during breakout of support/resistance.
d. Hedging
Long-term investors buy puts to protect portfolios.

Financial Market Types: A Comprehensive Overview1. Capital Markets
Capital markets are financial markets where long-term securities with maturities of more than one year are traded. These markets are crucial for raising funds for long-term investments in projects, infrastructure, and corporate expansion. Capital markets are broadly divided into primary markets and secondary markets.
a. Primary Market
The primary market is also known as the new issue market. In this market, companies and governments raise funds by issuing new securities. Investors purchase these securities directly from the issuer, and the funds raised are utilized for capital expenditure, research and development, or expansion projects. The most common instruments in the primary market include:
Equity shares: Stocks issued by companies to raise ownership capital.
Bonds: Debt instruments issued by corporations or governments.
Debentures and preference shares: Long-term financial instruments that provide fixed income to investors.
The primary market plays a crucial role in facilitating economic growth by channeling savings into productive investments.
b. Secondary Market
Once securities are issued in the primary market, they are traded in the secondary market, also called the stock market. Investors buy and sell existing securities, creating liquidity and price discovery. The secondary market ensures that investors can convert their holdings into cash easily. Prominent examples include:
Stock exchanges: Organized exchanges like the New York Stock Exchange (NYSE), NASDAQ, and National Stock Exchange (NSE) in India.
Over-the-counter (OTC) markets: Decentralized markets where securities are traded directly between parties without an organized exchange.
The secondary market’s efficiency affects the attractiveness of primary market investments, as investors consider the ease of exit before investing.
2. Money Markets
The money market is a segment of the financial market that deals with short-term debt instruments, typically with maturities of less than one year. This market facilitates liquidity management for governments, banks, and corporations. It is considered low-risk and is essential for meeting short-term funding requirements. Key instruments include:
Treasury bills (T-bills): Short-term government securities with maturities ranging from a few days to one year.
Commercial paper (CP): Unsecured short-term debt issued by corporations to meet working capital needs.
Certificates of deposit (CDs): Time deposits issued by banks that offer fixed interest rates.
Repurchase agreements (Repos): Short-term loans backed by securities as collateral.
Money markets are critical for ensuring financial stability, providing a mechanism for central banks to control liquidity and interest rates.
3. Foreign Exchange Markets (Forex)
The foreign exchange market is where currencies are traded. It is the largest financial market in the world, operating 24 hours a day, and plays a vital role in facilitating international trade and investment. Participants include banks, multinational corporations, hedge funds, and individual investors. Major functions include:
Currency conversion: Facilitating global trade by allowing the exchange of one currency for another.
Hedging foreign exchange risk: Protecting businesses and investors from currency fluctuations using forward contracts, options, and swaps.
Speculation: Traders attempt to profit from changes in exchange rates.
The forex market is highly liquid, decentralized, and influenced by economic policies, geopolitical events, and interest rate differentials.
4. Derivatives Markets
Derivatives are financial instruments whose value is derived from an underlying asset, such as stocks, bonds, commodities, currencies, or indices. Derivatives markets provide mechanisms for hedging, speculation, and arbitrage. The two main categories are:
Futures and Forwards: Contracts obligating the purchase or sale of an asset at a predetermined price on a specific future date. Futures are standardized and traded on exchanges, while forwards are customized OTC contracts.
Options: Contracts giving the buyer the right, but not the obligation, to buy or sell an asset at a predetermined price before a specific date.
Swaps: Agreements to exchange cash flows or financial instruments, commonly used for interest rate or currency risk management.
Derivatives markets are critical for risk management in modern financial systems. They allow companies to lock in prices and manage exposure to fluctuating markets.
5. Commodity Markets
Commodity markets are platforms for trading raw materials or primary products. These markets facilitate price discovery, hedging against price volatility, and investment opportunities. They are divided into:
Physical markets: Commodities are bought and sold in tangible form, such as agricultural produce, metals, and energy resources.
Futures markets: Standardized contracts for future delivery of commodities, allowing producers and consumers to hedge against price changes.
Major commodities include gold, silver, crude oil, wheat, and natural gas. Commodity markets are sensitive to supply-demand dynamics, geopolitical events, and global economic trends.
6. Cryptocurrency and Digital Asset Markets
With technological advancement, digital assets like cryptocurrencies, non-fungible tokens (NFTs), and blockchain-based securities have emerged. These markets operate on decentralized platforms, allowing peer-to-peer trading. Key features include:
High volatility: Digital assets can experience rapid price movements.
Decentralization: Transactions are conducted without intermediaries through blockchain technology.
Innovation and adoption: Cryptocurrencies offer alternative investment options and new financial services such as decentralized finance (DeFi).
Though relatively new, cryptocurrency markets are increasingly integrated into traditional financial systems.
7. Bond Markets
Bond markets, also known as debt markets, are segments where fixed-income securities are issued and traded. Governments, municipalities, and corporations issue bonds to finance projects. Types of bonds include:
Government bonds: Considered low-risk and issued by national governments.
Corporate bonds: Issued by companies to raise capital; riskier than government bonds.
Municipal bonds: Issued by local authorities to fund public projects.
Bond markets are critical for long-term financing and provide a stable investment option for risk-averse investors.
8. Over-the-Counter (OTC) Markets
OTC markets are decentralized markets where trading occurs directly between two parties without a formal exchange. They handle securities, derivatives, and currencies. OTC markets are flexible, allowing customized contracts, but they carry higher counterparty risk. OTC trading is essential for assets not listed on exchanges and for large institutional transactions.
9. Interbank Markets
Interbank markets are specialized markets where banks lend to and borrow from one another to manage liquidity. They play a vital role in money market operations and interest rate determination. Instruments traded include overnight loans, certificates of deposit, and foreign exchange swaps. Interbank markets are crucial for banking stability and smooth functioning of the financial system.
10. Emerging Markets
Emerging financial markets refer to rapidly developing economies that are integrating into the global financial system. They offer higher growth potential but carry higher risk due to political, economic, and currency uncertainties. Examples include India, Brazil, and South Africa. These markets include equities, bonds, derivatives, and currency trading and attract both domestic and foreign investors.
Conclusion
Financial markets are the backbone of modern economies, facilitating capital allocation, liquidity, risk management, and economic growth. They range from traditional equity, debt, and money markets to advanced derivative, forex, commodity, and digital asset markets. Each type of market serves a unique function, caters to different participants, and operates under specific regulatory frameworks. By understanding the structure and role of these markets, investors can make informed decisions, companies can access necessary capital, and policymakers can maintain economic stability.
Financial markets continue to evolve with technology, globalization, and innovation. The integration of digital platforms, algorithmic trading, and decentralized finance is transforming traditional market mechanisms, making financial markets more accessible, efficient, and dynamic. For participants, comprehending the diversity and nuances of financial markets is essential to navigate opportunities and risks effectively.

Investing in Shares: A Comprehensive Overview1. Understanding Shares
Shares, also called stocks or equities, are financial instruments that represent ownership in a corporation. Each share entitles the holder to a fraction of the company's profits, typically distributed as dividends, and gives them voting rights in certain corporate decisions, depending on the type of share held. Shares are issued by companies to raise capital for business expansion, research, or debt repayment. In return, investors hope to earn returns through price appreciation and dividends.
There are two primary types of shares:
Common Shares: These represent ordinary ownership. Shareholders have voting rights and may receive dividends, but they are last in line to claim company assets in case of liquidation.
Preferred Shares: These provide a fixed dividend and have a higher claim on assets than common shares. However, preferred shareholders usually lack voting rights.
2. Why Invest in Shares
Investing in shares can offer several benefits:
Potential for Capital Growth: Shares have the potential to appreciate in value over time, allowing investors to sell them at a higher price than the purchase price.
Dividend Income: Companies often distribute a portion of profits as dividends, providing a steady income stream.
Ownership in a Company: Shareholders have a stake in the company, including the right to vote on major corporate matters.
Hedge Against Inflation: Historically, equities have outperformed inflation, helping preserve the purchasing power of money.
Liquidity: Shares traded on stock exchanges can be bought and sold easily, offering high liquidity compared to other investments like real estate.
3. How Share Prices Are Determined
The price of a share is influenced by a combination of factors:
Company Performance: Profits, revenue growth, and business strategies directly impact investor perception and share price.
Market Sentiment: Investors’ collective emotions, confidence, and speculation can drive prices up or down.
Economic Indicators: Interest rates, inflation, and GDP growth affect share valuations.
Industry Trends: Changes in technology, consumer preferences, and competition influence sector performance.
Global Events: Political instability, trade wars, and global economic conditions can significantly impact share prices.
4. Methods of Investing in Shares
There are different ways to invest in shares, depending on risk tolerance, knowledge, and financial goals:
Direct Investment: Purchasing shares of individual companies through stock exchanges using a brokerage account. Investors need to research companies, analyze financials, and monitor market trends.
Mutual Funds: Equity mutual funds pool money from multiple investors to invest in a diversified portfolio of shares. This reduces risk compared to investing in a single stock.
Exchange-Traded Funds (ETFs): ETFs track the performance of an index or sector and can be traded like individual shares. They offer diversification and low cost.
Dividend Reinvestment Plans (DRIPs): Investors reinvest dividends to purchase more shares, enabling compounding growth over time.
Systematic Investment Plans (SIPs): Investing fixed amounts periodically in equity mutual funds to benefit from rupee cost averaging.
5. Analyzing Shares
Before investing, it is crucial to analyze shares using two main approaches:
Fundamental Analysis: This involves evaluating a company’s financial statements, revenue growth, profit margins, debt levels, management quality, and industry position. Key metrics include Price-to-Earnings (P/E) ratio, Earnings Per Share (EPS), Return on Equity (ROE), and dividend yield. Fundamental analysis helps investors determine a company’s intrinsic value and decide whether the stock is overvalued or undervalued.
Technical Analysis: This focuses on historical price movements, trading volumes, and chart patterns to predict future price trends. Tools like moving averages, support and resistance levels, and momentum indicators are commonly used by traders. Technical analysis is particularly popular for short-term trading strategies.
6. Risk and Reward in Share Investing
Investing in shares involves a trade-off between risk and reward:
Market Risk: Stock prices can fluctuate due to overall market movements or economic conditions.
Company-Specific Risk: Poor management, product failures, or regulatory issues can negatively impact a company’s stock.
Liquidity Risk: Some stocks may be difficult to sell quickly without affecting the price.
Volatility: Share prices can experience rapid ups and downs, especially in emerging markets or high-growth sectors.
Mitigating Risk: Diversification, long-term investment horizons, and informed decision-making reduce risk exposure.
The potential for high returns is higher than traditional investments like fixed deposits or bonds, but so is the risk. Historical data suggests that equities outperform most asset classes over long periods, making them suitable for wealth creation.
7. Strategies for Share Investing
Successful investors adopt strategies based on goals and risk appetite:
Buy and Hold: Investors purchase quality stocks and hold them long-term to benefit from compounding and price appreciation.
Value Investing: Investing in undervalued stocks based on fundamental analysis, a strategy popularized by Warren Buffett.
Growth Investing: Focusing on companies with high growth potential, even if they appear expensive, expecting significant capital appreciation.
Dividend Investing: Prioritizing shares with consistent and high dividend payouts for stable income.
Swing Trading: Short- to medium-term trading based on technical patterns to profit from price fluctuations.
Index Investing: Investing in market indices via ETFs or index funds to replicate overall market performance with minimal effort.
8. The Role of Psychology in Share Investing
Behavioral finance highlights that emotions influence investment decisions. Common psychological pitfalls include:
Herd Mentality: Following the crowd without independent analysis.
Overconfidence: Overestimating one's knowledge or market predictions.
Fear and Greed: Emotional reactions during market volatility can lead to panic selling or excessive risk-taking.
Loss Aversion: Reluctance to sell underperforming stocks, which can magnify losses.
Successful investors maintain discipline, set clear investment goals, and stick to their strategy regardless of short-term market noise.
9. Taxation and Regulatory Considerations
Investing in shares is subject to taxation and regulatory compliance:
Capital Gains Tax: Profits from selling shares may attract short-term or long-term capital gains tax depending on the holding period.
Dividend Distribution Tax: Dividends received are taxed in some jurisdictions.
Regulations: Stock markets are regulated by government authorities (like SEBI in India) to ensure transparency, prevent fraud, and protect investors.
Awareness of these factors helps investors plan their investments efficiently.
10. Conclusion
Investing in shares is both an art and a science, blending financial analysis, market understanding, and behavioral discipline. It offers the potential to grow wealth, generate income, and participate in the growth story of companies. However, it requires knowledge, patience, and risk management. Investors should conduct thorough research, diversify portfolios, and remain focused on long-term objectives to navigate market volatility successfully.
By understanding the fundamentals, adopting effective strategies, and maintaining emotional discipline, investing in shares can become a powerful tool for achieving financial freedom and building lasting wealth. In a world where economic growth is increasingly linked to corporate success, shares remain one of the most accessible and rewarding avenues for individual investors to participate in that growth journey.

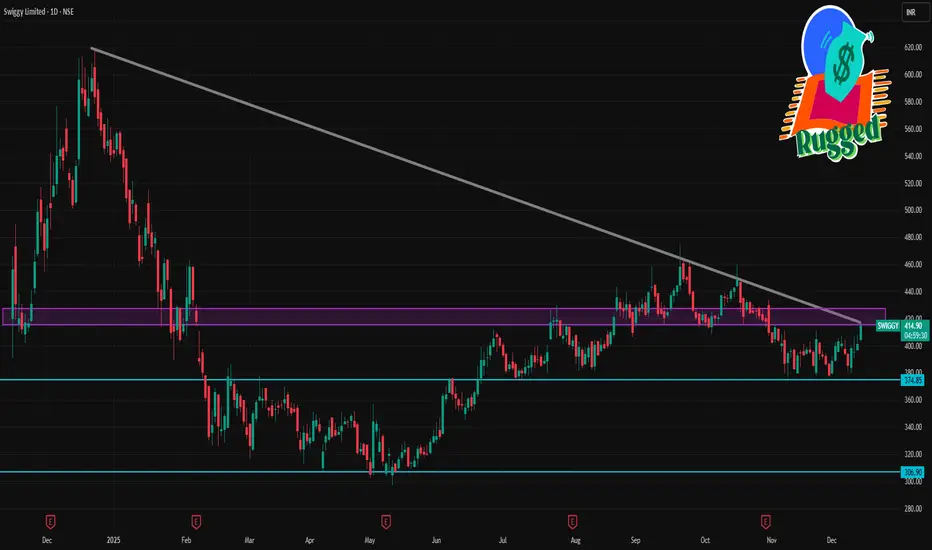
SWIGGY 1 Day Time Frame 📈 Latest Price Context (Today’s Trading)
📍 Approx Live Price: ~₹401 INR on NSE during today’s session with intraday swings between ~₹396 and ₹408.
📊 Daily Support & Resistance Levels (1-Day Chart)
🔹 Key Resistance
R1: ~₹404–₹406 — first resistance from intraday pivot/octave levels.
R2: ~₹409–₹414 — next resistance zone.
R3: ~₹420+ — extended weekly resistance.
🔸 Key Support
S1: ~₹388–₹390 — immediate support area.
S2: ~₹380–₹383 — secondary support closer to recent intraday lows.
S3: ~₹371–₹375 — deeper support if prices break down sharply.
🔁 Pivot
Daily Pivot Point: ~₹397–₹398 zone.
This pivot acts as the centerline bias — above it suggests bullish lean today, below it suggests selling pressure today.
Part 9 Trading Master Class With ExpertsRisks in Option Trading Strategies
Options offer flexibility, but risks vary.
1 Premium Decay
Option buyers lose premium rapidly as expiry approaches.
2 Volatility Crush
IV drops after major events → huge loss for long straddle/strangle buyers.
3 Assignment Risk
Short options may be assigned early in American-style options.
4 Unlimited Loss Potential
Selling naked options exposes traders to large losses.

Part 3 Learn Institutional Trading Why Do People Trade Options?
Traders use options for three main reasons:
a) Hedging
To protect their portfolios from losses.
Example: If you own shares and fear a price drop, you can buy put options to act as insurance.
b) Speculation
To profit from price movements using small capital.
Options allow traders to control large positions for a fraction of the cost.
c) Income Generation
By selling options, traders can earn premium income regularly.

Weekly vs Monthly Options Trading1. Understanding Weekly and Monthly Options
Monthly Options
Also known as standard expiry options.
These options expire on the last Thursday of every month in markets like India (NSE).
They have been around since the inception of exchange-traded options.
Provide a longer duration of time value and stable premium structure.
Weekly Options
Introduced to provide short-term trading opportunities.
These options expire every Thursday (except monthly expiry week).
Much shorter lifespan—often just 5–7 days.
Popular in instruments like Nifty, Bank Nifty, FinNifty, and stocks (limited list).
2. Time Value & Theta Decay
One of the most important differences between weekly and monthly options is theta decay—the rate at which option premium loses value as expiry approaches.
Monthly Options
Have slower theta decay in the early weeks.
Premium erodes gradually.
Most decay accelerates in the last 7–10 days before expiry.
Suitable for swing and positional option selling.
Weekly Options
Have very fast theta decay.
Premium can melt drastically 2–3 days before expiry or even intraday.
Perfect for intraday and short swing theta-based strategies.
But risky for buyers since rapid decay eats premium quickly.
In short:
Sellers benefit more from weeklies due to rapid premium erosion.
Buyers must time entries well or risk losing premium quickly.
3. Liquidity & Bid–Ask Spreads
Monthly Options
Generally deep liquidity, especially in indices like Nifty.
Bid–ask spreads are narrower.
Easy to place big orders.
Weekly Options
Liquidity varies by strike.
ATM and near strikes have excellent liquidity in Nifty & Bank Nifty.
But far OTM strikes or stock weeklies may have wider spreads.
Bottom line:
Weekly options = high liquidity in popular indices.
Monthly options = stable liquidity across many strikes.
4. Volatility Impact (Vega)
Monthly Options
Higher vega.
More sensitive to changes in implied volatility (IV).
Good for volatility-based strategies like straddles, strangles, long vega positions, calendar spreads.
Weekly Options
Lower vega.
Less sensitive to IV unless close to events like results or macro announcements.
Therefore:
If you want to trade volatility → choose monthly options.
If you want to trade quick moves/time decay → choose weekly options.
5. Cost & Premium Differences
Monthly Options
Higher premiums because more time value exists.
Suitable for:
Hedging
Swing options buying
Calendar spreads
Position building
Weekly Options
Much cheaper premiums due to short life.
Allows:
Quick scalping
Event-specific trading
Intraday buying and selling
But sharp moves can wipe out premiums fast.
For buyers:
Monthly = safer, but slower.
Weekly = cheaper, but high risk.
6. Risk Differences
Risk in Weekly Options
Very high for buyers due to theta decay.
High for sellers during volatile sessions.
Strikes can become worthless within minutes near expiry.
Very sensitive to intraday big moves (gamma risk).
Risk in Monthly Options
More stable, controlled decay.
Better for hedged strategies.
Lower intraday gamma exposure.
Gamma exposure:
Weekly > Monthly
Means weekly options react faster to price moves: good for directional traders, dangerous for late sellers.
7. Which Is Better for Option Buyers?
Monthly Options
Better for buyers because:
More time for the trade to work.
Slower premium decay.
Good for swing/positional directional trades.
Weekly Options
Useful only when:
You expect a sharp, fast move (e.g., news, breakout, expiry day momentum).
Intraday or same-day scalping.
General rule:
Buyers prefer monthly options.
Experienced intraday traders may buy weeklies for quick momentum.
8. Which Is Better for Option Sellers?
Weekly Options
Best tool for sellers.
Rapid theta decay = high edge.
Ideal for:
Short straddles/strangles
Credit spreads
Iron condors
Intraday selling
Expiry day option selling
Monthly Options
Used for safe, hedged, non-aggressive selling.
Good for:
Covered calls
Calendar spreads
Iron condors
Protected strangles
General rule:
Sellers prefer weekly for profit.
Monthly for stability and lower risk.
9. Event Trading: Weekly vs Monthly
Weekly Options
Used for:
RBI policy
Fed minutes
Budget week
Elections
Major results (if available on the stock)
Global announcements
Because weeklies allow cheap premia and controlled exposure for short periods.
Monthly Options
Used for:
Longer-term swing trading around events.
Volatility build-up strategies.
Protecting long-term portfolios.
10. Strategies Suitable for Each
✔ Weekly Options: Best Strategies
Intraday scalping (ATM options)
Expiry day straddle/strangle selling
Credit spreads for quick decay
Ratio spreads
Iron flies (expiry week)
Short gamma strategies
✔ Monthly Options: Best Strategies
Long calls/puts (positional)
Calendar spreads (monthly vs weekly)
Diagonal spreads
Covered calls
Vertical debit spreads
Condors for stable markets
11. Who Should Trade What?
Weekly Options – Ideal for
Experienced intraday traders
Scalpers
Option sellers
Short-term event traders
High-risk traders
Monthly Options – Ideal for
Beginners
Positional traders
Swing traders
Hedgers
Risk-averse participants
12. Pros & Cons Summary
Weekly Options
Pros
Fast returns
Low premium
Ideal for intraday/expiry
High theta decay
Great for sellers
Cons
Very risky for buyers
Sudden losses during volatility
Requires precision timing
Higher gamma risk
Monthly Options
Pros
More stable
Less risky
Longer time value
Suitable for swing buyers
Good for hedging
Cons
Slower returns
Higher capital for sellers
Less excitement compared to weeklies
Final Conclusion
Weekly and monthly options serve different purposes. Weekly options provide speed, volatility, and rapid theta decay, making them ideal for advanced traders, especially sellers and intraday scalpers. Monthly options provide stability, safer premiums, and slower decay, making them suitable for swing traders, beginners, and long-term strategists.
A trader can use both depending on goals:
Weekly for tactical short-term trades.
Monthly for strategic long-term positioning.
PCR Trading Strategies Option Buyers vs. Option Sellers
Option Buyers
Limited loss (only premium paid)
Unlimited profit potential
Higher risk of loss due to time decay
Good for small capital traders
Option Sellers (Writers)
Limited profit (premium received)
Potentially unlimited loss
Benefit from time decay
Requires high margin and experience
Example:
A seller who sells Nifty 22,500 CE for ₹100 receives ₹100 premium.
If Nifty stays below 22,500, the seller keeps the entire premium.

Part 1 Candle Stick Patterns What Is an Option?
An option is a contract between a buyer and a seller.
The buyer pays a premium to purchase the right.
The seller receives the premium and takes on the obligation.
Every option contract has:
Strike Price – the predetermined price for buying or selling the asset
Expiry Date – the date on which the option contract ends
Premium – the cost of the option
Lot Size – fixed quantity of the underlying asset
Understanding these fundamentals is crucial before diving into live trading.

Building a Trader’s Mindset: Patience, Consistency, Adaptability1. Patience – The Foundation of Professional Trading
Patience is not simply “waiting.” It is disciplined inaction until the right opportunity forms. Impatient traders overtrade, chase moves, react emotionally, and burn capital. Patient traders act only when their edge is present.
Why Patience Matters
Markets are mostly noise. True high-probability setups appear occasionally. A patient trader understands that success comes from waiting for conditions that match their plan. The goal is not to trade more, but to trade better.
Forms of Patience in Trading
Waiting for the right setup
You may scan 50 charts and take only one trade. Professional traders understand that most days are not meant for big profits.
Patience in entry execution
Many traders jump early due to fear of missing out (FOMO). But waiting for confirmation, retests, or volatility cooling often determines whether a trade becomes a winner.
Patience in holding a winning trade
Most traders cut winners early. Patience helps you let the trend unfold and ride profits instead of booking small gains.
Patience during drawdowns
A losing streak is temporary, but the emotional urge to “make back losses fast” destroys accounts. Patience helps you reset mentally.
How to Develop Patience
Trade fewer setups but master them deeply.
Use alerts, so you don’t watch charts constantly.
Define your conditions clearly: “I enter only if X, Y, and Z align.”
Practice delayed gratification—a psychological muscle built over time.
Reward process, not outcome—celebrate discipline, not luck.
Patience builds emotional stability, which becomes the core of all other trading skills.
2. Consistency – The Engine That Drives Growth
Consistency is the ability to follow your process repeatedly—same logic, same rules, same risk control—every single day. A consistent trader becomes predictable to themselves, which makes performance measurable and improvable.
Most traders fail not because their strategy is bad but because they apply it inconsistently.
Why Consistency Matters
Markets produce random short-term outcomes. A strategy may win today and lose tomorrow. Consistency ensures that over time your edge plays out. Without consistency:
Risk fluctuates and results become unpredictable.
Emotions dominate decision-making.
You cannot improve because you don’t know what you did right or wrong.
Your trading becomes luck-based rather than skill-based.
Pillars of Consistency
1. A Clear Trading Plan
A plan defines:
Entry rules
Exit rules
Stop-loss and target criteria
Position size
Market conditions you trade
Without a plan, consistency is impossible.
2. Risk Management Discipline
Risk per trade should remain consistent—usually 1–2% of capital. Changing risk based on emotion leads to uneven results.
3. Time and Routine Consistency
Professional traders have fixed routines:
Pre-market preparation
Chart review
Journaling
Performance tracking
Routine eliminates randomness in behavior.
4. Consistent Emotional Regulation
Traders must behave consistently regardless of:
A big win
A big loss
A news event
A volatile session
This detaches performance from temporary emotional states.
How to Build Consistency
Journal every trade—entry, reason, emotions, outcome.
Review weekly—identify patterns of mistakes.
Automate repetitive tasks—alerts, screeners, watchlists.
Reduce strategy hopping—stick to one system for a long enough sample size.
Focus on incremental improvement, not perfection.
Consistency turns trading into a process-driven profession instead of a gambling activity.
3. Adaptability – Surviving and Thriving in Changing Markets
Markets evolve constantly. What worked in a trending market may fail in a sideways one. Adaptability enables a trader to evolve with conditions, update strategies, and stay relevant.
Why Adaptability Matters
Volatility changes.
Liquidity shifts.
Macro events impact trends.
Algo trading affects speed and structure.
Investor psychology evolves over time.
Rigid traders get left behind. Flexible traders stay profitable.
Traits of Adaptable Traders
Open-Mindedness
They are willing to test new ideas, adjust position sizes, or explore different timeframes when conditions shift.
Awareness of Market Context
Instead of forcing trades, they ask:
“Is the market trending, ranging, reversing, or consolidating?”
Ability to Evolve Strategies
Adaptable traders update systems using data, not emotion.
Emotional Flexibility
They accept being wrong quickly—cutting losses, not defending ego.
How to Develop Adaptability
Study multiple market environments: trending, range-bound, high/low volatility.
Maintain multiple tools (trend-following, mean-reversion, breakout strategies).
Regularly backtest and forward-test strategies.
Observe global macro events and their impact.
Keep a growth mindset—stay curious and upgrade skills.
Avoid rigid beliefs like “this stock must go up” or “this pattern always works.”
Adaptability is about changing when necessary while staying disciplined to core principles.
How These Three Traits Work Together
Patience + Consistency
Patience helps you avoid bad trades.
Consistency ensures you execute your good trades properly.
Together they create stable performance.
Patience + Adaptability
Patience lets you wait for the market to show its conditions.
Adaptability allows you to adjust once those conditions shift.
Consistency + Adaptability
Consistency provides structure.
Adaptability keeps the structure flexible enough to survive changing environments.
All Three Combined
A trader who masters patience, consistency, and adaptability:
Takes fewer but high-quality trades
Controls emotions
Stays calm during volatility
Maintains steady profits
Learns continuously
Avoids catastrophic losses
Improves year after year
This mindset separates professionals from amateurs.
Practical Daily Exercises to Build This Mindset
1. Pre-Market Exercise
Write down:
What setups you will trade today
What you will avoid
Maximum loss allowed
This reinforces patience and consistency.
2. Mid-Day Emotion Check
Ask:
Am I following my plan?
Am I trading emotionally?
Am I forcing trades?
This keeps behavior aligned.
3. Post-Market Review
Journal:
Trades taken
Mistakes
Improvements
Market conditions
This builds adaptability.
4. Weekly Reset
Analyze:
Win rate
Risk-to-reward
Emotional patterns
Strategy performance in current conditions
This helps you evolve with the market.
Conclusion
Building a trader’s mindset takes time. It requires unlearning impulsive habits, developing emotional intelligence, and aligning your behavior with long-term goals. Patience keeps you selective. Consistency keeps you disciplined. Adaptability keeps you relevant.
Trading is not about predicting the market—it is about managing yourself. When your mindset is strong, your strategy becomes powerful. When your emotions are controlled, your results become stable. Master these three mindset pillars, and your journey shifts from random outcomes to structured, repeatable success.
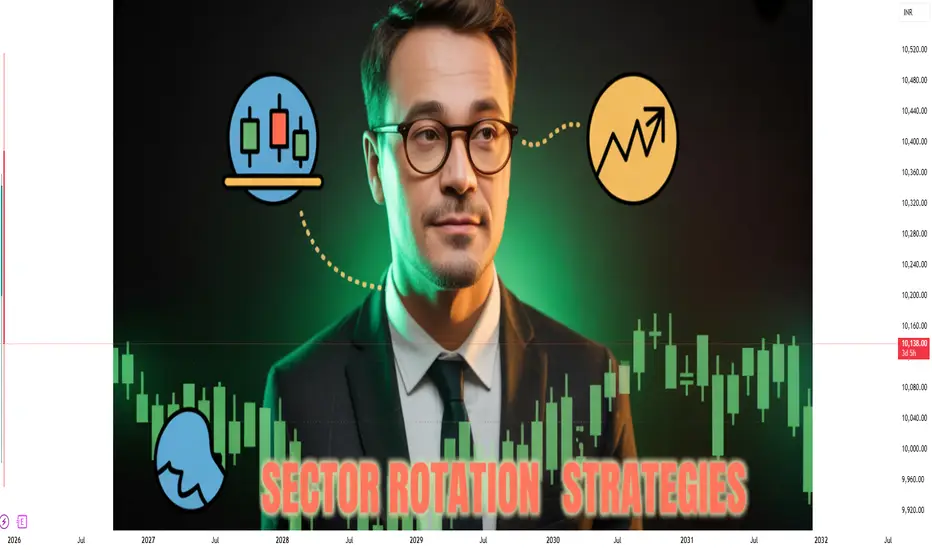
Sector Rotation & Business Cycles1. Understanding the Business Cycle
The business cycle refers to the natural rise and fall of economic activity over time. It moves through four major phases:
1. Expansion
Economic growth accelerates.
Employment rises, consumer spending increases.
Corporate profits improve.
Interest rates usually remain moderate.
2. Peak
Growth reaches its maximum level.
Inflation may rise.
Central banks often raise interest rates to cool the economy.
Consumer demand becomes saturated.
3. Contraction (Recession)
Economic growth slows.
Corporate earnings weaken.
Layoffs and spending cuts occur.
Stock markets often decline.
4. Trough
Economic decline bottoms out.
Stimulus measures increase (rate cuts, government spending).
Businesses prepare for recovery.
This cyclical movement is driven by consumer behavior, credit cycles, government policy, global factors, and investor sentiment. Although the timing of cycles varies, the behavioral patterns remain largely consistent.
2. Sector Rotation Explained
Sector rotation is the strategy of moving investments from one sector to another based on expectations of the next phase of the business cycle. Investors aim to hold sectors that are likely to benefit from the upcoming environment while avoiding those expected to underperform.
For example:
When interest rates fall and the economy is bottoming out, cyclical sectors often lead.
When inflation rises or recession hits, defensive sectors typically protect the portfolio.
There are three broad groups of sectors to understand:
A. Defensive Sectors
These sectors provide essential goods or services, meaning demand stays stable even during downturns.
Healthcare
Utilities
Consumer Staples
Telecom
These sectors outperform during recessions or slowdowns because people cannot stop spending on necessities like electricity, medicine, and basic household products.
B. Cyclical Sectors
These rise when the economy is strong and fall during recessions.
Consumer Discretionary
Industrials
Financials
Real Estate
Materials
Cyclicals react strongly to consumer confidence and corporate investment.
C. Growth & Inflation-Linked Sectors
These benefit from technological progress or commodity price cycles.
Technology (growth)
Energy (inflation-linked)
Basic Materials (linked to global demand)
3. How Sector Rotation Works Across the Cycle
Here is how major sectors tend to perform during each stage of the business cycle:
1. Early Expansion (Recovery Phase)
Economic Conditions:
Interest rates are low
GDP growth rebounds
Employment picks up
Consumer confidence rises
Winning Sectors:
Consumer Discretionary: People begin buying non-essential goods.
Industrials: Companies increase production and investment.
Financials: Banks benefit from loan growth and improving credit conditions.
Real Estate: Lower interest rates push property demand.
This stage sees some of the strongest equity returns because the market anticipates stronger earnings.
2. Mid Expansion (Strong Growth Phase)
Economic Conditions:
GDP grows steadily
Inflation remains moderate
Corporate profits are strong
Markets remain bullish
Winning Sectors:
Technology: Innovation drives growth.
Industrials & Materials: Increased global demand supports manufacturing.
Energy: Higher consumption raises oil and gas prices.
Tech often dominates in this stage because companies invest in efficiency and automation while consumers adopt new technologies.
3. Late Expansion (Peak Phase)
Economic Conditions:
Growth slows
Inflation increases
Interest rates rise
Market volatility rises
Winning Sectors:
Energy: Inflation boosts commodity prices.
Materials: Benefit from strong but peaking demand.
Utilities (start to gain): Investors seek safety as cycle becomes uncertain.
Investors gradually rotate from growth and cyclical sectors toward safety as interest rates tighten.
4. Contraction (Recession Phase)
Economic Conditions:
GDP declines
Unemployment rises
Corporate profits fall
Credit tightens
Winning Sectors:
Consumer Staples: Essential goods maintain stable demand.
Healthcare: Non-discretionary spending continues.
Utilities: Consumption of power and water remains stable.
Telecom: Communication services are essential.
Defensive sectors outperform because they have predictable cash flows and stable earnings. Meanwhile, cyclical sectors suffer.
5. Trough (Bottoming Phase)
Economic Conditions:
Government and central banks stimulate the economy
Interest rates fall sharply
Economic activity stabilizes
Winning Sectors:
Financials (early recovery)
Consumer Discretionary
Industrials
Technology
Investors anticipate recovery and rotate back into risk assets. This phase often produces high returns for early movers.
4. Factors That Influence Sector Rotation
Sector performance isn’t solely dictated by the business cycle. Other factors influence sector rotation timing and effectiveness:
A. Interest Rates
Higher rates hurt financials, real estate, tech.
Lower rates boost cyclicals and growth stocks.
B. Inflation
High inflation benefits energy, materials, commodities.
Low inflation supports growth sectors like tech.
C. Government Policies
Fiscal spending boosts infrastructure, defense, renewables.
Regulations impact banks, pharma, telecom.
D. Market Sentiment
Fear and greed cycles can accelerate sector rotation—money moves quickly out of risk sectors into defensives during panic.
E. Global Economic Trends
Global demand strongly impacts:
Energy
Materials
Industrials
5. Sector Rotation Strategies for Traders and Investors
Here are the commonly used approaches:
A. Business Cycle Forecasting
Predicting the next phase of the economy and positioning the portfolio ahead of time. Requires macro analysis, economic indicators, and market sentiment tracking.
B. Momentum-Based Rotation
Invest in sectors showing strong price performance and exit those losing momentum. Often used with sector ETFs.
C. Defensive vs. Cyclical Switching
Shift between defensive and cyclical baskets depending on economic signals like:
PMI
Interest rate trends
Inflation data
Yield curve behavior
D. Thematic Sector Rotation
Focus on themes like:
EVs
Artificial Intelligence
Renewable energy
Digital infrastructure
This works well when the economy is neutral but trends drive specific sectors.
6. Benefits of Sector Rotation
Higher Returns: Capture outperforming sectors during each cycle.
Lower Risk: Avoid sectors likely to decline during downturns.
Diversification: Helps spread exposure across industries.
Alignment with Macro Trends: Keeps portfolio positioned for economic shifts.
7. Limitations of Sector Rotation
Timing is challenging.
Economic cycles may be unpredictable.
External shocks can disrupt the pattern (wars, pandemics).
Requires continuous monitoring of macro data.
Conclusion
Sector rotation is one of the most strategic and systematic ways to navigate financial markets. By understanding how sectors behave during different stages of the business cycle and by monitoring key economic indicators, traders and investors can optimize returns, manage risks, and stay ahead of economic changes. Mastering this approach requires discipline, macroeconomic awareness, and adaptability. But when applied correctly, sector rotation becomes a powerful tool for long-term growth and short-term tactical opportunities.
Trading Journaling & Performance Tracking1. What Is Trading Journaling?
A trading journal is a structured record of every trade you take. It captures not only the technical details (entry, stop-loss, exit, timeframe, strategy) but also the emotional and psychological conditions during the trade. In simple terms, it is your personal trading diary.
A good trading journal helps you accomplish three critical objectives:
Identify patterns in your winning and losing trades.
Control emotions by documenting psychological triggers.
Improve your strategies through review and data-driven insights.
Whether you are a beginner or an experienced trader, a well-maintained journal is essential because the market constantly changes, but human behavior (your habits) often stays the same—until you correct it with feedback.
2. Why Trading Journaling Matters
a) Builds Discipline
Trading without a journal is like running a business without keeping accounts. You may earn profits occasionally, but you’ll never know what’s really working. Journaling forces you to follow rules and avoid impulsive decisions.
b) Helps You Learn From Mistakes
Most traders repeat the same mistakes—late entries, early exits, overtrading, revenge trading—because they never document them. Journaling exposes these harmful patterns.
c) Improves Strategy Effectiveness
When you review 50 or 100 trades of a single strategy, you can clearly see whether that setup is profitable or needs adjustment.
d) Strengthens Mindset & Emotional Control
By noting your emotional state before and during trades, you learn how emotions like fear, FOMO, greed, and panic affect your performance.
e) Converts Trading Into a Structured Process
Trading becomes predictable, measurable, and therefore improvable. This is the foundation of consistency.
3. What to Include in a Trading Journal
A professional trading journal usually includes the following elements:
1. Trade Details
Date & time
Market/instrument (NIFTY, BankNifty, stocks, forex, crypto)
Position type (long/short)
Timeframe (1D, 1H, 5min, etc.)
Entry and exit price
Stop-loss & target
Position size
2. Strategy Used
Breakout
Pullback
Trend-following
Price Action
Reversal
Indicator-based strategy (RSI, MACD, EMA, etc.)
This helps you track which strategy performs the best.
3. Pre-Trade Reasoning
Why did you take the trade?
What conditions were met?
Was the market trending, choppy, or volatile?
This ensures you are trading based on logic, not emotion.
4. Emotions Before, During, and After the Trade
Mark emotions such as:
Confident
Fearful
Greedy
Hesitant
Excited
Impulsive
This creates emotional awareness.
5. Trade Outcome
Profit or loss
R:R (risk-to-reward ratio)
Whether you followed your plan or not
6. Screenshot of Chart
This visually reinforces your learning.
7. Post-Trade Review
What went right?
What went wrong?
What could be improved?
Did you exit early or late?
Over time, these notes become extremely valuable.
4. Performance Tracking: Measuring Your Progress
While journaling captures trade-by-trade details, performance tracking converts those details into data for analysis.
It measures how well you are performing overall.
Here’s what to track:
1. Win Rate
Percentage of profitable trades.
A high win rate doesn’t always mean profitability—your R:R matters more.
2. Average Risk-to-Reward Ratio
Your average loss vs. your average gain.
A trader with a 40% win rate can still be profitable with a strong R:R.
3. Profit Factor
Total profit divided by total loss.
A profit factor above 1.5 is good; above 2.0 is strong.
4. Maximum Drawdown
Largest equity decline from a peak.
This helps understand your worst trading phase and how to manage risk better.
5. Monthly & Weekly Performance
Track:
Profit/loss
Number of trades
Mistakes made
Market environments
This shows how your performance changes with market conditions.
6. Strategy-wise Performance
Analyze which strategies give the best results:
Breakout strategy win rate
Reversal setups
Indicator combinations
Timeframe performance
Drop strategies that consistently underperform.
7. Psychological Performance
Track recurring emotional challenges:
Overtrading
FOMO entries
Early exits
Fear-based hesitation
You can create an emotion-mistake leaderboard and try to eliminate the top offenders.
5. Tools for Journaling and Tracking
You can use:
1. Excel/Google Sheets
Highly customizable and easy to use.
2. Dedicated Trading Journal Apps
TraderSync
Tradervue
Edgewonk
Notion (with custom templates)
3. Manual Notebook
Good for psychological and emotional notes.
4. Screenshots + Annotation Tools
Helps capture chart context.
The best tool is the one you will use consistently.
6. How Journaling Improves Trading Consistency
a) Clear Feedback Loop
Every trade becomes a lesson, not a random event.
b) Helps Identify Strengths
You’ll find:
Which time of day you trade best
Which setups fit your personality
Which markets give you the best results
You slowly refine your edge.
c) Eliminates Unforced Errors
When you see your repeated mistakes, you naturally work to eliminate them:
Moving SL
Taking trades outside strategy
Chasing entries
Over-exposure
d) Enhances Risk Management
Performance tracking highlights:
When you risk too much
When you break position sizing rules
Better risk = smoother equity curve.
e) Improves Emotional Intelligence
You become a calmer, more objective trader.
7. Monthly Review: The Secret Weapon
Every month, conduct a detailed review:
Top 5 best trades
Top 5 losing trades
Mistakes repeated
New patterns noticed
Strategy-level performance
Emotional stability score
Improvements for next month
This helps you evolve and refine your trading approach.
8. Long-Term Benefits of Journaling
After 6–12 months, a trading journal becomes a goldmine:
It shows your transformation as a trader.
It highlights your unique trading strengths.
It provides confidence during drawdowns.
It shapes your personal trading system.
Most importantly, it prevents you from being trapped in an emotional loop.
Professional traders treat journaling as mandatory.
Beginners treat it as optional—and that’s why they struggle.
Conclusion
Trading Journaling & Performance Tracking is not just a habit; it’s the backbone of trading success. While strategies help you enter and exit trades, journaling helps you refine your behavior, recognize patterns, control emotions, and develop consistency. It transforms your trading from guesswork into a structured, measurable, and improvable process.
If you want to grow as a trader, start journaling today. Even a simple step like writing down entries, exits, emotions, and mistakes can dramatically improve your performance. Over time, your journal becomes your personal trading mentor—one that knows your strengths, weaknesses, and the path to your success better than any external source.

Option Trading Strategies Option Trading Strategies
Options allow many creative strategies—simple to advanced.
1. Single-Leg Strategies
Call Buying
Use when expecting sharp upside moves.
Put Buying
Use when expecting sharp downside moves.
Call Selling (Short Call)
Bearish or range-bound markets.
Put Selling (Short Put)
Bullish to neutral markets.

Candle Patterns Knowledge Candlestick Patterns + Indicators
Candles work superbly with key indicators:
Moving Averages (20/50/200)
Hammer above 50 EMA → powerful retracement
Bearish Engulfing below 20 EMA → continuation
RSI Divergence
Bullish pattern + RSI divergence = rock-solid reversal
Bearish pattern + bearish divergence = reliable entry
Bollinger Bands
Hammer at lower band
Shooting star at upper band

Trading Psychology – The Mental Edge of Successful Traders1. Why Trading Psychology Matters More Than Strategy
A trading strategy is important, but even the best strategy can fail if the trader cannot execute it with discipline.
For example:
A trader may exit too early due to fear.
A trader may hold losing positions due to hope.
A trader may overtrade due to greed or excitement.
A trader may avoid taking trades due to hesitation after losses.
These behaviors have nothing to do with strategy—they are psychological errors. Markets reward logic, not emotions. Thus, mastering psychology is just as important as mastering technical or fundamental analysis.
2. Key Emotional Challenges in Trading
a) Fear
Fear comes in different forms:
Fear of losing money
Fear of missing out (FOMO)
Fear of being wrong
Fear often pushes traders into irrational actions such as not pulling the trigger on a valid setup, placing too tight stop-losses, or chasing the market impulsively.
b) Greed
Greed leads to:
Overtrading
Holding winners too long
Trading oversized positions
Gambling instead of following rules
Greed makes traders believe they can earn more with one big trade, which usually leads to disaster.
c) Overconfidence
After a few winning trades, many traders feel invincible. This leads to:
Ignoring risk management
Taking bigger risks
Abandoning the trading plan
Overconfidence breaks discipline faster than losses.
d) Revenge Trading
Revenge trading happens when a trader tries to recover losses immediately. This emotional state leads to:
Quick, irrational trades
Ignoring setups
Emotional overreaction
Revenge trading is one of the biggest reasons for heavy losses.
e) Impatience
Trading requires waiting for the perfect setup. Many traders:
Enter too early
Exit too early
Switch strategies too often
Impatience destroys consistency.
3. Core Psychological Traits of Successful Traders
a) Discipline
The ability to follow the trading plan strictly.
Discipline prevents impulsive decisions, ensuring consistent behavior regardless of market conditions.
b) Patience
Great traders wait for the market to come to them. They do not chase trades; they choose trades.
c) Confidence
Confidence is not arrogance.
It is the belief in your strategy and ability, built through backtesting, journaling, and experience.
d) Emotional Control
Successful traders are calm during profit and loss.
They understand that:
“One trade does not decide the journey.”
Thus, emotions never control their decisions.
e) Adaptability
Markets constantly change. A strong trading psychology enables traders to adapt without panic or frustration.
4. Psychological Principles for Better Trading
a) Think in Probabilities
Trading is like poker or sports betting—nothing is guaranteed.
Winning traders think in terms of:
Win rate
Reward-to-risk
Long-term edge
They do not expect every trade to win.
b) Accept Losses as Part of the Game
Losses are not failures—they are expenses.
Just like a business has costs, trading has losing trades.
Accepting losses reduces fear and prevents emotional decisions.
c) Process Over Outcome
Focusing only on profit leads to stress and mistakes.
Successful traders focus on:
Following the plan
Managing risk
Executing flawlessly
The outcome naturally improves.
5. The Psychology Behind Market Movements
Markets are driven by collective emotions:
Fear
Greed
Panic
Hope
Euphoria
Understanding these crowd behaviors helps traders
ride trends
avoid traps
identify market reversals
A trader who understands human behavior has a huge edge.
6. How to Build Strong Trading Psychology
a) Create a Clear Trading Plan
A plan should include:
Entry rules
Exit rules
Stop-loss and target rules
Risk per trade
Timeframes and setups
A strong plan removes emotional thinking.
b) Use Strict Risk Management
Risk management reduces emotional pressure.
If you risk only 1% per trade:
fear decreases
losses become manageable
confidence increases
Small, controlled losses reduce emotional damage.
c) Keep a Trading Journal
Journaling helps identify:
emotional mistakes
good trades
bad habits
areas to improve
It is the most powerful tool for psychological growth.
d) Practice Mindfulness and Emotional Awareness
Mindfulness helps you remain aware of:
fear
greed
stress
impulsive urges
It encourages rational thinking under pressure.
e) Backtest and Build Confidence
Backtesting proves your strategy works.
When you trust the system, you stop doubting and stop making emotional decisions.
7. Common Psychological Mistakes Traders Make
Expecting quick results
Trading success takes years of practice.
Relying on instinct instead of rules
The market punishes emotional guesses.
Changing strategies often
Inconsistency destroys psychological stability.
Taking trades to “prove” something
Trading is not about ego; it’s about probabilities.
Ignoring mental health
Stress, burnout, and fatigue lead to poor decisions.
8. Developing a “Professional Trader Mindset”
Professional traders think differently from beginners.
Pros focus on risk; beginners focus on profit.
Professionals ask:
“How much can I lose?”
Beginners ask:
“How much can I make?”
Pros follow systems; beginners follow emotions.
Pros accept uncertainty; beginners look for certainty.
Pros treat trading as a business; beginners treat it as gambling.
Shifting to a professional mindset requires consistent practice and emotional maturity.
9. The Role of Habits and Lifestyle in Trading Psychology
Your lifestyle impacts your mental state.
Healthy traders:
sleep well
exercise
maintain routines
avoid trading during emotional stress
take breaks after big wins or losses
A disciplined life encourages disciplined trading.
10. Final Thoughts: Master Your Mind, Master the Market
Trading psychology is the foundation of long-term trading success.
You can have:
the perfect indicator
advanced strategies
great market knowledge
But without emotional control, you will struggle.
The true trader’s journey is about mastering:
mindset
discipline
patience
acceptance
self-awareness
Once you understand your emotions and behavior, the market becomes much easier to navigate.
Options Trading & Greeks1. What Are Options?
Options are derivative contracts that give traders the right, but not the obligation, to buy or sell an asset (like stocks, indices, commodities, or currencies) at a preset price (strike price) within a specific period.
There are two major types:
1. Call Option
Gives the buyer the right to buy the underlying asset at the strike price.
Call Buyer → Bullish
Call Seller → Bearish
2. Put Option
Gives the buyer the right to sell the underlying asset at the strike price.
Put Buyer → Bearish
Put Seller → Bullish
Options can be bought or sold, creating four basic positions:
Long Call
Short Call
Long Put
Short Put
From these, traders build advanced strategies such as spreads, straddles, strangles, condors, butterflies, etc.
2. Why Trade Options?
Options offer benefits that stocks cannot:
1. Leverage
Small capital can control a large position.
2. Hedging
Protect your portfolio against downside risk (e.g., buying Puts).
3. Income Generation
Sell options regularly (like Covered Calls, Cash Secure Puts).
4. Flexibility & Strategy
Strategies exist for every type of market — trending, sideways, volatile, or low-volatility.
3. How Option Prices Are Determined
An option’s premium is influenced by:
Underlying Asset Price
Strike Price
Time to Expiry
Volatility
Interest Rates
Dividends
All these factors interact continuously and cause option premiums to fluctuate. Traders use Option Greeks to measure these changes and manage risk.
4. Introduction to Option Greeks
Greeks measure the sensitivity of an option’s price to various market factors. Think of them as tools that let you understand:
How much premium will change if price changes
How fast time decay will erode value
How volatility impacts premium
How the option behaves near expiry
The 5 major Greeks are:
Delta
Theta
Vega
Gamma
Rho
Let’s explore each in detail.
5. Delta – The Price Sensitivity Greek
Delta measures how much an option’s premium will change if the underlying price moves by ₹1.
Example:
If a Call option has Delta = 0.60
→ A ₹1 rise in the stock increases the premium by ₹0.60
Interpretation:
Call Delta: 0 to 1
Put Delta: -1 to 0
ATM options → around 0.50
ITM options → higher Delta (~0.70 to 0.90)
OTM options → lower Delta (~0.10 to 0.30)
Uses of Delta:
Predicting premium movements
Position sizing in options (Delta exposure)
Hedging (Delta neutral strategies)
As expiry approaches, Delta of ATM options moves sharply toward 1 or 0.
6. Gamma – The Acceleration Greek
Gamma measures how much Delta will change if the underlying asset moves by ₹1.
If Delta is the speed of movement, Gamma is the acceleration.
Importance:
Tells how unstable or stable your Delta is
ATM options have highest Gamma
Near expiry, Gamma becomes extremely high → risky
Why Traders Watch Gamma:
High Gamma = fast change in Delta → rapid premium movement
Option sellers fear high Gamma because small price moves can cause big losses
Gamma helps traders avoid selling risky options near expiry.
7. Theta – The Time Decay Greek
Theta measures how much an option loses in value every day due to time decay.
Options are wasting assets — they lose value as expiry approaches.
Example:
Theta = -6
→ The option loses ₹6 in premium each day (all else constant)
Key Points:
Theta is negative for option buyers
Theta is positive for option sellers
ATM options lose value fastest
Time decay accelerates in the last 10–15 days of expiry
Why Theta Matters:
Option sellers (writers) love Theta because they profit from time decay.
Option buyers must overcome Theta loss through strong directional moves.
8. Vega – The Volatility Greek
Vega measures how sensitive an option’s price is to changes in volatility.
Volatility is the heartbeat of options pricing. When volatility rises, options become more expensive.
Example:
Vega = 10
→ If IV increases by 1%, premium increases by ₹10
Volatility Impact:
High IV → expensive options
Low IV → cheap options
Vega Behaviors:
Highest for ATM options
Falls sharply near expiry
Impacts long-term options (LEAPS) more than short-term
Why Vega Matters:
Traders use Vega to:
Trade earnings announcements
Trade events (Union Budget, Fed decisions)
Avoid buying overpriced options
Take advantage of IV crush
9. Rho – The Interest Rate Greek
Rho measures sensitivity to changes in interest rates.
Example:
Rho = 5
→ a 1% rise in interest rates increases the premium by ₹5
Rho impacts:
Long-term options
Index options (slightly)
Hardly affects short-term equity options
It is the least important Greek for day-to-day trading but relevant for long-duration positions.
10. How Greeks Work Together
Greeks never work alone. They influence each other and create the real behavior of an option.
Example:
A high Delta ITM option also has low Gamma
An ATM option has high Gamma, high Vega, and high Theta
An OTM option has low Delta, low Gamma, and low Theta
Understanding these relationships helps you choose the right strike and expiry.
11. Practical Applications of Greeks
1. Directional Trading (Delta-based)
Choose high Delta options for directional moves.
Avoid low Delta (far OTM) options → high probability of decay.
2. Income Strategies (Theta-based)
Short Strangles, Iron Condors, Credit Spreads
→ Earn from time decay + low movement
3. Volatility Trading (Vega-based)
Trade before major events (high IV) and exit after IV crush.
4. Risk Management (Gamma-control)
Avoid selling naked ATM options near expiry due to high Gamma risk.
12. Greeks by Different Market Phases
Trending Market
Delta is most important
Use low Gamma (ITM options) for stability
Sideways Market
Theta becomes dominant
Use option selling strategies
High-Volatility Market
Vega spikes → options overpriced
Prefer selling IV (credit spreads, straddles)
Expiry Day
Gamma risk highest
Only experienced traders should trade
Theta is maximum (rapid decay)
13. Why Greeks Matter More in Indian Markets
India’s option market (specially Nifty and BankNifty) is:
Volatile
High participation
Weekly expiries
Strong intraday moves
This makes Greeks extremely important. A 20–50 point move in Nifty can drastically change Delta, Gamma, and Theta. Traders who understand Greeks avoid emotional trading and make data-driven decisions.
14. Conclusion
Options trading is not just about prediction — it is about understanding the forces that shape option prices. Greeks are your tools to measure:
Directional risk (Delta)
Acceleration risk (Gamma)
Time decay (Theta)
Volatility risk (Vega)
Interest rate sensitivity (Rho)
Mastering Greeks helps you:
Select the right strike
Choose the right expiry
Control losses
Optimize returns
Build safe strategies
Trade confidently
Whether you are a beginner looking to understand basics or an intermediate trader trying to refine strategies, knowing Greeks will transform your options trading journey.

Price Action Trading1. What is Price Action Trading?
Price action trading is the analysis of raw price movement on a chart. It involves studying candlestick patterns, support and resistance zones, trendlines, breakouts, volume behavior, and the psychology behind market participants’ actions. Instead of using lagging indicators, price action traders focus on:
Higher highs and higher lows
Support and resistance
Market structure
Trend strength
Candle patterns
Order flow concepts
Because price is immediate and reflects the most recent market decisions, price action helps traders stay aligned with real-time sentiment and avoids the delays of indicators.
2. Why Price Action Works
Price action works because it is rooted in the core principle of markets:
All buying and selling decisions are reflected in price.
Every candlestick tells a story:
A long wick shows rejection.
A big body shows strength.
A small range candle shows indecision.
A breakout candle signals aggression.
Unlike indicator-based trading, price action teaches traders to understand why something is happening, not just what is happening. This deeper understanding is why professional traders and institutional players rely heavily on price action.
3. Core Components of Price Action Trading
(A) Market Structure
Market structure is the backbone of price action. It tells you whether the market is trending, consolidating, or reversing.
Uptrend:
Higher Highs (HH)
Higher Lows (HL)
Downtrend:
Lower Highs (LH)
Lower Lows (LL)
Range:
Horizontal support and resistance
Equal highs and equal lows
Once you know the structure, you know the bias.
(B) Support and Resistance (S/R)
Support and Resistance are areas where price reacts repeatedly because buyers or sellers defend those levels. They are widely used in price action trading.
Support: A level where buying pressure exceeds selling pressure.
Resistance: A level where selling pressure exceeds buying pressure.
The strongest S/R zones have:
Multiple touches
Volume confirmation
Trend alignment
Psychological round numbers (like 100, 500, 1000)
(C) Candlestick Patterns
Candlesticks reflect market psychology and reveal what buyers and sellers are doing.
Key price action patterns include:
Pin Bar (Hammer / Shooting Star) – Strong rejection
Engulfing Pattern – Trend reversals or continuation
Inside Bar – Low volatility → breakout setup
Doji – Indecision
Marubozu – Strong directional momentum
Candlesticks are tools for confirming entries and exits.
(D) Breakouts and Fakeouts
Price often breaks above or below important levels. But not all breakouts sustain. Many fail — known as fakeouts.
A good price action trader learns to differentiate between:
True breakout: High volume, strong candle body, retest
False breakout: Wick break, low volume, immediate reversal
Fakeout trading is one of the most profitable techniques when mastered.
(E) Trendlines and Channels
Trendlines help visualize structure and momentum. Two or more touches create a valid trendline.
Channels (rising or falling) help traders locate:
Buying opportunities at lower boundary
Selling opportunities at upper boundary
Breakouts at structure collapse
Trendlines enhance clarity in volatile markets.
4. Price Action Entry Techniques
There are several reliable entry models:
(A) Breakout Entry
Traders enter when price breaks a major level:
Resistance breakout → Buy
Support breakout → Sell
Strong breakout confirmation includes:
Big-bodied candle
Volume increase
Retest of level
(B) Pullback Entry
This is the most common entry for professional traders.
Steps:
Identify trend
Wait for correction
Look for price action signal
Enter with trend continuation
Pullback entries offer high reward-to-risk ratios.
(C) Reversal Entry
Used at key S/R zones.
Signals include:
Pin Bar at resistance
Engulfing candle at support
Divergence between price and momentum
Reversal entries require patience and confirmation.
5. Price Action Exit Strategies
(A) Fixed Target Exit
Based on S/R levels, Fibonacci targets, or ATR projections.
(B) Trailing Stop Exit
Use structure-based trailing:
Swing high/lows
Trendline breaks
Moving average (optional)
(C) Partial Profit Booking
Sell half at first target, trail rest.
This reduces risk and increases consistency.
6. Risk Management in Price Action Trading
Risk management is inseparable from price action.
Key principles:
Risk 1–2% per trade
Use stop loss below/above structure
Never chase trades
Avoid overtrading
Trade high-probability zones
Maintain minimum 1:2 or 1:3 RR
Price action is powerful, but without risk control, even the best trades can fail.
7. Psychological Aspect of Price Action
Price action exposes traders to raw market volatility, so emotional discipline is essential.
Key psychological principles:
Stick to your plan
Don’t interpret noise as signals
Trust structure and patterns
Accept losing trades
Stay unbiased—trade what the chart shows
Avoid revenge trades
Markets reward disciplined behavior more than aggressive behavior.
8. Major Price Action Strategies
(A) Trend Following Strategy
Identify trend
Buy pullbacks in uptrend
Sell pullbacks in downtrend
Confirm with candle patterns
This is the most reliable and beginner-friendly approach.
(B) Reversal Trading Strategy
Look for reversal patterns at major S/R levels:
Pin bar reversal
Double top/bottom
Head and shoulders
Engulfing reversal
Reversal trading offers high RR but requires experience.
(C) Breakout and Retest Strategy
One of the cleanest setups:
Price breaks a strong level
Comes back to retest
Forms a bullish/bearish signal
Enter towards breakout direction
Institutional traders commonly use this.
(D) Range Trading Strategy
In a sideways market:
Buy support
Sell resistance
Wait for breakout to stop range trading
Ranges are predictable and profitable for price action traders.
9. Advantages of Price Action Trading
Works on all markets and timeframes
No dependency on indicators
Quick decision-making
Clears chart from clutter
Aligns with institutional trading
Easy to learn but deep to master
Works even in low-volume markets
10. Limitations of Price Action Trading
Requires screen time and practice
Highly subjective
Can generate false signals in choppy markets
Emotional discipline needed
News events can disrupt structure
Price action is powerful, but traders must combine it with risk management and emotional control.
Conclusion
Price Action Trading is a complete trading ecosystem—focused on understanding how price behaves, how market participants react, and how to trade based on pure market psychology. It eliminates reliance on lagging indicators and teaches traders to interpret structure, trends, reversals, breakouts, and raw candlestick signals. With practice, traders using price action gain clarity, develop confidence, and improve consistency across all market conditions.
