Part 2 Ride The Big MovesMargin Requirements: Critical Conditions
Margins are financial requirements that protect the market from defaults.
a) Initial Margin
This is required when the position is opened. It includes:
SPAN margin
Exposure margin
b) Maintenance Margin
Traders must maintain a minimum balance to keep positions open.
c) Additional Margin
If volatility increases, brokers may collect extra margins.
d) Physical Delivery Margin
Mandatory if stock options are taken near expiry.
e) Penalties
Failure to meet margin requirements leads to:
Squaring off of positions
Penalty charges
Blocking of trading account
Understanding margin rules is crucial for safe option trading.
Trendindicator

Option Chain Analysis Time Decay (Theta): A Major Profit Source
Time decay is a predictable reduction in premium as expiry approaches.
How Theta works:
Buyers lose money daily if the price does not move.
Sellers gain money daily even if nothing happens.
Example:
Premium at start of week: ₹200
No price movement
By expiry: ₹20
Sellers keep ₹180 simply because time passed.

Part 2 Trading Master ClassHow Option Sellers Earn Profit
Option sellers (writers) make money very differently from buyers.
Sellers earn through:
Premium collection
Time decay (Theta) working in their favor
Market staying within a defined range
Selling gives higher probability of profit but unlimited risk if the market moves aggressively.
Example:
You sell Bank Nifty 49,000 CE at ₹220
Market stays sideways or falls
Premium collapses to ₹30
Your Profit = (220 – 30) × Lot Size
This profit results from the sold option expiring worthless.

Part 2 Support and Resistance How Call Options Generate Profit
A Call Option gives you the right—but not obligation—to buy an asset at a fixed price (strike price).
You profit from a call option when:
The market price goes above the strike price.
The premium increases due to:
Price movement
Increased volatility
Reduced time to expiry near ITM levels
Example:
Nifty trading at 22,000
You buy Call 22,000 CE at ₹120
Price moves to 22,200
Premium increases to ₹200
Your Profit = (200 – 120) × Lot Size
This profit comes without buying the actual index—just the premium appreciation.

Part 9 Trading Master ClassBull Call Spread – Best for Mild Uptrend with Low Risk
This is a defined-risk bullish strategy.
How it works
Buy a lower strike call.
Sell a higher strike call to reduce cost.
When to use
You expect a moderate rise, not a major rally.
Premiums are expensive and you want to reduce cost.
Risk and reward
Risk: Limited to net premium paid.
Reward: Limited (difference between strikes – cost).
Example
Buy Nifty 22,000 CE at ₹120
Sell Nifty 22,200 CE at ₹50
Net cost = ₹70
Max profit = ₹200 – 70 = ₹130

Massive Commodity Profits1. The Nature of Commodities: Volatility Breeds Opportunity
Commodities are essential goods with relatively inelastic demand. People still need fuel, food, and metals regardless of price fluctuations. However, supply is far more unstable. Weather conditions, mining delays, geopolitical tensions, shipping bottlenecks, and regulatory changes can all reduce availability overnight. When supply tightens against steady or rising demand, prices can spike dramatically.
For example:
A drought in Brazil can send coffee futures surging.
Tensions in the Middle East can push crude oil prices upward.
A mining strike in Peru may cause copper prices to rally.
This structural instability is what makes the commodity market capable of delivering massive profits in short periods.
2. Demand Cycles and Economic Trends
Massive commodity profits also emerge during strong global macroeconomic cycles. When economies expand, they consume more energy, metals, and agricultural products. Industrial expansion in countries like China, India, and the U.S. has historically led to major commodity supercycles.
For instance, China’s industrial boom (2000–2013) sent prices of iron ore, copper, and oil to record highs. Traders who recognized the multi-year demand trend and positioned early captured enormous profits. These long-cycle rallies happen roughly every 10–15 years and often create fortunes for large funds and early participants.
3. Supply Shocks: The Fastest Profit Drivers
The biggest and quickest commodity profits typically arise from supply shocks—unexpected events that disrupt production. A single headline can trigger a wave of volatility.
Common supply shock triggers include:
Wars or geopolitical conflict (oil, natural gas)
Extreme weather (wheat, corn, soybeans)
Export bans (rice, sugar, palm oil)
Mining accidents or strikes (copper, nickel, gold)
Because supply shocks occur unexpectedly, prices often move before retail traders even react. Institutions and professional traders who monitor real-time logistics, shipping data, and political events can capitalize on these early movements.
4. Inflation: A Powerful Catalyst for Commodity Surges
Inflation is another core driver of massive commodity profits. When currencies lose value, real assets—especially commodities—rise to preserve purchasing power. Gold and silver are classic hedges, but even energy and food commodities benefit from inflation cycles.
During inflationary shocks:
Crude oil rallies due to cost-push pressures.
Agricultural commodities rise as farming inputs become more expensive.
Industrial metals climb as production costs rise.
Traders who understand the macroeconomic environment anticipate these moves and position accordingly, often using futures or long-dated options for leverage.
5. Futures and Options: The Engines of High Profit Potential
Massive commodity profits often come from futures markets, where traders use small margins to control large contract sizes.
Why futures create big profits:
High leverage means small price moves generate large percentage gains.
Futures prices react faster than spot markets.
Liquidity allows rapid entry and exit.
Global participation increases volatility and opportunity.
Options add an additional profit dimension:
Buying calls during bullish commodity cycles can multiply capital several times.
Selling options during high-volatility spikes generates income for advanced traders.
Spreads allow directional and neutral strategies with controlled risk.
Professional traders often combine futures, options, and spot positions to maximize returns.
6. Algorithmic Models: Profit From Micro-Volatility
Modern commodity markets are heavily influenced by algorithmic and high-frequency trading (HFT). Algorithms exploit micro-movements in futures markets, such as:
Order flow imbalances
Spread arbitrage
Statistical mean reversion
Volume spikes
Institutional block orders
While these strategies may seem small in isolation, their compounded results can produce significant profits, especially during volatile periods like harvest seasons, geopolitical uncertainty, or inventory report releases.
7. The Role of Fundamental Reports in Profit Opportunities
Commodity markets are deeply influenced by high-impact reports. For example:
USDA reports move agricultural markets.
OPEC announcements shake oil markets.
EIA crude inventory data impacts short-term energy prices.
LME warehouse stocks influence metals.
Traders who deeply understand these reports know how to interpret supply estimates, production forecasts, and consumption trends. This anticipatory edge often creates large profit opportunities before the broader market reacts.
8. Supercycles: The Biggest Profit Windows
A commodity supercycle is a long-term period of rising prices driven by structural global changes. Past supercycles have been triggered by:
Global industrialization
Technological revolutions
Decarbonization and renewable energy demand
Infrastructure expansion in emerging markets
During supercycles, prices can rise for 5–15 years, creating the largest profits in commodity trading. Investors in gold during the 1970s, oil in the 2000s, and lithium between 2018–2022 saw exponential returns. Commodity supercycles often reshape entire economies.
9. Risk Management: Protecting Massive Profits
Massive profits are only meaningful if protected. Commodity markets can reverse violently due to announcements, policy changes, or macroeconomic developments. Smart traders use:
Hedging with futures
Position sizing
Stop-loss and trailing stops
Diversification across sectors (energy, agri, metals)
Options for protection (protective puts)
Risk control ensures that large profits are not wiped out by sudden counter-moves.
10. Psychology: Mastering Volatility
The final ingredient in generating massive commodity profits is trader psychology. Commodity markets are emotional. Greed, fear, and panic accelerate volatility. Traders who remain disciplined, patient, and analytical tend to outperform.
Key psychological traits of profit-making commodity traders include:
Patience in waiting for setups
Speed in execution
Ability to endure volatility
Emotional neutrality
Long-term vision during supercycles
Mindset is often the difference between consistent profits and emotional decisions.
Conclusion
Massive commodity profits arise from the unique nature of global supply and demand, geopolitical tensions, inflation, natural events, and human psychology. Commodities offer some of the most volatile and opportunity-rich markets in the world. By understanding macroeconomic drivers, supply-chain dynamics, fundamental reports, futures strategies, and disciplined risk management, traders can position themselves to capture extraordinary profits during both short-term shocks and long-term supercycles.
Small Account Challenges for Indian Traders1. Limited Capital and High Risk Exposure
The primary and most obvious challenge for small account traders is limited capital. With a small account, traders are compelled to take higher risk positions, which often leads to:
A. Overleveraging
Indian brokers offer leverage mainly for intraday equity trades, but in recent years, SEBI regulations have significantly reduced the leverage available.
Small account traders often feel forced to:
Use full margin or near-full margin
Take oversized positions to achieve meaningful returns
Try to flip positions quickly to cover brokerage, taxes, and charges
This increases the probability of a margin call or forced liquidation.
B. Inability to Absorb Drawdowns
Markets naturally move in cycles of profits and losses. A small loss of ₹500 may be negligible for a trader with ₹5 lakh capital but can feel devastating for someone starting with ₹5,000.
This creates emotional stress and leads to irrational decisions like revenge trading.
2. Brokerage, Taxes, and Trading Charges Eat Into Profits
Trading in India involves multiple cost elements:
Brokerage
STT/CTT
Exchange Transaction Charges
GST
SEBI Fees
Stamp Duty
Slippage
For small accounts, these charges form a disproportionately large percentage of the capital. For example:
A trader with ₹10,000 may lose up to 1–2% per trade in costs alone.
Frequent intraday trading becomes unviable when costs exceed potential profits.
This pushes many small account traders toward high-risk segments like options buying, which has lower capital requirements but high volatility.
3. Pressure to Make Quick Profits
Indian traders with small accounts often enter the market with the mindset:
“I need to double this account fast.”
“I want to make monthly income from ₹10,000 capital.”
“I will start small and become full-time in a few months.”
This creates unrealistic expectations, leading to:
Overtrading
Aggressive option buying
Fear of missing out (FOMO)
Emotional swings
Impulsive decisions
The expectation to grow capital rapidly is one of the biggest psychological traps.
4. Limited Access to Diversification
With small capital, it’s difficult to diversify across:
Stocks
Sectors
Time frames
Trading strategies
Most small traders put all their capital into a single stock or a single futures or options position, which increases portfolio risk dramatically. A single bad trade can wipe out the account.
5. Options Buying Addiction
Because equity and futures require higher capital, small traders gravitate toward options buying, particularly:
Weekly Nifty/Bank Nifty options
Zero day expiry (0DTE) trades
Far OTM options
While these instruments offer high reward potential, they also carry:
Very fast time decay
High volatility risk
Frequent whipsaws
Low probability of consistent profitability
Most small account traders get trapped in a cycle of quick profits followed by large losses, ultimately destroying their capital.
6. Difficulty Implementing Proper Risk Management
Risk management requires rules like:
Risk 1–2% per trade
Maintain stop-loss discipline
Control position size
However, with small accounts, applying these rules becomes nearly impossible.
For example, with ₹10,000 capital:
1% risk = ₹100
Most trades cannot be structured within such tight risk limits
Even brokerage and charges exceed the risk budget
Thus, small traders are almost forced to violate risk rules, making professional-level discipline difficult to maintain.
7. Emotional and Psychological Challenges
Small account trading is mentally draining because:
Every loss feels bigger than it is.
Every profit seems insufficient.
A few losing trades can wipe out weeks of effort.
Fear of losing capital creates hesitation.
Greed pushes traders to take oversized bets.
This emotional instability leads to:
Overtrading
Lack of patience
Jumping between strategies
Chasing trending stocks
Continual strategy switching
Psychology becomes a greater barrier than capital itself.
8. Limited Access to Tools, Data, and Learning Resources
Professional traders use:
Advanced charting platforms
Real-time data feeds
Premium screeners
Algorithms and automation
Backtesting tools
For a small account trader, these tools feel expensive and unaffordable.
As a result, they rely on:
Free charting websites
Social media tips
Influencer trades
Telegram groups
Many of these sources are unreliable, biased, or manipulated.
9. Lack of Experience in Market Cycles
Small traders often enter the market during bull phases, where:
Almost every trade gives profit
Stocks keep rising
Market sentiment is positive
When the market shifts into a volatile or bearish phase, small traders struggle to adapt.
They lack experience in handling:
Downtrends
Range-bound markets
High volatility periods
Event-driven uncertainty
This inexperience leads to heavy losses.
10. Compounding Takes Time—People Want Immediate Results
Growing a small account through disciplined compounding requires:
Patience
Persistence
Realistic targets
Long-term vision
However, many small traders want:
Quick doubling
Daily profits
Constant action
High returns instantly
This mindset contradicts the reality of compounding, which is slow but powerful over time.
11. Social Pressure and Unrealistic Comparisons
Many traders compare themselves to:
Influencers showing big profits
Experienced traders posting daily screenshots
People claiming to double accounts regularly
This comparison creates unnecessary pressure, causing small traders to take irrational risks just to match those results.
Most don’t realize that successful traders today started small themselves—but with years of experience.
Conclusion
Small account trading is challenging in India due to limited capital, high transaction costs, emotional stress, and structural market restrictions. However, success is still possible with realistic expectations, disciplined risk management, and a focus on long-term skill development instead of quick profits.
By understanding these challenges deeply, Indian traders can avoid common traps, preserve their capital, and slowly build a strong foundation for future growth.
Market Swings and Interest Rates–Inflation Dynamics1. What Are Market Swings?
Market swings refer to rapid or significant changes in asset prices—either upward (rallies) or downward (corrections). These swings reflect shifts in sentiment, liquidity, macroeconomic conditions, and expectations for future growth. Markets don’t move in straight lines; instead, they react continuously to new information, especially related to interest rates and inflation.
Causes of Market Swings
Economic Data Releases
Inflation reports, GDP numbers, unemployment data, and consumer spending directly influence investor expectations.
Central Bank Decisions
Changes in interest rates or monetary policy guidance drive sharp reactions across asset classes.
Geopolitical Events
Wars, trade conflicts, sanctions, and political instability often trigger sudden risk-off movements.
Corporate Earnings
Better-than-expected profits cause upward swings, while weak results trigger sell-offs.
Global Liquidity Conditions
Tight liquidity increases volatility; easy liquidity fuels risk taking.
Investor Psychology
Fear, greed, herd behavior, and algorithmic trading amplify swings.
Market swings become more intense when inflation becomes unpredictable or interest rates change sharply, because these two variables determine the cost of money and purchasing power.
2. Inflation: The Root Variable
Inflation is the rate at which the general price level of goods and services rises. Moderate inflation indicates healthy demand in an economy. Excessive inflation, however, erodes purchasing power, compresses profit margins, and destabilizes savings and investment.
Types of Inflation
Demand-pull inflation: When aggregate demand outpaces supply.
Cost-push inflation: When production costs (energy, wages, commodities) rise.
Built-in inflation: Wage-price spirals where higher prices lead to demands for higher wages.
Why Inflation Matters for Markets
Inflation directly influences:
Corporate profits: Higher raw material and wage costs reduce margins.
Consumer behavior: Purchasing slowdowns hurt sectors like retail, automotive, and housing.
Bond yields: Investors demand higher returns for inflation-eroded value.
Currency value: High inflation weakens the currency relative to trading partners.
Asset valuation: Higher inflation reduces present value of future cash flows.
Inflation affects every sector differently. For instance, banks may benefit from higher interest margins, but real estate might slow down as borrowing becomes expensive.
3. Interest Rates: The Policy Lever
Interest rates—primarily influenced by central banks—represent the cost of borrowing money. They are the most powerful tool used to control inflation, regulate liquidity, and stabilize financial systems.
How Central Banks Use Interest Rates
When inflation rises: Central banks increase interest rates to cool consumption and credit growth.
When economic growth slows: They cut interest rates to stimulate borrowing and investment.
Impact of Interest Rate Movements on Markets
Equity Markets:
Rising rates reduce corporate earnings and lower stock valuations.
Lower rates boost profits, lending, investment, and stock market rallies.
Bond Markets:
Bond prices fall when interest rates rise.
They rise when interest rates fall.
Currency Markets:
Higher interest rates attract foreign capital, strengthening the currency.
Lower rates weaken the currency.
Commodity Markets:
Higher rates usually push commodities down due to stronger currency and weaker demand.
Lower rates boost commodities like gold and crude oil.
Interest rates are the bridge between inflation and market swings: when they rise rapidly, volatility spikes across global markets.
4. The Relationship Between Interest Rates and Inflation
Interest rates and inflation are strongly interconnected:
When Inflation Rises
Central banks raise rates.
Borrowing becomes expensive.
Consumption slows.
Investment reduces.
Inflation gradually falls.
Markets often correct due to tightening liquidity.
When Inflation Falls
Central banks cut rates.
Loans become cheaper.
Business investment grows.
Consumer spending increases.
Economic activity expands.
Markets rally.
This push-and-pull relationship keeps the economy balanced. But when inflation rises too quickly, central banks hike rates aggressively, causing sharp market swings.
5. How Inflation and Interest Rates Create Market Swings
A. Sudden Inflation Surges
When inflation rises faster than expected:
Bond yields jump.
Stock markets decline due to fear of rate hikes.
Growth stocks suffer more because future earnings become less valuable.
Commodity markets become volatile.
Currency markets react abruptly.
Example:
A spike in oil prices can raise inflation suddenly, forcing central banks to tighten policy sooner than expected.
B. Aggressive Rate Hikes
Rapid rate hikes lead to:
Liquidity shortages
Corporate borrowing stress
Sell-offs in equity markets
Currency appreciation
Bond yield inversion
Most market crashes historically have been linked to sharp tightening cycles, where rising rates choke liquidity.
C. Rate Cuts After High Inflation
When inflation cools and rates fall:
Markets rally strongly.
Growth and tech stocks lead recoveries.
Housing and auto sectors revive.
Emerging markets attract foreign capital.
Investors reposition from defensive assets (like bonds and gold) to riskier assets.
6. Sector-Wise Impact of Rate and Inflation Movements
1. Banking & Financials
Benefit from moderate rate hikes (higher interest margins).
Get hurt during extreme hikes (loan defaults rise).
2. Technology & Growth Stocks
Highly sensitive to rising interest rates (high future earnings valuation).
3. Real Estate & Infrastructure
Dependent on borrowing; rate hikes reduce demand sharply.
4. FMCG & Consumer Goods
Damaged by high inflation (cost pressures)
Recover with falling inflation
5. Metals, Oil & Commodities
Move with inflation trends
Benefit from low interest rates and strong demand cycles
7. Psychological and Liquidity Effects
Markets are not driven only by numbers—sentiment and liquidity play major roles. Rising inflation creates uncertainty; investors fear erosion of purchasing power. Rate hikes reduce liquidity; lower liquidity increases volatility. Algorithms and institutional money amplify moves, making swings sharper.
When inflation stabilizes and liquidity improves, investor confidence returns, reducing volatility.
8. Final Thoughts
Market swings are natural outcomes of changing economic conditions. Inflation and interest rates act as the core variables that shape the direction, magnitude, and speed of these swings. Investors who understand this relationship can anticipate major turning points, position portfolios wisely, and avoid panic during volatile periods. In a world where economic conditions shift rapidly, understanding the dynamics between inflation, interest rates, and market behavior becomes essential for long-term investment success.
Divergence Secrets Key Terms in Option Trading
Before going deeper, you must understand some basic terminology:
• Strike Price
The pre-decided price at which you can buy (call) or sell (put) the asset.
• Premium
The price you pay to buy the option contract.
• Expiry
Options have an expiry date—weekly, monthly, or longer.
• Lot Size
You cannot buy individual shares in options; contracts come in fixed lot sizes.
• In-the-Money (ITM)
The option already has intrinsic value.
Call ITM: Market price > Strike price
Put ITM: Market price < Strike price
• Out-of-the-Money (OTM)
The option has no intrinsic value, only time value.
• At-the-Money (ATM)
Strike price ≈ Market price.
Understanding these terms helps you choose the right option for your trade setup.

Trade Rate Sensitive Assets: A Comprehensive OverviewIntroduction
In the global financial markets, assets are often influenced by fluctuations in trade rates, currency values, and interest rates. Trade rate sensitive assets are those whose valuations, returns, or profitability are significantly affected by changes in trade rates or related economic variables. Understanding these assets is crucial for investors, traders, and policymakers, as shifts in trade rates can impact everything from corporate earnings to sovereign debt sustainability. In this discussion, we will explore what trade rate sensitive assets are, the types of assets affected, the mechanisms of sensitivity, and practical strategies for managing associated risks.
Definition of Trade Rate Sensitive Assets
Trade rate sensitive assets are financial or physical assets whose value is directly or indirectly influenced by trade rates, exchange rates, or global trade dynamics. In this context, “trade rate” refers to the cost of importing or exporting goods and services, often mediated by currency exchange rates and tariffs. When trade rates fluctuate due to changes in currency valuations, trade policies, or global demand, the cash flows and profitability of these assets can be materially affected.
For example, a company that exports electronics from India to the United States may find that its revenue in Indian Rupees rises or falls depending on the USD/INR exchange rate. Similarly, bonds issued in foreign currency, commodities, or equity of export-driven companies are considered trade rate sensitive.
Categories of Trade Rate Sensitive Assets
Equities of Export-Oriented Companies
Companies engaged in global trade, particularly exporters, are highly sensitive to changes in trade rates. For instance:
Exporters: Revenue depends on foreign currency inflows. A stronger domestic currency reduces the local-currency value of foreign revenue, negatively impacting profits.
Importers: Firms reliant on imported raw materials may face higher costs if the domestic currency weakens, squeezing profit margins.
Examples include:
Technology companies exporting software or hardware.
Commodity companies exporting metals, agricultural products, or chemicals.
Foreign Currency Bonds
Bonds issued in foreign currency expose investors to trade rate and currency risk. When trade rates impact currency valuations:
The local-currency value of coupon payments and principal changes.
Investors holding USD-denominated bonds in emerging markets may gain or lose value depending on the USD exchange rate relative to their home currency.
Commodities
Many commodities are globally traded, so trade rate fluctuations directly influence pricing. For instance:
Oil and gas prices are denominated in USD globally; any currency depreciation in importing countries increases local costs.
Agricultural products, metals, and rare earth minerals are affected similarly, with global trade dynamics impacting supply and demand.
Derivative Instruments
Derivatives such as futures, options, and swaps on foreign currencies, commodities, and trade-sensitive indices also qualify as trade rate sensitive assets. They are particularly useful for hedging or speculating on trade rate movements. For example:
Currency futures can hedge export revenue against domestic currency appreciation.
Commodity futures allow exporters and importers to manage cost volatility.
Real Assets with Trade Exposure
Some physical assets, like factories, warehouses, or ships, are indirectly trade rate sensitive. For example, a shipping company’s revenue is tied to freight rates, which are influenced by global trade activity and currency movements.
Mechanisms of Sensitivity
Trade rate sensitivity arises from several interconnected mechanisms:
Exchange Rate Fluctuations
Exchange rates are a primary determinant of trade rate sensitivity. Assets that generate foreign revenue or require foreign inputs experience profit volatility when exchange rates shift.
A depreciation of the domestic currency improves export competitiveness, potentially increasing revenue.
Conversely, it raises the cost of imported inputs, affecting margins.
Tariffs and Trade Policies
Changes in trade tariffs, quotas, and regulations can directly impact asset value:
Increased tariffs on imported components may raise production costs for domestic manufacturers.
Export restrictions in foreign markets can limit revenue potential.
Global Economic Cycles
Trade-sensitive assets react to changes in global economic growth, as demand for exports fluctuates with industrial production, consumer spending, and investment cycles.
Commodity Prices
Many trade-sensitive assets, especially in resource-driven economies, are influenced by global commodity prices. For example:
Oil exporters benefit from rising crude prices in USD terms.
Agricultural exporters face revenue shifts based on international demand and currency-adjusted prices.
Interest Rate Differentials
Trade-sensitive assets in foreign currency can be indirectly affected by interest rate differentials. Higher domestic interest rates may strengthen the currency, impacting export competitiveness and asset valuations.
Risk and Volatility
Trade rate sensitive assets carry inherent risks due to their exposure to multiple dynamic factors:
Currency Risk: Volatile exchange rates can significantly alter asset values.
Trade Policy Risk: Sudden policy changes, sanctions, or tariffs can disrupt revenue streams.
Commodity Price Risk: Export-driven commodity firms face fluctuations in global prices.
Liquidity Risk: Assets with concentrated trade exposure may be harder to sell during economic shocks.
Investors must recognize that trade rate sensitivity introduces higher volatility compared to domestic-only assets, making risk management essential.
Investment and Hedging Strategies
Investing in trade rate sensitive assets requires careful assessment of global trade trends, currency movements, and economic indicators. Some practical strategies include:
Diversification
Spread investments across regions, sectors, and asset classes to reduce exposure to a single trade-sensitive factor.
Currency Hedging
Use forward contracts, options, or swaps to mitigate currency risk in foreign revenue or bonds.
Commodity Hedging
Exporters and importers can lock in prices via commodity futures or swaps to reduce volatility from global market fluctuations.
Monitoring Policy Developments
Stay informed on tariffs, trade agreements, and geopolitical developments that may affect asset valuations.
Active Portfolio Management
Adjust allocations dynamically based on macroeconomic indicators, exchange rate forecasts, and trade volume trends.
Examples in Real-World Markets
Apple Inc.: Generates significant revenue from exports; USD appreciation can affect international earnings.
Reliance Industries: Exposed to crude oil prices and global trade flows; currency and commodity risks are significant.
Emerging Market Bonds: Sensitive to USD movements and global interest rate changes, affecting repayment in local currencies.
Shipping Companies (e.g., Maersk): Revenue depends on global trade volumes and freight rates, which fluctuate with global economic conditions.
Conclusion
Trade rate sensitive assets form a crucial component of global financial markets, linking macroeconomic trends, currency movements, and international trade dynamics. These assets—ranging from equities, bonds, commodities, derivatives, to physical trade-linked assets—require careful monitoring due to their susceptibility to exchange rates, trade policies, and global demand cycles. Successful investment and risk management in these assets involve a combination of hedging, diversification, and close attention to macroeconomic and geopolitical indicators. Understanding the mechanisms and strategies related to trade rate sensitivity enables investors and policymakers to navigate volatility, optimize returns, and mitigate potential losses in a highly interconnected global economy.
Earnings Season TradingWhy Earnings Season Matters
Earnings reports influence stock prices more than most regular market events. The market is constantly pricing in expectations, and earnings represent the moment of truth—where expectations meet reality. If a company beats expectations (called an “earnings beat”), its stock often rallies. If the results disappoint (“earnings miss”), the stock may fall sharply. Additionally, future guidance—what the company predicts about its upcoming quarters—can be more important than the reported numbers themselves.
During earnings season, volumes rise, volatility spikes, and short-term price patterns become much more pronounced. This environment creates both high profit potential and equally high risk, making proper strategy essential.
Key Components of an Earnings Report
Understanding the report helps traders interpret market reactions. Earnings reports usually include:
1. Revenue (Top Line)
Indicates how much money the company generated from its primary business. Strong revenue growth usually signals product demand and market expansion.
2. Net Profit / EPS (Bottom Line)
Earnings per share (EPS) shows profitability per share. Analysts set EPS estimates, and beating or missing EPS forecasts strongly affects the stock price.
3. Operating Margins
Shows how efficiently a company manages costs. Even if revenue is strong, declining margins can cause the stock to fall.
4. Forward Guidance
This includes the company’s insight into future sales, demand, risks, and profitability. Sometimes a company beats current numbers but gives weak guidance, resulting in a price decline.
5. Management Commentary
Covers industry outlook, product pipeline, consumer behavior, macroeconomic impacts, and risk factors.
Why Trading During Earnings Season is Unique
Earnings season amplifies three types of moves:
1. Pre-Earnings Run-Up
Stocks sometimes rise in anticipation of strong results. This is driven by speculation, analyst commentary, or sector optimism.
2. Post-Earnings Reaction
Immediate moves occur within seconds of the results going public. High-frequency trading algorithms often react first.
3. After-Reaction Drift
Even after the initial spike, stocks frequently trend in the direction of the earnings surprise for several days.
These patterns create multiple trading opportunities depending on a trader’s risk appetite.
Popular Earnings Season Trading Strategies
1. Pre-Earnings Momentum Trading
Traders take positions before the results based on:
Recent stock performance
Market sentiment
Sector strength
Insider buying
Analyst upgrades
This strategy aims to capture the run-up but carries the risk of sharp reversals if the actual earnings disappoint.
Example:
Tech stocks often rally into earnings when demand for their products is strong. Traders ride this momentum and exit before the announcement.
2. Post-Earnings Gap Trading
When earnings are released, stocks often show large price gaps up or down. Traders analyze:
Gap size
Volume levels
Overall trend
Pre-market sentiment
They may buy strong gap-ups or short weak gap-downs once a clear trend forms.
3. Volatility Trading Using Options
Earnings increase implied volatility (IV), which inflates option premiums. Traders can take advantage through:
Straddles – betting on big moves in either direction
Strangles – cheaper version of straddles
Iron Condors – betting the stock will remain within a range
IV Crush Trading – betting that volatility will fall after earnings
Volatility trading is extremely popular because earnings produce predictable IV cycles.
4. Guidance-Based Trading
Sometimes the numbers look good but guidance is weak. Smart traders focus on what the company says about:
Future revenue
Interest-rate impact
Cost pressures
Demand changes
Currency effects
Sector slowdowns
Guidance often dictates the direction more strongly than current results.
5. Reaction Fade Strategy
If a stock moves too aggressively immediately after earnings, it sometimes “fades” the move later in the day.
This strategy relies on identifying overreactions.
How to Prepare for Earnings Season Trading
1. Study the Company’s History
Some companies consistently beat expectations (e.g., large tech firms), while others are inconsistent. Knowing historical patterns helps predict reactions.
2. Track Analyst Estimates
Earnings reactions depend on expectations, not just the absolute numbers. Sources include:
Consensus EPS
Revenue expectations
Whisper numbers (informal predictions)
A beat relative to analyst expectations is often more important than year-over-year growth.
3. Analyze Industry and Macro Trends
Earnings of companies in the same sector often follow patterns.
4. Look at Options Data
Option pricing reveals how much the market expects the stock to move.
5. Prepare Risk Management Rules
Due to high volatility, traders must:
Set stop losses
Avoid oversized positions
Manage leverage
Avoid emotional trades
Risks of Earnings Season Trading
While the profit potential is high, risks can be severe:
1. Large Gaps
Unexpected results can cause huge overnight price swings, wiping out positions.
2. IV Crush
Options lose value dramatically after earnings because volatility collapses.
3. Whipsaw Movements
Stocks may move violently in both directions before settling.
4. Market Overreaction
The market sometimes reacts emotionally rather than logically.
5. Liquidity Issues
Some stocks have wide bid-ask spreads during earnings, leading to poor fills.
Best Practices for Successful Earnings Trading
Trade liquid stocks with tight spreads.
Wait for the trend to form instead of jumping in immediately.
Avoid over-leveraging – earnings can break any prediction.
Read the press release and transcript for clarity on guidance.
Combine technical and fundamental analysis.
Don’t trade every earnings report – select only high-probability setups.
Track post-earnings drift for swing setups.
Conclusion
Earnings season trading is one of the most dynamic and opportunity-rich periods in the financial markets. The combination of heightened volatility, strong price movements, and emotionally driven reactions creates an environment ideal for active traders. However, the same factors that offer high profit potential also increase risk, making preparation, discipline, and risk management essential. By understanding earnings reports, analyzing expectations, and using clear trading strategies, traders can navigate earnings season with confidence and aim for consistent profitability.
Technical Analysis vs Fundamental Analysis1. Introduction
Financial markets are influenced by a vast network of economic, psychological, and structural forces. To understand price movements, one must either study the intrinsic value of an asset or analyze its price behavior. This is where fundamental and technical analysis come into play.
Fundamental analysis evaluates securities by examining economic, financial, and qualitative factors. Its purpose is to estimate the true value (fair value) of a stock, commodity, or currency.
Technical analysis, on the other hand, focuses solely on market data—primarily price and volume—to forecast future price movements. It assumes that all known fundamentals are already reflected in price.
2. What Is Fundamental Analysis?
Fundamental analysis studies the underlying factors influencing a company or economy. It aims to determine whether an asset is overvalued, undervalued, or fairly valued.
Key Components of Fundamental Analysis
a) Financial Statements
Investors examine:
Balance sheet (assets, liabilities, equity)
Income statement (revenue, net profit)
Cash flow statement (cash inflow/outflow)
These help measure profitability, leverage, growth, liquidity, and operational efficiency.
b) Economic Indicators
Macro factors influence overall market conditions:
GDP growth
Inflation
Interest rates
Employment data
Fiscal and monetary policy
For example, rising interest rates often reduce stock market returns.
c) Industry Analysis
Analyzing:
Industry growth rate
Competition
Market share
Regulatory environment
A strong company in a weak industry may still underperform.
d) Qualitative Aspects
These include:
Management quality
Corporate governance
Brand value
Innovation and product pipeline
Customer loyalty
Such factors often drive long-term performance.
e) Valuation Models
Popular methods include:
Discounted Cash Flow (DCF)
Price-to-Earnings (P/E) ratio
Price-to-Book (P/B) ratio
EV/EBITDA
Dividend Discount Model (DDM)
These help estimate fair value compared to the market price.
3. What Is Technical Analysis?
Technical analysis predicts future price movements based on historical market data such as price, volume, and market sentiment. It is commonly used by traders rather than long-term investors.
Key Components of Technical Analysis
a) Price Charts
Different chart types help visualize market patterns:
Candlestick charts
Line charts
Bar charts
Heikin-Ashi
Candlestick patterns like Doji, Hammer, and Engulfing reveal market psychology.
b) Indicators and Oscillators
Traders use mathematical tools to identify trends, strength, and reversals:
Moving Averages (MA)
RSI (Relative Strength Index)
MACD
Bollinger Bands
Stochastic Oscillator
Volume indicators
Each provides signals on market entry and exit.
c) Chart Patterns
Patterns help anticipate future price movements:
Head and Shoulders
Double Top/Double Bottom
Triangles
Flags and Pennants
Cup and handle
These patterns often repeat due to consistent human behavior.
d) Trend Analysis
One of the most important principles:
Uptrend (higher highs, higher lows)
Downtrend (lower highs, lower lows)
Sideways trend (range-bound market)
Traders follow the trend to reduce risks.
e) Support and Resistance
Key price zones where buying/selling pressure increases:
Support: where price tends to bounce up
Resistance: where price tends to fall back
Breakouts and breakdowns are major trading signals.
4. Philosophy Behind Both Analyses
Fundamental Analysis Philosophy
Market price does not always reflect true value.
Over time, price will converge toward intrinsic value.
Best for long-term investors who want to buy undervalued assets.
Technical Analysis Philosophy
Price discounts everything (news, emotions, fundamentals).
Price moves in trends.
Market psychology causes patterns that repeat over time.
Best for traders focusing on short to medium time frames.
5. Time Horizon Differences
Fundamental Analysis
Long-term approach (months to years)
Used by investors, mutual funds, and institutional players
Suitable for wealth creation
Technical Analysis
Short-term to medium-term (minutes to weeks)
Used by day traders, swing traders, scalpers
Suitable for frequent trading
6. Advantages and Limitations
A) Fundamental Analysis – Pros
Helps identify long-term investment opportunities
Provides deep understanding of a company
Works well for building wealth
Useful for identifying high-quality businesses
Fundamental Analysis – Cons
Time-consuming and complex
Markets can remain irrational longer than expected
Not effective for short-term trading
Sudden news/events can invalidate analysis
B) Technical Analysis – Pros
Helps with precise entry and exit timing
Works in all markets (stocks, forex, crypto, commodities)
Quick and efficient
Useful even without deep company knowledge
Technical Analysis – Cons
False signals are common
Over-reliance can lead to overtrading
Requires discipline and psychological control
Patterns may fail during high volatility
7. Which One Should You Use?
For Long-term Investors
Fundamental analysis is superior because it focuses on:
business strength
financial health
long-term growth potential
It helps identify companies that compound wealth over time.
For Short-term Traders
Technical analysis works better due to:
market-timing capabilities
entry/exit precision
chart-based signals
Short-term price movement is mostly driven by psychology, liquidity, and volatility—technical tools capture this better.
8. Combining Both Approaches (Best Practice)
Many professionals use a hybrid approach, known as Techno-Fundamental Analysis.
Example Strategy:
Use fundamental analysis to identify strong companies.
Use technical analysis to find the right entry point.
This method gives investors both quality and proper timing.
9. Conclusion
Technical analysis and fundamental analysis are powerful tools, each serving different purposes in trading and investing. Fundamental analysis focuses on understanding value, financial health, and long-term prospects of assets. Technical analysis emphasizes price behavior, market psychology, and timing of trades.
An ideal market participant should understand both; investors rely more on fundamentals, while traders depend heavily on technical tools. Combining both approaches enhances decision-making and offers the best balance of knowledge and timing—crucial for consistent success in financial markets.
Swing Trading in India1. What Is Swing Trading?
Swing trading is a strategy where traders aim to profit from price swings—upward or downward—over short to medium durations. Unlike day traders, swing traders don’t depend on rapid-fire trades. Instead, they wait for price setups, enter with a calculated plan, and exit when the target is achieved.
In India, typical swing trading time frames range from:
3 to 10 days for momentum stocks
10 to 20 days for trend-following trades
2 to 8 weeks for positional swing trades
Swing trading works well because markets rarely move in a straight line; they swing between support and resistance, giving multiple opportunities.
2. Why Swing Trading Is Popular in India
a) High Volatility in Stocks
Indian stocks—especially mid-caps and sectoral leaders—show strong short-term price movements. This creates opportunities for swing traders.
b) Lower Stress Compared to Intraday
Swing traders don’t need to watch charts constantly. They make decisions after market hours based on end-of-day charts.
c) Suitable for Working Professionals
Since trades last for days, a full-time job doesn’t stop you from swing trading.
d) Limited Market Noise
Instead of reacting to intraday fluctuations, swing traders focus on broader technical patterns.
e) Leverage With Futures and Options
Index futures, stock futures, and options unlock leveraged swing trades with defined risk.
3. Tools Required for Swing Trading
To succeed in swing trading in India, traders rely on three pillars:
a) Technical Analysis
The backbone of swing trading. Key tools include:
Support and resistance
Trendlines
Breakout and breakdown patterns
Moving averages (20-EMA, 50-SMA, 200-SMA)
RSI and MACD
Fibonacci retracement levels
Volume analysis
b) Risk Management Tools
Stop-loss
Position sizing
Risk-reward ratios (minimum 1:2)
c) Market Structure Awareness
Understanding market phases:
Uptrend
Downtrend
Consolidation
Reversal zones
4. Popular Swing Trading Strategies in India
1) Breakout Trading
This is one of the most reliable swing strategies. Traders enter when the price breaks above resistance with high volume.
Example setups:
Breakout from a consolidation zone
Breakout from a wedge or triangle pattern
New 52-week high with strong volume
2) Pullback Trading
Instead of chasing breakouts, traders wait for a pullback toward support.
Indicators used:
20-EMA or 50-SMA
Fibonacci 38.2% or 61.8%
RSI pullback to 40–50 before continuation
This strategy works well in trending markets such as IT, Pharma, and BFSI sectors.
3) Trendline Bounce Strategy
When a stock respects an upward trendline multiple times, swing traders enter near the trendline with a stop-loss just below it.
4) RSI Overbought/Oversold Strategy
An easy yet effective method:
RSI near 30 → possible bounce
RSI near 70 → possible correction
Works strongly with Nifty and large caps.
5) Moving Average Crossover Strategy
Swing traders often use:
Golden Cross (50-SMA crosses above 200-SMA)
20-EMA crossover for short-term momentum trade
Crossovers give directional cues for upcoming swings.
5. Best Stocks and Indexes for Swing Trading in India
Nifty 50 stocks
Highly liquid
Clean chart patterns
Predictable swings
Examples: Reliance, TCS, Infosys, HDFC Bank, ICICI Bank
Bank Nifty and Nifty Index
Index swings are relatively stable and follow global cues. Suitable for futures or options-based swing trading.
Mid-cap and Sector Leaders
Often show the strongest short-term movements.
Examples: Dixon Technologies, Deepak Nitrite, Persistent Systems, APL Apollo, Tata Elxsi.
Sectoral Trends
Swing traders track sector rotations such as:
PSU banks
FMCG
IT
Auto
Realty
If a sector strengthens, individual stocks show faster momentum.
6. Time Frames Used in Swing Trading
Swing traders typically use a multi-timeframe approach:
Higher Time Frame (Weekly)
Identifies long-term trend
Marks major support/resistance
Medium Time Frame (Daily Chart)
Primary decision-making chart
Finds entry setups
Lower Time Frame (1-hour or 4-hour)
Fine-tunes entries
Confirms breakout sustainability
This multi-level approach increases accuracy.
7. Risk Management in Swing Trading
Risk management is the key to long-term success.
a) Stop-Loss Placement
A common mistake is placing stop-loss too tight. Instead, place SL:
Below swing low in uptrend
Above swing high in downtrend
Below 20-EMA or trendline
b) Risk per Trade
Limit risk to 1%–2% of trading capital.
c) Risk-Reward Ratio
Minimum acceptable ratio: 1:2
Ideal: 1:3 or higher
d) Position Sizing Formula
Position size =
(Capital × Percentage Risk) / Stop-loss distance
e) Avoiding Overnight News Risk
Check:
Quarterly results dates
Government policy announcements
Global events like Fed decisions
8. Common Mistakes Indian Swing Traders Make
1) Overtrading
Not every day produces a swing opportunity.
2) Trading Illiquid Stocks
Avoid low-volume stocks; they give fake breakouts.
3) Ignoring Market Trends
Even strong stocks fall if the index is bearish.
4) No Exit Plan
The exit strategy is as important as the entry.
5) Holding Losing Trades
Emotional attachment destroys capital.
9. Advantages of Swing Trading
Requires less screen time
Good risk-reward trades
Works in both bullish and bearish conditions
Offers more stability than intraday
Allows trading in stocks, futures, and options
Helps build discipline and market understanding
10. Disadvantages and Challenges
Overnight risk
False breakouts in Indian markets
Requires patience
Higher margin requirement for futures
Not suitable for extremely volatile stocks without proper risk control
11. Best Practices for Swing Traders in India
Maintain a trading journal
Stick to limited strategies
Use alerts on TradingView or broker platforms
Focus on sectors gaining momentum
Enter only when risk-reward is favorable
Keep emotions in check
Protect capital at all costs
Conclusion
Swing trading in India is a powerful approach that blends technical analysis, market timing, and disciplined risk management. With the right strategies—breakouts, pullbacks, trendline bounces, and moving average setups—traders can consistently capture profitable price swings. The Indian market provides ample opportunities due to its volatility, liquidity, and sector-based momentum.
By mastering tools, refining entry/exit rules, and avoiding emotional decisions, anyone can become a successful swing trader. It suits beginners, working professionals, and experienced traders looking for a balanced trading style with manageable risk and attractive returns.
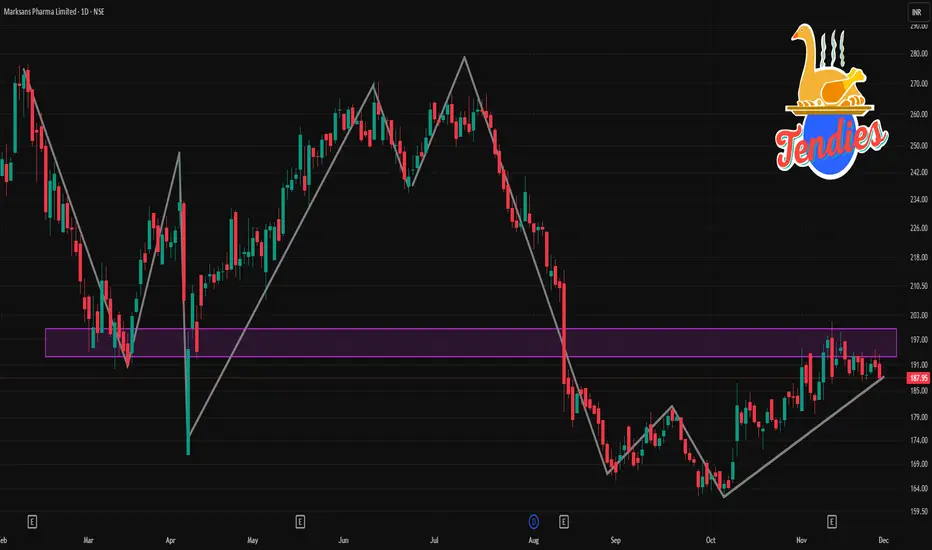
MARKSANS 1 Day time Frame 📌 Current Price & Broad Context
Latest share price: ≈ ₹187.95.
52-week range: Low ~ ₹162.00, High ~ ₹358.70.
Recent trend: The stock is significantly below its 52-week high; price has fallen roughly 25–45% over the past 6–12 months.
🧮 What to Watch / Combine with Other Views
Daily technicals show neutral-to-bearish bias, with some structural support around long-term moving average.
But longer-term fundamentals (company financials, order book, approvals, sector sentiment) could disrupt this — technicals are just one lens.
Because the stock is well below its 52-week high, there’s scope for rebound — but also risk: price could continue downward if sentiment remains weak.
For better clarity: it’s often helpful to check 1-week or 1-month charts along with volume, open interest (if derivatives), and any corporate/news events.
Part 6 Learn Institutional TradingWhy Trade Options?
Options offer several strategic advantages:
a. Hedging
Investors use options to protect their portfolio. For example, buying a put option can insure against a fall in stock prices, similar to buying insurance.
b. Speculation
Traders can bet on price movements—up, down, or even sideways—using options.
c. Income Generation
Many traders sell options (covered calls, cash-secured puts) to earn regular premiums.
d. Leverage
Options allow control of large positions with a relatively small amount of capital.

Top-Performing Companies Across Different PLI CategoriesElectronics and Semiconductor Sector
The electronics and semiconductor sector is one of the most significant beneficiaries of the PLI scheme. India’s ambition to become a global electronics manufacturing hub has seen major players expand operations under the scheme.
Key Performing Companies:
Foxconn India: A global contract manufacturer, Foxconn has leveraged PLI incentives to expand smartphone assembly lines and component production in India, catering to both domestic demand and exports.
Wistron and Pegatron: These Taiwanese companies have aggressively increased manufacturing capacities, focusing on consumer electronics such as smartphones and laptops.
Lava International and Micromax: Indian brands have utilized PLI support to enhance their supply chains, localize manufacturing, and remain competitive against international players.
These companies have shown exceptional growth in production volumes and employment generation, highlighting the success of PLI in promoting electronics manufacturing.
Pharmaceuticals and Medical Devices
The pharmaceuticals and medical devices sector is a critical area of focus under the PLI scheme, especially in light of global demand for affordable and high-quality healthcare products.
Top Performers:
Sun Pharma: Leveraging PLI benefits, Sun Pharma has expanded its manufacturing of critical APIs (Active Pharmaceutical Ingredients) to meet both domestic and international demand.
Cipla and Lupin: These companies have enhanced production capacities in high-demand therapeutic segments such as cardiovascular, anti-infectives, and diabetes medications.
Trivitron Healthcare: A key player in medical devices, Trivitron has scaled up production of diagnostic and surgical equipment, supported by PLI incentives.
These companies’ performance demonstrates the PLI scheme’s potential in enhancing India’s self-reliance in healthcare and reducing dependence on imports.
Automobile and Auto Components
The PLI scheme has also targeted the automotive sector, particularly electric vehicles (EVs) and advanced automotive components.
Leading Companies:
Tata Motors: With a focus on EV production, Tata Motors has utilized PLI incentives to expand EV manufacturing, batteries, and related components.
Mahindra Electric: Mahindra Electric has capitalized on PLI support to boost EV innovation and production, aiming to increase domestic adoption.
Bosch India: As a leading auto components manufacturer, Bosch has invested in next-generation automotive technologies including EV systems, sensors, and power electronics.
These companies are not only benefiting from financial incentives but are also driving India’s transition to sustainable mobility and smart automotive solutions.
Textiles and Apparel
The textiles and apparel sector has seen a transformative impact under the PLI scheme, especially in enhancing value addition and export competitiveness.
Top Performing Companies:
Arvind Ltd: A leader in textiles, Arvind has leveraged PLI incentives to scale up high-end apparel production and integrate advanced technologies.
Welspun India: Focused on home textiles and high-quality fabrics, Welspun has expanded production capacities and strengthened its export footprint.
Raymond Ltd: With investments in innovative textiles and premium apparel, Raymond has utilized PLI support to modernize operations and maintain market leadership.
These companies illustrate how PLI incentives are fostering quality enhancement, higher employment, and export growth in India’s textile industry.
Food Processing Industry
The PLI scheme aims to boost India’s food processing sector, which has enormous potential due to the country’s agricultural base.
High Performers:
Amul (Gujarat Cooperative Milk Marketing Federation): Amul has expanded value-added dairy production with PLI support, ensuring higher efficiency and export readiness.
ITC Ltd: ITC has leveraged the PLI scheme to enhance processed food production, particularly ready-to-eat and packaged goods, for both domestic and international markets.
Parle Agro: PLI incentives have helped Parle Agro scale production lines for beverages and packaged foods, enhancing competitiveness and market share.
These companies demonstrate the PLI scheme’s ability to strengthen India’s food processing ecosystem, reduce wastage, and promote global competitiveness.
Advanced Chemistry Cell (ACC) and Battery Manufacturing
The rise of EVs and renewable energy has increased demand for advanced batteries. The ACC and battery manufacturing category under PLI aims to establish India as a hub for battery production.
Leading Companies:
Exide Industries: Exide has expanded lithium-ion and lead-acid battery manufacturing, leveraging PLI incentives to modernize plants and boost capacity.
Amara Raja Batteries: Focused on automotive and stationary energy storage solutions, Amara Raja has invested in R&D and production expansion.
Tata Chemicals: Diversifying into advanced battery materials, Tata Chemicals has used PLI support to strengthen supply chains for lithium and other key materials.
These investments are critical for India’s EV ambitions and energy transition goals.
Impact on Employment and Exports
The companies benefiting from the PLI scheme have not only scaled production but also created significant employment opportunities. Manufacturing facilities often require skilled and semi-skilled labor, providing job creation in tier-2 and tier-3 cities. Moreover, enhanced production capacities have boosted exports, enabling India to compete with global players in sectors like electronics, pharmaceuticals, textiles, and EV batteries.
Challenges and Future Outlook
Despite strong performance, companies face challenges such as supply chain constraints, competition from global manufacturers, and technology gaps. However, continued PLI support, combined with strategic investments, can help overcome these hurdles.
Looking ahead, sectors like electronics, EVs, advanced batteries, and pharmaceuticals are expected to continue leading under the PLI scheme. Companies that invest in innovation, technology localization, and skill development will likely emerge as the most successful beneficiaries.
Conclusion
The PLI scheme has been a game-changer for India’s manufacturing ecosystem, with top-performing companies across various sectors demonstrating its potential. From electronics and pharmaceuticals to automotive, textiles, and food processing, PLI incentives have enabled companies to scale production, enhance exports, and create employment. Companies like Foxconn, Sun Pharma, Tata Motors, Arvind Ltd, and Amul exemplify the transformative impact of the scheme. As India continues to focus on self-reliance and global competitiveness, the PLI scheme will remain a crucial driver of industrial growth and economic development.
Advanced Trading Methods 1. Multi-Timeframe Analysis (MTFA)
One of the most powerful advanced methods is multi-timeframe analysis. Instead of relying on a single chart, traders study the market on higher and lower timeframes simultaneously. Higher timeframes reveal the dominant trend, while lower timeframes help identify precise entries and exits.
For example:
Weekly chart → Determines long-term trend direction.
Daily chart → Confirms momentum and key levels.
Hourly chart → Provides exact entry zones.
Professional traders avoid fighting the higher-timeframe trend. MTFA blends strategic vision with tactical timing, reducing false signals and increasing trade accuracy.
2. Order Flow and Volume Profile Trading
Order flow analysis helps traders “see behind the candles.” It focuses on:
Market orders
Limit orders
Bid-ask imbalances
Liquidity pockets
Stop-run zones
The Volume Profile is a cornerstone of order-flow trading. It shows where the highest and lowest trading activity occurred at specific price levels. Key concepts include:
Value Area High (VAH)
Value Area Low (VAL)
Point of Control (POC)
These levels act as strong magnets for price, often defining areas of trend continuation, breakout, or reversal. Traders use this method to avoid low-probability trades and focus on areas of institutional interest.
3. Algorithmic and Quantitative Trading
Advanced traders increasingly rely on algorithms and quantitative models. These systems remove emotion, reduce human error, and allow rapid execution based on predefined rules.
Key components of algo-trading include:
Statistical modeling
Backtesting and optimization
Automated pattern recognition
High-frequency execution
Machine learning models
Popular strategies in quant trading:
Mean reversion
Statistical arbitrage
Momentum trading
Pairs trading
Volatility-based systems
These methods require programming knowledge, access to data feeds, and robust risk controls, but they provide exceptional consistency when executed properly.
4. Harmonic and Pattern-Based Trading
Advanced traders often use harmonic patterns based on Fibonacci ratios to predict high-probability reversal points. These include:
Gartley
Butterfly
Bat
Crab
Cypher
Each pattern represents a specific geometric structure in price action. Traders use them to forecast potential turning zones, also called PRZ (Potential Reversal Zone). Combined with support/resistance and volume, harmonic patterns identify precise entries with tight stop-losses.
5. Advanced Options Strategies
Options trading opens the door to several sophisticated strategies that allow traders to profit from directional, neutral, or volatility-based market conditions.
Popular advanced strategies:
Iron Condor (range-bound income generation)
Butterfly Spread (low-cost directional bets)
Calendar Spread (time decay advantage)
Straddle/Strangle (volatility breakouts)
Ratio Spreads (controlled risk with enhanced reward)
Options also allow hedging, portfolio insurance, and income generation techniques unavailable in simple stock trading.
6. Smart Money Concepts (SMC)
SMC is an advanced methodology based on institutional trading behavior. It focuses on liquidity, manipulation, and market structure rather than indicators.
Core elements include:
Break of Structure (BOS)
Change of Character (ChoCH)
Fair Value Gaps (FVG)
Liquidity Pools
Order Blocks
These concepts teach traders why price moves, not just how. SMC traders aim to enter at institutional footprints and ride moves driven by large capital flows.
7. Advanced Risk and Money Management Models
The best trading method fails without proper risk control. Professional traders apply mathematical risk models such as:
a. Kelly Criterion
Determines optimal position size to maximize long-term growth while controlling drawdowns.
b. Value-at-Risk (VaR)
Estimates the maximum expected loss under normal market conditions.
c. Risk-to-Reward Optimization
Ensures trades have statistically favorable outcomes.
d. Portfolio Correlation Analysis
Prevents over-exposure to highly correlated trades.
Advanced money management prioritizes capital preservation, knowing that survival in the market leads to long-term profitability.
8. Sentiment Analysis and Behavioral Trading
Market sentiment often drives price more than fundamental or technical factors. Advanced traders incorporate sentiment indicators such as:
Commitment of Traders Report (COT)
Fear & Greed Index
Options put-call ratio
Social media analytics (especially in crypto)
Institutional positioning data
They also apply behavioral finance concepts like herd mentality, confirmation bias, loss aversion, and overconfidence to anticipate irrational price moves driven by emotions.
9. News-Based and Event-Driven Trading
Institutional traders rely heavily on event-driven strategies. These include:
Trading earnings reports
Central bank announcements
Budget releases
Geopolitical events
Economic indicators (CPI, GDP, PMI, unemployment)
Volatility during news events creates large opportunities but also increased risk. Advanced traders use:
Straddles/strangles for volatility spikes
Pre-positioning based on expected outcomes
Quick scalps during liquidity surges
To manage risk, they may use hedging or dynamic stop-losses.
10. Arbitrage and Market Inefficiency Exploitation
Arbitrage involves profiting from price discrepancies in different markets. Types include:
Spatial arbitrage (different exchanges)
Cross-asset arbitrage (related securities)
Triangular arbitrage (forex mispricing)
Index arbitrage (index vs futures price gap)
Although often used by high-frequency firms, some opportunities still exist for well-equipped retail traders.
11. Advanced Technical Indicators and Custom Models
Professional traders often build custom indicators to fit their strategies. Examples include:
Multi-layer moving averages
Adaptive RSI
Market regime filters
Volatility-adjusted ATR stops
Custom tools enhance accuracy and reduce signal noise, helping traders align with the market environment.
12. Trading Psychology Mastery
The most advanced trading method is internal: psychological discipline. Elite traders maintain:
Emotional neutrality
Patience
Consistency
Rule-based execution
Non-reactiveness during volatility
Methods like journaling, meditation, and simulation trading help strengthen emotional control, turning mindset into a competitive advantage.
Conclusion
Advanced trading methods combine technology, mathematics, psychology, and market structure to produce a powerful and systematic approach to trading. Whether through algorithmic systems, order flow analysis, SMC, options strategies, arbitrage, or multi-timeframe technicals, the goal remains the same: to trade with precision, discipline, and statistical edge. Mastering these methods elevates a trader from basic decision-making to professional-grade execution, increasing profitability and long-term consistency.
Steps Involved in Executing a Trade1. Identifying the Trading Opportunity
The trade execution process begins long before clicking the buy or sell button. The first step is identifying a valid opportunity. Traders use various methods based on their style—technical analysis, fundamental analysis, or a combination of both.
Technical traders look for chart patterns, indicators, trends, support/resistance zones, or momentum signals.
Fundamental traders analyze earnings, macroeconomic news, sector trends, and company performance.
Algorithmic systems scan markets automatically based on coded rules.
A good opportunity must meet specific criteria defined in the trader’s strategy. This ensures you follow a systematic approach rather than making impulsive decisions.
2. Conducting Market Analysis and Confirmation
Once an opportunity is spotted, the next step is to confirm the trade. This involves deeper analysis to avoid false signals or emotional trades.
Technical Confirmation
Checking multiple timeframes
Validating trends
Reading candlestick patterns
Confirming indicator signals (RSI, MACD, moving averages)
Fundamental Confirmation
Monitoring economic releases
Checking for earnings announcements
Evaluating sector strength
Understanding market sentiment
Without confirmation, traders risk entering low-quality trades.
3. Determining Entry and Exit Levels
Before placing the trade, traders clearly define:
Entry Point
The exact price level where the trade should be opened. Professional traders do not “guess” entry—they plan it.
Stop-Loss Level
This is the maximum acceptable loss. Setting a stop-loss:
Protects capital
Removes emotional decision-making
Prevents large unexpected losses
Target or Take-Profit Level
A predetermined price at which the trader will exit with profit. Having targets:
Encourages disciplined exits
Helps calculate risk-reward ratio
Avoids holding too long
For example:
If you risk ₹10 to make ₹30, your risk-reward is 1:3—an excellent setup.
4. Calculating Position Size
This step separates professionals from amateurs. Position sizing ensures the trader does not over-expose their capital.
Factors considered:
Account size
Maximum risk per trade (usually 1%–2%)
Stop-loss distance
Volatility of the asset
Proper position sizing ensures survival in the long run. A trader who risks a small percentage of capital per trade can withstand market fluctuations without blowing up the account.
5. Choosing the Right Order Type
Execution depends heavily on the order type used. Different orders serve different purposes:
Market Order
Executes immediately at the current market price. Ideal for:
Fast-moving markets
When speed matters more than exact price
Limit Order
Executes only at a specific price or better. Best for:
Precise entries
Avoiding slippage
Stop-Loss Order
Automatically exits the trade at a set price to limit losses.
Stop-Limit Order
Combines stop and limit conditions. Useful when traders want price control with conditional execution.
Understanding order types helps avoid mistakes like entering at a wrong price or missing an important exit.
6. Executing the Trade
At this stage, the order is sent to the broker or exchange for execution. Key points include:
Ensuring no network delay or order mismatch
Double-checking quantity and price
Watching for slippage in volatile markets
Using fast execution for intraday or scalping traders
For algorithmic traders, execution is automated, but still depends on server speed, order routing, and liquidity.
7. Monitoring the Trade After Execution
Once the trade is live, monitoring becomes essential. Traders watch:
Price action
Volume changes
Market reactions to news
Key support or resistance levels
Active monitoring ensures quick decision-making if the market moves unexpectedly. Many traders adjust their stop-loss to breakeven once the trade moves in their favor—a technique called trailing stop.
8. Managing the Trade
Trade management determines long-term profitability more than entries. It includes:
Adjusting Stop-Loss
As the trade becomes profitable, the stop-loss can be moved closer to lock in gains.
Scaling In
Adding more quantity when the trend strengthens.
Scaling Out
Reducing exposure gradually by taking partial profits.
Exiting Early
If conditions change or the setup becomes invalid, exiting early protects capital.
Managing a trade requires discipline, flexibility, and understanding market behavior.
9. Closing the Trade
The trade is eventually closed at:
Stop-loss
Take-profit
Manual exit
Time-based exit
Closing a trade is not the end—it triggers reflection and learning. A calm and systematic exit reduces regret and emotional pressure.
10. Recording the Trade in a Journal
Successful traders record every trade. A trading journal includes:
Entry and exit price
Stop-loss and target
Reason for trade
Outcome
Emotions during the trade
A properly maintained journal reveals patterns of strengths and weaknesses.
For example:
You may discover you overtrade during volatile news
You may find certain setups work better than others
You may see that trades without stop-loss usually fail
Journaling helps refine strategies and improve decision-making.
11. Reviewing Performance and Optimizing Strategy
After recording the trade, traders review and analyze their performance weekly or monthly. This step focuses on:
Accuracy rate
Risk-reward ratio
Win/loss consistency
Emotional discipline
Strategy adjustments
Continuous improvement is the backbone of long-term trading success. Markets evolve, and traders must adapt to changing conditions.
Conclusion
Executing a trade is not simply buying or selling an asset; it is a disciplined process involving research, planning, risk management, execution, monitoring, and review. Each step—from identifying an opportunity to journaling the result—contributes to consistent profitability. Traders who follow this structured approach remove emotions from trading, make better decisions, and build a strong foundation for long-term success in the financial markets.
Best Timeframes for Chart PatternsHow to Trade Chart Patterns
Here is a simple, structured approach:
1. Identify the pattern early
Use clean charts, avoid too many indicators, and focus on structure. Patterns become clearer with practice.
2. Mark support and resistance levels
These levels act as breakout zones. Always confirm with a trendline or neckline.
3. Wait for a breakout
Never assume. Patterns are confirmed only when price breaks key levels.
4. Check volume
Higher volume on breakout adds confidence. Without volume support, avoid entering.
5. Set stop-losses
Place SL beyond pattern boundaries—e.g., outside triangles or below neckline.
6. Use target projections
Most patterns have measurable targets:
Flags → height of flagpole
Head and Shoulders → distance from head to neckline
Triangles → widest part of the formation

Part 2 Support and Resistance Factors That Affect Option Premium
(A) Underlying Price Movement
Bigger moves → bigger premium.
(B) Time Value
Longer time to expiry → higher premium.
(C) Volatility (IV)
Higher IV = expensive options
Lower IV = cheaper options
(D) Demand & Supply
High activity in a strike increases premium.
(E) Market Events
Events like:
RBI Policy
Budget
Elections
Earnings
Cause volatility spikes.

Part 9 Trading Master Class With Experts What Are Options?
Options are derivative contracts. This means their value is derived from an underlying asset—such as Nifty, Bank Nifty, stocks like Reliance or TCS, commodities, or currencies.
There are two types of options:
Call Options (CE) – Right to buy at a specific price
Put Options (PE) – Right to sell at a specific price
But remember this key point:
Options give a right, not an obligation.
This is what makes options asymmetric:
Buyers have limited risk and unlimited potential gain.
Sellers (writers) have limited profit but potentially high risk.

Options TradingIntroduction to Options Trading
Options trading is one of the most powerful yet misunderstood segments of the financial markets. Unlike stocks, which represent ownership in a company, options are financial contracts that give the holder the right, but not the obligation, to buy or sell an underlying asset at a predetermined price within a specific timeframe. Options are part of the derivatives family, meaning their value derives from the price movements of another asset, such as stocks, indices, commodities, or currencies.
Options trading allows investors to hedge risks, generate income, and speculate on market movements with comparatively smaller capital. They are versatile instruments, suitable for conservative hedging strategies as well as aggressive speculative plays. In India, options are actively traded on exchanges like NSE (National Stock Exchange) and are available on equities, indices (like Nifty 50), and commodities.
At its core, options trading is about flexibility and strategy. Unlike buying a stock outright, options let traders create positions that profit in bullish, bearish, or neutral market conditions. This flexibility is why professional traders and institutions frequently use options to manage risk, leverage capital, and optimize returns.
What Are Options?
An option is a contract between two parties: the buyer and the seller (writer). The buyer pays a price called a premium for the right to buy or sell the underlying asset at a specific price, known as the strike price, before the option expires. The seller, in turn, is obligated to fulfill the contract if the buyer exercises it.
Options are categorized into two main types:
Call Options – Give the holder the right to buy the underlying asset at the strike price.
Put Options – Give the holder the right to sell the underlying asset at the strike price.
The price of an option (premium) depends on multiple factors, such as:
The current price of the underlying asset.
The strike price relative to the current price.
Time until expiration (time decay).
Volatility of the underlying asset.
Interest rates and dividends (for equities).
Because options are derivative instruments, they allow traders to control a larger position with smaller capital. For instance, buying one Nifty 50 call option might give exposure equivalent to 50 shares of the index, but at a fraction of the capital required to buy the shares directly.
Options come with an expiration date, after which they become worthless if not exercised or closed. This characteristic introduces an important concept called time decay (Theta), which significantly influences option pricing and strategy.
Calls vs Puts: The Basics
Options are essentially bets on market direction, and the two main instruments—calls and puts—represent opposite positions.
1. Call Options
Definition: A call option gives the buyer the right, but not the obligation, to buy the underlying asset at a predetermined strike price before or on the expiration date.
When to Buy: Traders buy call options when they expect the price of the underlying asset to rise.
Profit Potential: The potential profit is theoretically unlimited, as the asset price can rise indefinitely above the strike price.
Risk: The maximum risk for the call option buyer is the premium paid, which is the cost of acquiring the option.
Example: Suppose Reliance Industries is trading at ₹2,500. A trader buys a call option with a strike price of ₹2,600, paying a premium of ₹50. If the stock rises to ₹2,700, the intrinsic value is ₹100, resulting in a profit of ₹50 per share after deducting the premium.
2. Put Options
Definition: A put option gives the buyer the right, but not the obligation, to sell the underlying asset at a predetermined strike price before or on expiration.
When to Buy: Traders buy put options when they expect the price of the underlying asset to fall.
Profit Potential: The potential profit increases as the price of the underlying asset declines. In theory, the maximum gain occurs if the asset price drops to zero.
Risk: Like calls, the maximum risk is limited to the premium paid.
Example: Suppose Infosys is trading at ₹1,500. A trader buys a put option with a strike price of ₹1,450 for a premium of ₹30. If Infosys falls to ₹1,400, the intrinsic value of the put is ₹50, resulting in a profit of ₹20 per share after deducting the premium.
Comparison Table: Calls vs Puts
Feature Call Option Put Option
Right To buy underlying asset To sell underlying asset
Market Expectation Bullish (price rise) Bearish (price fall)
Maximum Loss Premium paid Premium paid
Maximum Gain Unlimited Strike price minus premium (asset cannot
go below zero)
Used for Speculation, hedging long Speculation, hedging short positions
positions
Importance of Understanding Option Mechanics
Understanding the mechanics of options is crucial for traders to make informed decisions and manage risk effectively. Options are not standalone investments—they interact with market dynamics, time decay, volatility, and pricing models. Misunderstanding these mechanics can lead to significant losses, even in seemingly simple trades.
1. Pricing Factors
The pricing of options depends on variables like the underlying asset’s price, strike price, time to expiration, volatility, and interest rates. Using models like Black-Scholes (for European options) or Binomial models (for American options) helps traders understand fair value and identify mispriced options.
2. Risk Management
Options can limit risk for buyers because the maximum loss is the premium paid, while sellers face theoretically unlimited risk (especially naked call sellers). Understanding the payoff structure allows traders to balance reward vs. risk and design hedging strategies.
3. Strategic Flexibility
Options mechanics allow for sophisticated strategies beyond just buying calls and puts. Traders can combine calls, puts, and underlying assets to create strategies like:
Covered Calls – Generating income on existing holdings.
Protective Puts – Hedging against downside risk.
Spreads and Straddles – Leveraging volatility for profit.
Without a solid grasp of how options work, implementing these strategies can become confusing and risky.
4. Timing and Volatility
Time decay (Theta) erodes option value as expiration approaches. Traders must understand how timing affects profitability. Similarly, volatility (Vega) impacts premiums: higher volatility increases option prices, offering potential for greater profit but also higher cost. Ignoring these factors can lead to unexpected losses even if the market moves in the anticipated direction.
5. Hedging and Speculation
Options are invaluable for hedging. For example, an investor holding a long stock position can buy puts as insurance against market decline. Conversely, options can be used for speculation with leverage, allowing traders to control large positions with limited capital. Understanding mechanics ensures these strategies are applied effectively.
Conclusion
Options trading is a dynamic and versatile arena within financial markets. Understanding what options are, the distinction between calls and puts, and the mechanics behind option pricing is essential for anyone looking to trade wisely. Calls allow traders to profit from rising markets, while puts benefit from falling prices. Both offer defined risk for buyers and strategic opportunities when used correctly.
Mastering option mechanics is not just about predicting market direction—it’s about timing, volatility, premium management, and strategic deployment. Traders who understand these nuances can leverage options for hedging, income generation, and speculation, making them one of the most powerful tools in modern finance.

Part 2 Support and Resistance Premium: The Price of an Option
Premium is the amount the option buyer pays to the seller. It is influenced by:
Intrinsic Value
Time to Expiry
Volatility (IV)
Interest Rates
Demand–Supply
Premium tells you how expensive or cheap an option is at a given moment.
