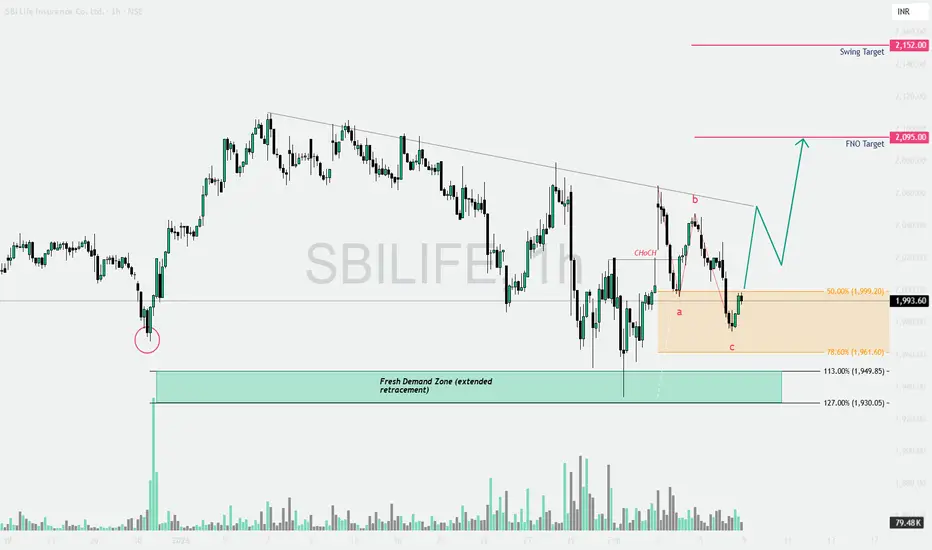
SBILIFE: "Change of Character" Signaling somethingThe Technical Breakdown (Educational Guide)
The chart displays a beautiful confluence of Smart Money Concepts (SMC) and Fibonacci retracement. If you’ve been looking for a textbook "Buy the Dip" setup, this is it! Here are 4 key educational points from this chart:
1. The Choch (Change of Character) ⚡
Notice the label CHoCH on the chart. This occurs when the price breaks the recent lower high in a downtrend. It’s the first signal that the "character" of the market is shifting from Bearish to Bullish. It’s not a full trend reversal yet, but it’s the early warning sign smart traders look for.
2. The ABC Correction Pattern 🔀
After the initial impulsive move up (from the circle), the price entered a three-wave corrective phase labeled a-b-c.
Wave A & B: Short-term volatility.
Wave C: The final "flush out" that traps impatient sellers before the real move starts.
3. Fibonacci "Golden Zone" Confluence 🎯
The price has dipped exactly into the 50.0% (1,999.20) to 78.6% (1,961.60) retracement zone.
This orange box acts as a High-Interest Buy Zone.
Below this, we have a Fresh Demand Zone (extended retracement) between 1,930 – 1,950 for extra safety.
4. Trendline Breakout Anticipation 📉
The grey descending trendline has been capping price for weeks. A breakout above this line, followed by a successful retest, confirms the FNO Target of 2,095 and the Swing Target of 2,152.
📊 Trade Setup Summary
Current Price: ~1,993.60
Entry Zone: 1,960 — 1,995 (Accumulation Zone)
Immediate Target (FNO): 2,095 🎯
Positional Target (Swing): 2,152 🚀
Invalidation: A sustained close below the Fresh Demand Zone (1,930).
⚠️ Disclaimer
This analysis is strictly for educational purposes only.
I am not a SEBI registered analyst.
Please consult your financial advisor before taking any trades.
Market investments are subject to risk.
Community ideas
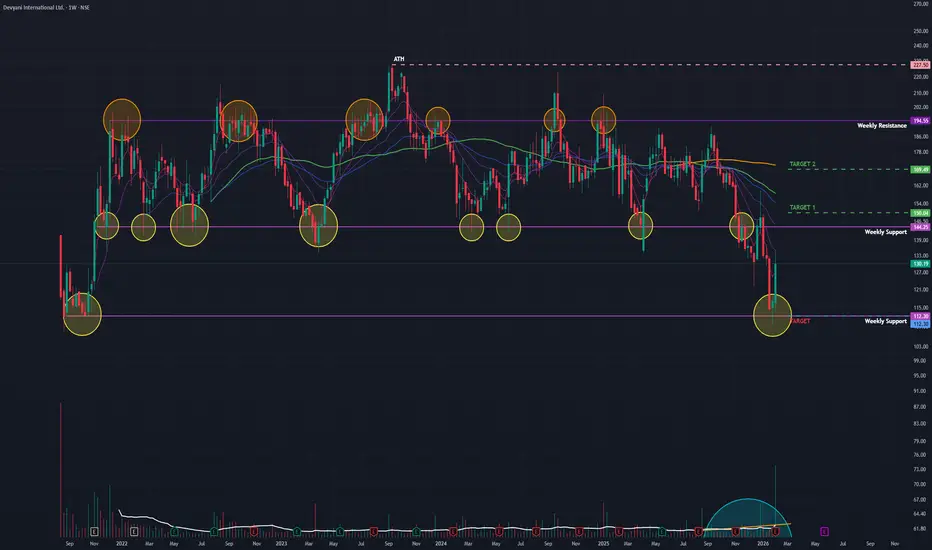
Devyani Int (W): Aggressive Bullish, Turnaround at Major Support(Timeframe: Weekly | Scale: Logarithmic)
The stock has confirmed a major "V-Shape Reversal" from its long-term support zone of ₹110. The surge is backed by "Climax Volume" and a positive reception to its Q3 operational updates, signaling that the 2-year correction might be over.
🚀 1. The Fundamental Catalyst (The "Why")
The technical reversal is driven by a shift in sentiment:
> Q3 FY26 Earnings: The market focused on the positives— Revenue up 11% YoY and operational efficiency improvements—ignoring the bottom-line loss.
> Management Change: The announcement of a new CEO (effective April 1) has been viewed as a positive step for future strategy.
> Valuation Comfort: After falling ~30% in the last year, the stock had priced in most negatives at ₹110.
📈 2. The Chart Structure (The Base)
> The Support (The Floor): At ₹112 level. This zone has been a demand magnet since 2022.
- Confirmation: The Weekly Hammer followed by a massive Green Candle (Marubozu-like) confirms a "Morning Star" type reversal.
> The Volume: The 116 Million volume is an "Institutional Stamp." Retail traders typically cannot generate this volume; it indicates that big funds are "bottom fishing."
📊 3. Technical Indicators
> RSI: Rising from the Oversold zone. This "V-turn" in RSI usually precedes a sharp recovery rally.
> Price Action: The stock has closed above its short-term moving averages (20-Day EMA), signaling a trend shift.
🎯 4. Future Scenarios & Key Levels
The stock is now in "Recovery Mode."
🐂 Bullish Targets (The Pullback Rally):
- Target 1: ₹150.
- Target 2: ₹170.
🛡️ Support (The "Must Hold"):
- Immediate Support: ₹120 – ₹123.
- Stop Loss: A weekly close below ₹110 would invalidate the entire reversal structure.
Conclusion
This is a Grade A Reversal Setup.
> Refinement: The "Hammer" was the signal; the "Earnings Volume" was the confirmation.
> Strategy: The reversal is valid. Use any dip to enter/add.
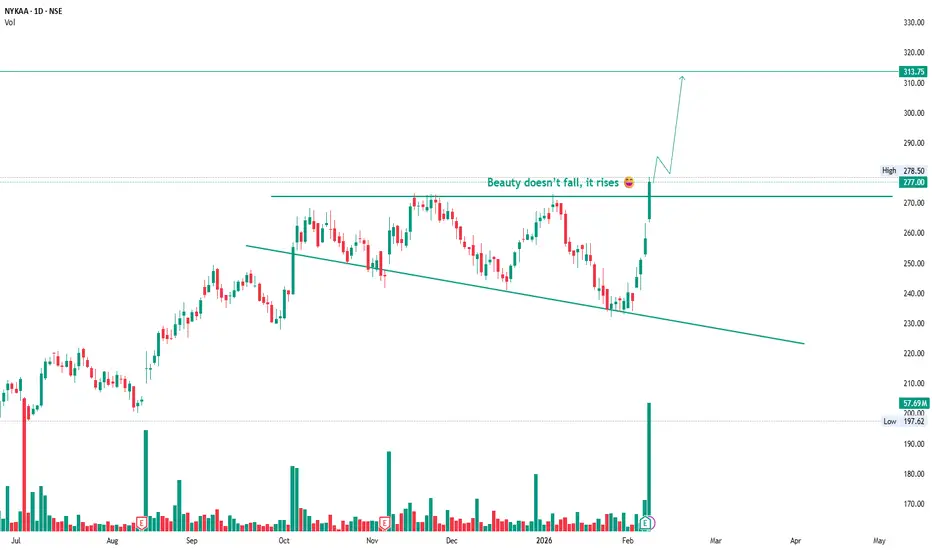
Nykaa: Descending Trendline BreakoutNykaa respected the rising structure even during the correction and never lost its trend strength.
Price held the sloping support, absorbed selling pressure, and then gave a clean breakout above the key horizontal resistance around 277 with strong volume.
This move shows acceptance above resistance — not a fake spike. Buyers waited patiently, and once price cleared the zone, momentum kicked in.
As long as price holds above the breakout level, the path of least resistance remains upward.
Next zone to watch lies near 313, based purely on structure and price projection.
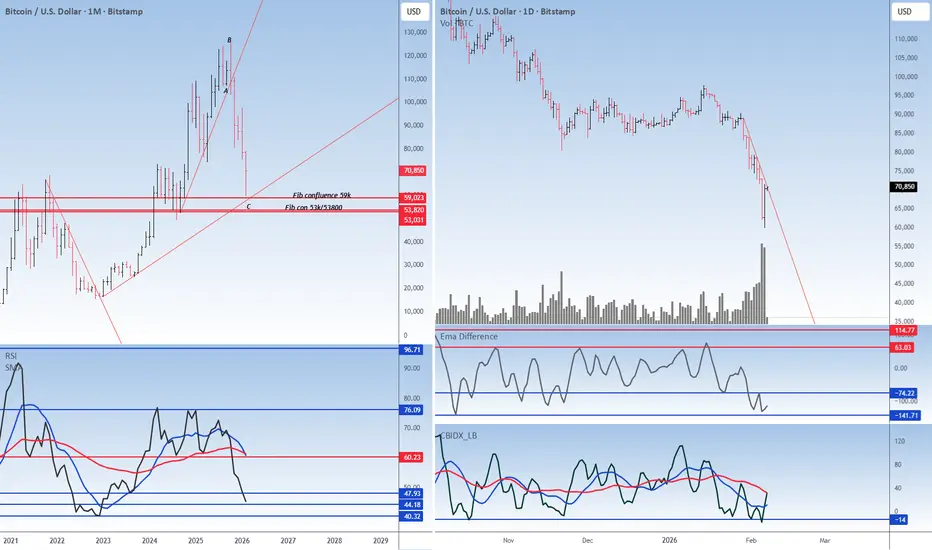
The crypto has found its supportBitcoin CMP $70690
The beauty of looking at various asset classes is that they rise and fall together. In my view the correction in the crypto is over.
Elliott- The v waves within the C wave is done. Hence to me this correction is over.
Fib- The crypto reversed just shy away from the 59K which is the confluence zone on the chart.
Trendline- the same area is also supported with a trendline. Hence the zone is a strong strong support.
Oscillators- All the oscillators are at support. This is yet another indication of strength.
Bar - the daily chart is showing a railway track which is a directional signal.
Capitulation- the huge volume on the bottom is indicating capitulation.
Conclusion- yesterday it was silver that bounced back strongly and bitcoin too which is indicating a reversal.
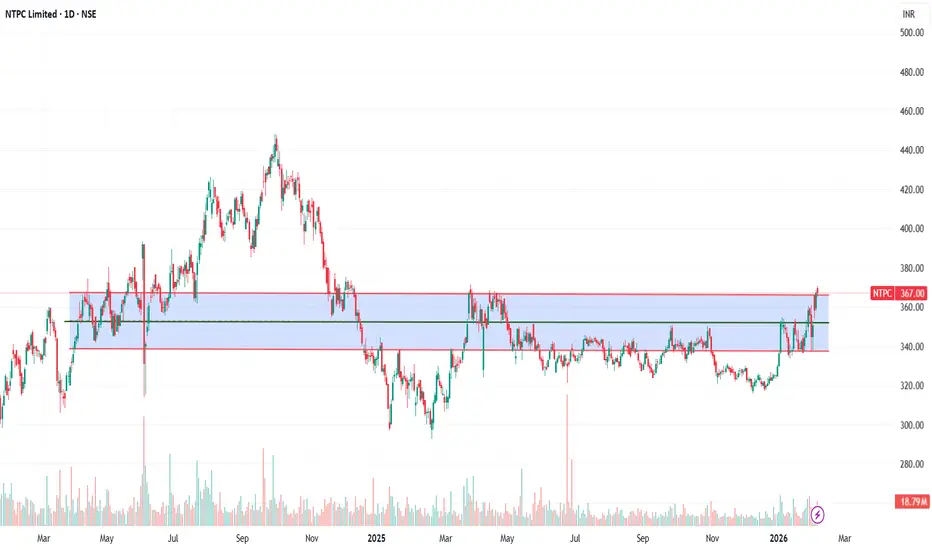
NTPC.. Moved outside the channel..NTPC.. Trying its level best to move.
Selling pressure in market pulled it back and retested the support.
Now things can be interesting..
Moved above this channel then first target can be somewhere around 370, the exact level from where it faced resistance today..
Second can be somewhere around 375 followed by 380..
Above 380, no major resistance till 390..
Downside or inside the channel, first target can be around 353 followed by 340..
Pick your trade accordingly..
All the best..
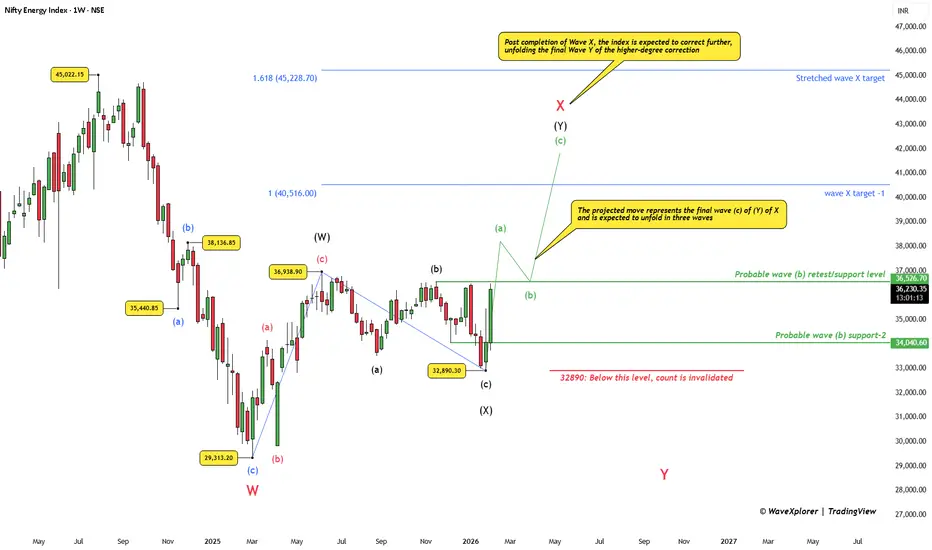
Nifty Energy: Final Bounce Before the Deeper CorrectionThe Nifty Energy Index continues to trade within a higher-degree corrective structure rather than a fresh impulsive uptrend.
The decline from the highs appears to have completed Wave W, followed by an ongoing recovery in Wave X.
In the near term, the structure allows for one more upside phase . After a probable dip in wave (b), the index may attempt a final advance via wave (c) of (Y) of X, which is expected to unfold in three waves.
This move is likely to be selective and constituent-driven. Heavyweights such as Reliance Industries, ONGC, BPCL, Tata Power, SJVN, Suzlon, NTPC, Coal India, and Power Grid Corporation may still show relative strength during this phase, contributing to the final push higher within Wave X.
However, it is important to note that this rise remains corrective in nature . It should be treated as a tactical opportunity rather than the start of a sustained bullish trend.
Once Wave X completes, the larger picture turns decisively bearish.
The index is then expected to enter Wave Y of the higher-degree correction, which could result in a sharp and more brutal decline across energy stocks, particularly if leadership from the heavyweights fades.
Key levels marked on the chart act as reference points, with a clear invalidation level below which the current corrective count would fail.
In summary:
A short-term corrective rise may still be pending, but the dominant risk lies on the downside once Wave X is done .
Disclaimer:
This analysis is for educational purposes only and does not constitute investment advice. Please do your own research (DYOR) before making any trading decisions.
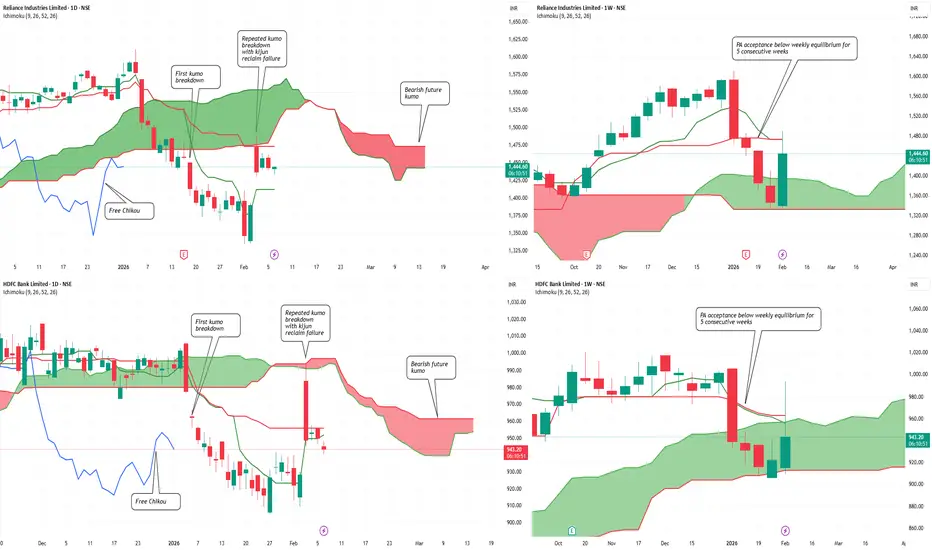
Dead Cat Bounce in Nifty? Heavyweights to Deliver The VerdictDead Cat Bounce in Nifty? Index Heavyweights to Deliver the Verdict Soon…
Both index heavyweights remain structurally weak despite the recent bounce.
On the daily timeframe, Reliance Industries and HDFC Bank have transitioned out of bullish Ichimoku regimes. Crucially, the second daily Kumo breakdown in both stocks overlaps with a failed Kijun-sen reclaim , reinforcing bearish continuation rather than base formation.
The weekly picture strengthens this caution. Price has shown multi-week acceptance below weekly equilibrium across both names, signaling institutional comfort at lower levels . Until price can reclaim and sustain above the weekly mean, the ongoing bounce risks remaining a dead cat rather than evolving into a sustainable trend reversal.
Verdict pending — and it rests squarely with these heavyweights
Long term analysis of Tanla Platforms Ltd.Wrap up:-
As per chart of Tanla Platforms Ltd., it seems that correction in Tanla is over with a wxy pattern in major wave 2 and also, after breakout it has retested the support. Now, major wave 3 is about to start/started.
What I’m Watching for 🔍
As initial breakout is confirmed for a probable target of 961. Complete breakout is confirmed once it breaks and sustains above 756. Low Risk Entry Range is 545-410 for a Probable target of wave y i.e. 961-1221-2097 with a stoploss of 409.
Disclaimer: Sharing my personal view — only for educational purpose not financial advice.
"Don't predict the market. Decode them."

Understanding the Down Trend Line Breakout : Base chart GALLANTTUnderstanding the Down Trend Line Breakout : Base chart GALLANTT ISPAT Ltd
Introduction
Gallantt Ispat Limited, currently trading around 580.00 on its daily chart, has been moving below a persistent down trend line since August 2025. Recently, the stock has shown signs of strength by forming a double bottom pattern, a classic reversal signal, and is now attempting to break above this long-standing resistance. This setup provides an interesting case study for traders and investors on how to interpret down trend line breakouts, manage risks, and identify potential entry points.
What is a Down Trend Line?
A down trend line is drawn by connecting successive lower highs on a chart.
It acts as a resistance line, showing the prevailing bearish sentiment.
As long as price remains below this line, sellers dominate.
A breakout above the line often signals a shift in market psychology from bearish to bullish.
Importance of the Down Trend Line Breakout
Psychological Shift: A breakout indicates buyers are gaining control.
Volume Confirmation: Strong volume during breakout adds credibility.
Trend Reversal Potential: Especially when supported by reversal patterns like the double bottom.
Opportunity Zone: Traders often look for such setups to capture early stages of a new uptrend.
Risk Management in Breakout Trading
Trading breakouts can be rewarding but also risky if false signals occur. Key principles:
Wait for Confirmation: Avoid jumping in on the first candle above the line; look for sustained price action.
Use Stop Losses: Place stops below recent swing lows or the breakout level to limit downside.
Position Sizing: Never risk more than a small percentage of capital on a single trade.
Avoid Emotional Trading: Stick to a plan rather than chasing moves.
How to Enter Down Trend Line Breakouts
Aggressive Entry: Buy immediately on breakout with tight stop loss.
Conservative Entry: Wait for a retest of the trend line (now support) before entering.
Volume-Based Entry: Enter only if breakout is accompanied by above-average volume.
Pattern Confirmation: In Gallantt Ispat’s case, the double bottom adds conviction to the breakout attempt.
Key Takeaways for Investors & Traders
Trend lines matter: They reflect collective market psychology.
Breakouts need confirmation: Volume and sustained price action are crucial.
Risk management is non-negotiable: Protect capital with stops and sizing discipline.
Gallantt Ispat’s setup: The double bottom plus breakout attempt makes this chart worth monitoring closely.
Patience pays: Waiting for confirmation often saves traders from false breakouts.
Conclusion
Gallantt Ispat Limited’s daily chart is at a critical juncture. After months of trading under a down trend line, the stock is now attempting to break free, supported by a double bottom formation. For traders, this is a textbook scenario to study the dynamics of breakout trading. The lesson here is clear: respect the trend line, manage risk diligently, and enter with discipline when the breakout is confirmed.

JK Tyre & Industries Ltd – Weekly Chart Breakout WatchJK Tyre & Industries Limited is currently showing strong momentum, and the price action suggests that the stock may be approaching a fresh breakout above the ₹554 level.
Since this analysis is based on the weekly timeframe, the primary focus will be on a weekly breakout and weekly closing above the mentioned resistance (554). A confirmed close above this level will be considered as valid breakout confirmation.
Chart Structure & Price Action
The stock has recently come out of a 30–40 day consolidation phase
Post consolidation, the stock has formed a strong bullish candle, indicating renewed buying interest.
Price action suggests that the stock is respecting the breakout zone
Breakout Perspective
Breakout Level to Watch: ₹554 (weekly closing basis)
This appears to be an all-time high breakout
If sustained, a new upward phase can potentially begin from here
Momentum traders may consider tracking the stock closely once confirmation is received
Trade Planning & Risk Management
Entry should be considered only after a confirmed breakout
The breakout candle low can be used as a reference for risk management
Alternatively, ₹480 can be considered as an invalidation level
Proper position sizing and risk calculation are essential before entering any trade
What to Do Now
Keep the stock on your watchlist
Monitor weekly price action carefully
Avoid premature entries before confirmation
Further updates will be shared as the structure evolves
Disclaimer
This post represents my personal observations and is shared strictly for educational purposes only.
It is not financial advice.
Please:
Do your own analysis
Consult your financial advisor if needed
Always calculate risk before taking any trade
The financial market involves both opportunity and risk, and disciplined decision-making is essential.
Thank you.
See you in the next update.

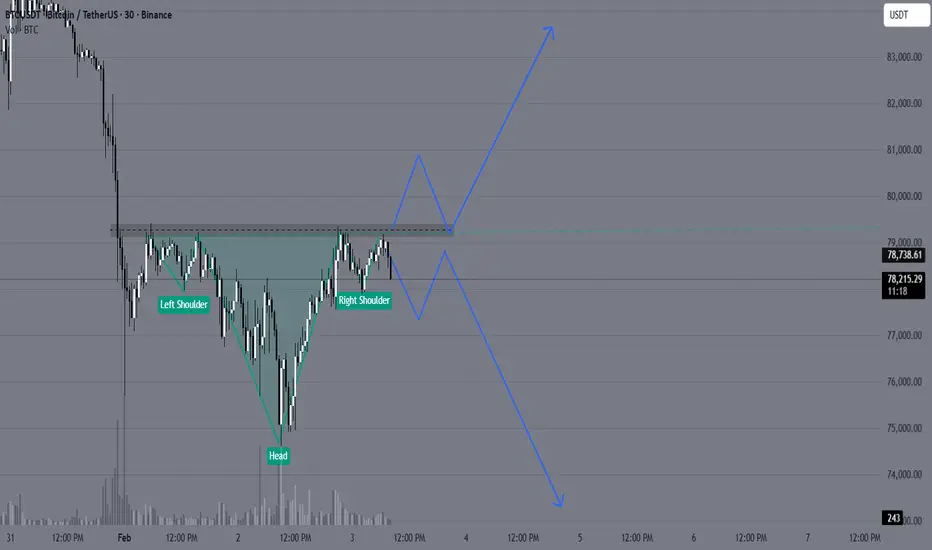
On the 1H chart, $BNB is forming a Head & ShouldersOn the 1H chart, CRYPTOCAP:BNB is forming a Head & Shoulders after a strong sell-off from the 900+ region.
Left Shoulder: ~785–790
Head: ~728 (marked low on chart)
Right Shoulder: ~770–775
Neckline / Supply Zone: 780–785
Current price is trading below the neckline, which keeps the structure bearish unless invalidated.
🔽 Bearish Scenario (Pattern Confirmation)
If price fails to reclaim 780–785 and shows rejection:
First downside: 745–750
Key support retest: 728
If 728 breaks decisively:
Next downside zones: 700 → 680
This aligns with the measured move of the H&S pattern.
🔼 Bullish Invalidation Scenario
The bearish structure is invalid only if:
Strong 1H close above 785
Follow-through acceptance above 790
If that happens:
Short-term recovery toward 810–830
Still a relief bounce, not trend reversal unless higher timeframes flip

Varun Beverages: Formation Near Support | Multi-Target Study📄 Description
Varun Beverages is currently trading near a strong long-term support zone around ₹440–₹450, where price has formed a stable base after a prolonged correction.
The chart shows a descending trendline breakout attempt along with consolidation near Fibonacci support (0–0.22 zone), indicating possible accumulation.
RSI is in the lower range and approaching oversold territory, which suggests selling pressure is weakening and a potential reversal setup is building.
If price sustains above ₹480–₹500, we may see gradual upside momentum toward:
🎯 Short-term: ₹520+
🎯 Medium-term: ₹600+
🎯 Long-term: ₹680+
This setup offers a favorable risk–reward for positional and swing traders.
📌 View: Bullish above ₹450
🛑 Stop-loss: Below ₹430 (daily close)
📈 Trend: Reversal / Recovery Phase
⚠️ Disclaimer: This is only a technical view for study and learning purposes. Not a recommendation to buy or sell. Please do your own research.

BTCUSD might give Structure Shift Now✅ Pattern: Potential Inverse Head & Shoulders
Look closely:
Left dip → around 76.8k
Deep dip (Head) → around 75k
Right dip → higher low near 76.5k
Now price is pushing back up
This is a classic reversal structure.
✅ Important Level: Neckline Resistance
The dotted zone you marked around:
79,000–79,200
That is the neckline / supply cap.
Price is repeatedly testing it.
📌 Until this breaks, structure is still “building.”
✅ Structure Type: Higher Low Creation
This is the most important:
Previous low = 75k
New low = ~76.2k
That means:
Higher Low → Early Bullish Shift
This is how reversals begin.
🚦What’s Needed for Confirmation?
Bullish Confirmation = Break + Close Above 79.2k
If BTC closes above that zone:
✅ Structure break
✅ Trend reversal likely
✅ Next targets:
80.5k
82k
84.4k (major resistance)
⚠️ Bearish Risk
If price rejects again and breaks below:
76.5k support
Then structure fails and BTC can revisit:
75k
73.8k
📌 Conclusion
BTC is creating a structure:
✅ Base + Range
✅ Higher Low
✅ Possible Inverse H&S
⏳ Waiting for neckline breakout
Texas Instruments breaks into price discovery above ATH1 Trend is constructive and the breakout came after a long base, not a random spike
2 The old high was reached, tested, then broken, now price is in discovery
3 The key is whether the market can hold above the breakout zone and stay accepted there
4 Pattern labels are visual context only, they are not required for the signal logic
5 Silent Flow is active, it confirms direction and state, but it does not promise a smooth ride
6 Scenario A is acceptance above the old high, trend can keep working higher
7 Scenario B is a slip back below the old high, then it starts to look like a failed push and price must prove demand again

TRADINGVIEW IS LOOKING FOR A NEW INDIAN REGION MODERATOR!Join Our Team: Exciting Opportunity to Become a Moderator for the Indian Region Community at TradingView!
Hello TradingView Enthusiasts,
Are you passionate about trading and the TradingView platform? We are on the lookout for a new moderator to join our INDIAN REGION Community and help elevate the experience for users like you.
As a moderator, your role is pivotal. You'll guide members, ensure adherence to our community standards, and help users maximize their TradingView experience. This is your chance to shine and directly influence the community dynamics while ensuring a friendly and respectful environment.
The General Tasks are:
✅ Replying to user inquiries that might get sent to you.
✅ Welcoming and encouraging new users
✅ Help reward and recognize users through TradingView Boosts and Editors Picks.
✅ Keeping the peace in our chat rooms
✅ Helping ensure that the site rules are followed
✅ Help maintain the quality of the site - eg unsuggesting poor ideas and untagging non-educational posts.
✅ Being visible - keep posting your ideas, chat with users, post comments on users' ideas etc
While this is an unpaid volunteer position, the benefits are substantial:
✅ Exclusive Access : Engage directly with our internal team, including the founders.
✅ Influence Development : Provide input on platform enhancements and new functionalities.
✅ Free Plan : Enjoy a free ULTIMATE account along with free data packs and exclusive merchandise.
✅ Boost Your Profile : Gain significant exposure, increase your follower count, and enhance your presence across the site.
✅ Career Opportunities : Many of our moderators have transitioned into full-time roles, using this position as a stepping stone to further their careers within TradingView.
We are looking for a Community Leader. We're looking for someone who:
✅ Has in-depth knowledge of the TradingView platform.
✅ Maintains a strong reputation within the community through high-quality content and helpful interactions.
✅ Engages positively with community members, respects diverse opinions, and upholds our community standards.
✅ Can dedicate at least one hour daily to moderating and supporting the community.
✅ Has been an active, respected TradingView member for over six months with minimal rule violations.
✅ Possesses solid general trading knowledge and can communicate effectively in both spoken and written English.
A good indication of this is:
✅ 100 or more posted trade ideas
✅ Have posted educational ideas
✅ Consistently get likes for your posted ideas (quality over quantity)
✅ 100 or more genuine followers
✅ Interact in Minds
✅ Regularly respond to comments on your own and others posts
✅ Have created and posted a Script
You don't need to have done all of these things, but it does help you stand out in the crowd and demonstrate you are familiar with multiple areas of our site.
Think this could be you? Learn more about what it means to be a moderator here:
www.tradingview.com
Ready to apply? Please fill out this form in English:
forms.gle/bsdGF1hw64wc3Epq6
🤔 If you have any questions or need further information, feel free to reach out to @zAngus .
We're excited to see who will join our team next and help us continue to provide a world-class trading community experience.
Warm regards,
💖 TradingView Team

Market Outlook & Trade Setup – Monday, 2nd Feb 2026Major indices corrected heavily yesterday during the Budget announcement due to the increase in STT in F&O and no respite in LTCG.
Nifty, Sensex and Bank nifty went minus by almost 500,1200 and 1500 points respectively. We expect the selling to continue further. Additionally, the selling in metals could continue as global tensions between US-Nato and Russai-Ukraine seems to be improving, so the focus could shift on stocks again.
🔹 NIFTY (Broke 100 MA)
* Previous Close: 24,825
* Expected Range: 24,500 – 25,000
🔹 SENSEX (Broke 100 MA)
* Previous Close: 80,723
* Expected Range: 80,000 - 81,000
🌍 Global & Market Sentiment
* DJIA: -179 | S&P: - 30
💰 Institutional Activity (Cash Market)
* FII: Net Sellers: - ₹ 588 Cr
* DII: Net Buyers: - ₹ 683 Cr
🔥 Events this Week:
India - S&P Global Manufacturing PMI (Jan)
📌 Sectoral Focus (Negative)
Metal, Energy, PSU Bank
👉 Commodities in Focus: Gold, Silver, Copper, Crude, Natural Gas
✌️Important Quarterly Results: Aarti, CUB, Indus Tower, Tata Chem, UPL
📈 Trade smart. Manage risk. Stay disciplined.

PTL Trade SetupCurrent Market Price (CMP): 41.50
Breakout Context: Consolidation breakout confirmed yesterday with strong volume, which adds conviction.
Target: 46.62 (approx. +12.3% from CMP)
Stop Loss: 40.03 (risk of about -3.5% from CMP)
Key Notes
- A breakout with volume often signals genuine momentum, but watch for retests of the breakout zone.
- If price dips near 41.00–40.50 but holds above stop loss, that’s a healthy retest.
- Trail your stop loss upward if price moves strongly toward the target to lock in gains.

KAYNES above 3427 – Breakout or Pullback?KAYNES Technology India has strong long-term earnings growth and good profit and revenue growth over recent years, supported by expanding electronics & EMS market trends.
The stock trades with a relatively high P/E but is backed by a firm order book and industry relevance.
Despite recent volatility and technical sell signals, some brokerages maintain positive long-term growth outlooks, and key quarterly results are due soon.
The stock has bounced off the recent low near 3300 after forming a double bottom, and is now approaching a historically important resistance zone at 3517–3568. Price action around this area will likely define the next directional move.
Bearish Scenario:
If KAYNES gets rejected at 3517–3568 and fails to hold, we could see a pullback toward 3427 — an important psychological and short-term support level, and the closest invalidation point for the bulls. If trades further down below 3427 then next target 3335
Bullish Scenario:
If price breaks above and sustains above 3568, that could unlock further upside with a target around 3690.
3427 will be a major pivot, bulls are likely to defend it strongly, and a clean break below with follow through selling would confirm bearish strength.
I am not sebi registered financial advisor.

Breakout soon Arman Financial Symmetrical Triangle Breakout Setup
RSI near 60 and rising
Trading above EMA50
Volume increasing
2+ yrs of consolidation
Enter after breakout confirmation!
Disc: for study, DYOR

Expecting audcad sell delivery for buy setupsBetween these two red lines inside weekly+daily imb, the set-up could be find for buys
Why? Price already taken the liquidity above and it possible scenario
shows the probability
of retracement ( where structure shift indicates sellside delivery,
however buys will be
more safer approach fundamentally
and technically both .
Fundamental reason : aud have strong
intrest rate i.e (3.6%)
whereas CAD indicates 2.25%
And Technically it's bullish orderflow .🤝

PAGEIND M PATTREN BREAKDOWN 31 01 2026📈 1) Pageind Pattern Structure: M-Pattern / Double Top
An M-Pattern (Double Top) is a bearish reversal pattern with the following components:
Left Top → Right Top ≈ equal highs
Neckline → horizontal support connecting the swing lows between tops
Breakdown → close below the neckline confirms the pattern
CHART LINES :
🔴 Double Top Peak (Both Tops): ~50500
🟢 Neckline / Base Low: ~34000
Support Line : ~17600
👉 This creates a classic M-Pattern.
2) Price Projection (Measured Move)
Calculation: Percentage Move from Neckline to Bottom Target
Top: 50,500
Neckline: 34,000
The distance from Top to Neckline is: 50,500 − 34,000 = 16,500
Measured from the neckline downward, the target projection is:
34,000−16,500=17,500
Your next major support is ~17,600, which is almost exactly the measured move target.
Now, calculate the % move from Neckline (34,000) to Target in downside (17,600):
34,000−17,600
So:
✅ Projected target from neckline to support ~17,600 ⇒ ~48% decline
📊 3) Daily Breakdown Confirmation
I noted that the last two days have broken down below the neckline:
A close below neckline signals a confirmed breakdown

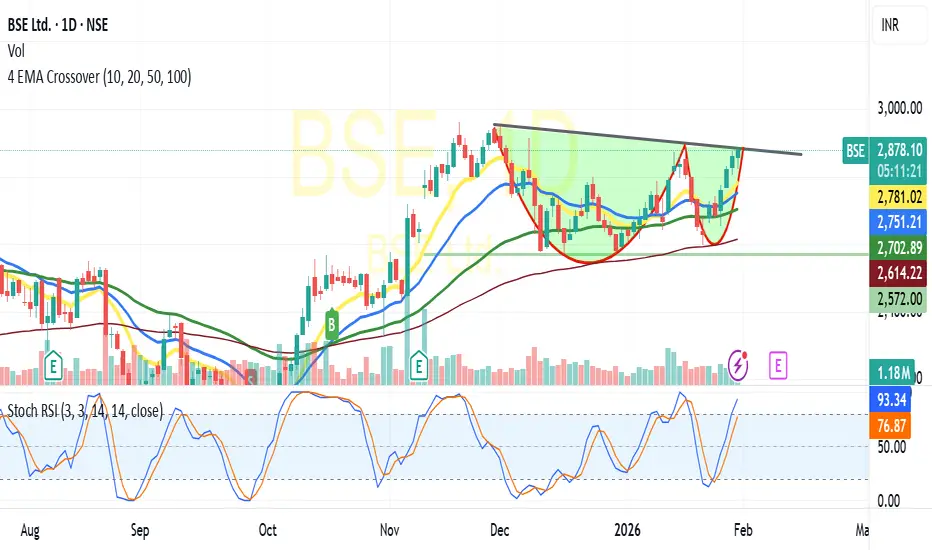
BSE-Likely Cup &Handle Break outBSE:
Trading at 2881 and above all its critical Moving averages Viz10/20/50/10 DEMA
In daily chart has formed C&H Pattern,
Based on the pattern and price volume suggests -breaking the Neckline resistance at 2880-2900 likely to test 2950/3000+ shortly(For educational purpose only)
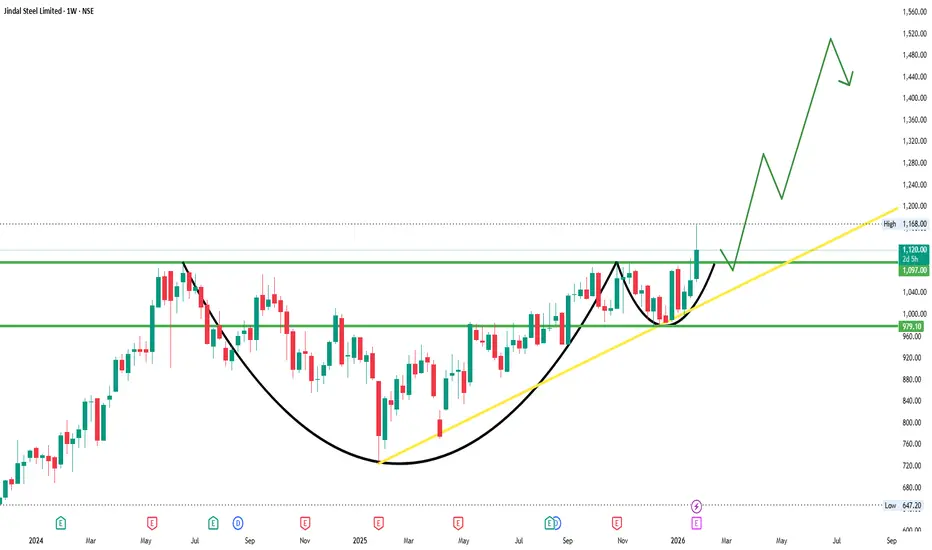
JINDALSTELJINDALSTEL
bullish trend is Showing on the chart.
buy signals in
technical indicators and
cup with handle & ascending triangle chart pattern.
BUYING RANGE 1090/1100
Watch for a breakout above 1090/1100 to sustain the bullish trend. If the resistance holds, there could be a retest towards 975/980 and an uptrend from here.