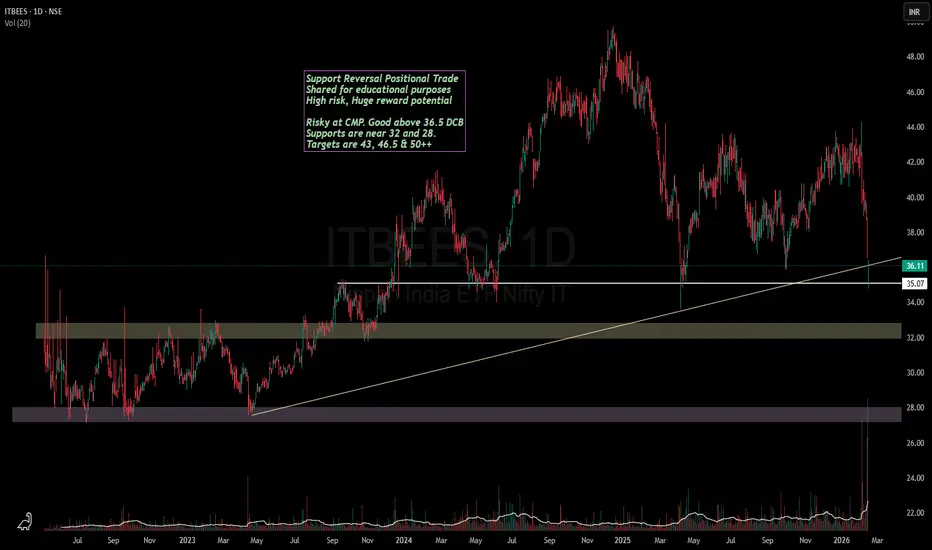
Investing:Nifty IT is looking good for long term accumulation!If you have been following the tech related news lately, it has been about the new AI "revolutionary" tool named Anthropic.
And the same is visible on charts of Nifty IT.
TCS is available at a price at which it was trading in December 2020.
Infy has just broke a crucial support.
Wipro has always been the weakest of 3.
So what next?
My opinion is that the fall is now almost in the end stage. The accumulation has already started on Friday as we have seen some good recovery by end of the day.
However, A SL hunting move near 32-34 zone might come as a formation of a lower low with RSI divergence in Nifty ITBEES which is where one needs to be careful.
We might also see some rebalancing & restructuring in IT index soon. However, these large companies are operating since past many decades and are here to stay at least for a few more.
These are the kind of dips which should be mouth watering for long term investors as the valuations are now dirty cheap.
The levels which i mentioned are my personal opinion shared for educational purposes and should not be considered as a recommendation.
Trend Lines
Part 1 Institutional Option Trading VS. Technical Analysis Core Philosophy
Institutional Option Trading (IOT)
Institutions like hedge funds, quant desks, proprietary trading desks, banks, and market makers trade options based on:
Order-flow dominance
Risk-neutral hedging
Volatility arbitrage
Liquidity extraction
Portfolio hedging strategies
Macro + quantitative modeling
They don’t focus on chart patterns.
They focus on controlling volatility, absorbing liquidity, and managing large risk exposure.
Technical Analysis (TA)
Retail and discretionary traders use price charts to:
Find patterns
Identify support & resistance
Predict breakouts
Understand market psychology
Time entries and exits
Trendlines, indicators, candlestick patterns = core decision drivers.
👉 TA looks at price.
IOT looks at order flow + volatility.

Sensex - Weekly review Feb 16 to Feb 20The price is between the resistance at 83k and the support at the 81700 zone. The gap towards the 81700 zone will get filled if the price gets more bearish. In the daily chart, there is a trend line support at the 81700 zone.
If the price opens flat, buy above 82620 with the stop loss of 82500 for the targets 82740, 82860, 82980, 83120, 83280, 83400, 83540 and 83760.
Sell below 82400 with the stop loss of 82540 for the targets 82280, 82140, 82020, 81840, 81700 and 81540.
Please always do your analysis before you take any trade.

RECOVERY from our demand zone! Will it sustain!?as we can see NIFTY did show a strong sign of reversal and managed to close above our demand zone which changed changed bias from selling or side to buy-in on dips hence as long as NIFTY manages to sustain itself above the demand zone, it could remain bullish unless the mother candle formed today's low is breached so plan your trades accordingly and keep watching everyone.

Bearishness to continue!!?As we can see NIFTY is back trading in our demand zone and has also closed below it showing signs of bearishness hence if no signs of reversal is seen from here then NIFTY can continue its bear run as 25500 being a pscyhological level will act as a resistance now hence until and unless NIFTY manages to sustain itself above the demand zone, every rise can be sold for next demand zone so plan your trades accordingly and keep watching everyone.

Nifty Intraday Analysis for 17th February 2026NSE:NIFTY
Index has resistance near 25875 – 25925 range and if index crosses and sustains above this level then may reach near 26125 – 26175 range.
Nifty has immediate support near 25475 – 25425 range and if this support is broken then index may tank near 25225 – 25175 range.
Upside momentum is capped by mounting geopolitical tensions in the Middle East. Any positive opening is expected to be met with selling pressure.

Banknifty Intraday Analysis for 17th February 2026NSE:BANKNIFTY
Index has resistance near 61350 – 61450 range and if index crosses and sustains above this level then may reach near 61850 – 61950 range.
Banknifty has immediate support near 60550 - 60450 range and if this support is broken then index may tank near 60050 - 59950 range.
Upside momentum is capped by mounting geopolitical tensions in the Middle East. Any positive opening is expected to be met with selling pressure.

Finnifty Intraday Analysis for 17th February 2026 NSE:CNXFINANCE
Index has resistance near 28525 - 28575 range and if index crosses and sustains above this level then may reach near 28800 - 28850 range.
Finnifty has immediate support near 28075 – 28025 range and if this support is broken then index may tank near 27800 – 27750 range.
Upside momentum is capped by mounting geopolitical tensions in the Middle East. Any positive opening is expected to be met with selling pressure.

Midnifty Intraday Analysis for 17th February 2026NSE:NIFTY_MID_SELECT
Index has immediate resistance near 13750 – 13775 range and if index crosses and sustains above this level then may reach 13900 – 13925 range.
Midnifty has immediate support near 13500 – 13475 range and if this support is broken then index may tank near 13350 – 13325 range.
Upside momentum is capped by mounting geopolitical tensions in the Middle East. Any positive opening is expected to be met with selling pressure.

Nifty Intraday Analysis for 16th February 2026NSE:NIFTY
Index has resistance near 25675 – 25725 range and if index crosses and sustains above this level then may reach near 26925 – 25975 range.
Nifty has immediate support near 25275 – 25225 range and if this support is broken then index may tank near 25025 – 24975 range.
Upside momentum is capped by mounting geopolitical tensions in the Middle East and ongoing AI disruption. Any positive opening is expected to be met with selling pressure.

Banknifty Intraday Analysis for 16th February 2026NSE:BANKNIFTY
Index has resistance near 60600 – 60700 range and if index crosses and sustains above this level then may reach near 61100 – 61200 range.
Banknifty has immediate support near 59800 - 59700 range and if this support is broken then index may tank near 59300 - 59200 range.
Upside momentum is capped by mounting geopolitical tensions in the Middle East and ongoing AI disruption. Any positive opening is expected to be met with selling pressure.

Finnifty Intraday Analysis for 16th February 2026 NSE:CNXFINANCE
Index has resistance near 28300 - 28350 range and if index crosses and sustains above this level then may reach near 28575 - 28625 range.
Finnifty has immediate support near 27900 – 27850 range and if this support is broken then index may tank near 27625 – 27575 range.
Upside momentum is capped by mounting geopolitical tensions in the Middle East and ongoing AI disruption. Any positive opening is expected to be met with selling pressure.

Midnifty Intraday Analysis for 16th February 2026NSE:NIFTY_MID_SELECT
Index has immediate resistance near 13750 – 13775 range and if index crosses and sustains above this level then may reach 13900 – 13925 range.
Midnifty has immediate support near 13500 – 13475 range and if this support is broken then index may tank near 13350 – 13325 range.
Upside momentum is capped by mounting geopolitical tensions in the Middle East and ongoing AI disruption. Any positive opening is expected to be met with selling pressure.

Part 3 Technical VS. InstitutionalThe "Greek" Influence
Professional traders don't just look at the stock price; they look at "The Greeks." These mathematical values explain how an option’s price might change:
Delta: Measures how much the option price moves for every $1 move in the stock.
Theta: This is time decay. Options lose value every day they get closer to expiration. Theta is the "silent killer" for buyers.
Vega: Measures sensitivity to implied volatility. If the market expects a massive move (like during earnings), Vega increases the premium.

Part 1 Technical VS. Institutional The Core Mechanics: Calls and Puts
To understand options, you must first master the two primary instruments:
Call Options (The Right to Buy)
When you buy a Call, you are "bullish." You believe the stock price will go up.
The Right: You have the right to buy 100 shares at a set price (the Strike Price).
The Goal: If the stock price rises above your strike price before the expiration date, you can buy those shares at a discount or sell the contract for a profit.
Put Options (The Right to Sell)
When you buy a Put, you are "bearish." You believe the stock price will go down.
The Right: You have the right to sell 100 shares at the Strike Price.
The Goal: If the stock price falls below the strike price, your contract becomes more valuable because it allows you to sell the stock for more than its current market value.

Nifty Intraday Analysis for 13th February 2026NSE:NIFTY
Index has resistance near 26000 – 26050 range and if index crosses and sustains above this level then may reach near 26250 – 26300 range.
Nifty has immediate support near 25600 – 25550 range and if this support is broken then index may tank near 25350 – 25300 range.
The market is expected to open in the green with the range bound momentum. However, profit booking may pull the index lower in the end session.

Banknifty Intraday Analysis for 13th February 2026NSE:BANKNIFTY
Index has resistance near 61150 – 61250 range and if index crosses and sustains above this level then may reach near 61650 – 61750 range.
Banknifty has immediate support near 60350 - 60250 range and if this support is broken then index may tank near 59850 - 59750 range.
The market is expected to open in the green with the range bound momentum. However, profit booking may pull the index lower in the end session.

Finnifty Intraday Analysis for 13th February 2026 NSE:CNXFINANCE
Index has resistance near 28600 - 28650 range and if index crosses and sustains above this level then may reach near 28875 - 28925 range.
Finnifty has immediate support near 28150 – 28100 range and if this support is broken then index may tank near 27875 – 27825 range.
The market is expected to open in the green with the range bound momentum. However, profit booking may pull the index lower in the end session.

Midnifty Intraday Analysis for 13th February 2026NSE:NIFTY_MID_SELECT
Index has immediate resistance near 14025 – 14050 range and if index crosses and sustains above this level then may reach 14175 – 14200 range.
Midnifty has immediate support near 13775 – 13750 range and if this support is broken then index may tank near 13625 – 13600 range.
The market is expected to open in the green with the range bound momentum. However, profit booking may pull the index lower in the end session.

Nifty 50 for 16 Feb 2026Important levels and trendlines for Nifty 50.
Disclaimer: This is for educational purposes only. Trading involves risk. Please consult with a SEBI-registered advisor before making any financial decisions.

Part 3 Technical Analysis Vs. Institutional Option TradingBreakout Strategy (Options Buying)
Perfect during:
✔ High volatility
✔ News-driven moves
✔ Index breakout/breakdown
Setup
Mark key levels: yesterday high/low, intraday range
Wait for high-volume breakout
Buy ATM call for upside, ATM put for downside
Benefits
Best RR ratio. Trend moves explode premiums quickly.

Trendline breakout with high volumeA long trendline breakout at very low levels could reverse the market structure from lower lows to higher highs
According to your risk , 3 targets are locked with strict stoploss

Nifty Intraday Analysis for 12th February 2026NSE:NIFTY
Index has resistance near 26150 – 26200 range and if index crosses and sustains above this level then may reach near 26400 – 26450 range.
Nifty has immediate support near 25750 – 25700 range and if this support is broken then index may tank near 25500 – 25450 range.
The market is expected to remain positive with upside momentum and rejection near the resistance zone.
