CAMS 1 Week TIme Frame 📊 Key current context
The stock is trading around ₹4,020 to ₹4,040 (approx).
52-week range: ~₹3,031 (low) to ~₹5,367 (high).
Technical pivot data shows weekly support/resistance and pivot levels.
If price holds above ~₹3,900-₹4,000 zone and shows strength, a move toward ~₹4,100-₹4,150 is plausible.
If price breaks below ~₹3,900 decisively, then ~₹3,800 and even ~₹3,670 could become the next zones to watch.
Break above ~₹4,150-₹4,200 would increase odds of testing ~₹4,300-₹4,400 zone.
⚠️ Things to watch & caveats
The technical levels are approximate and different sources give slightly different numbers; always use stop-loss discipline.
Weekly charts smooth out short-term noise, but in volatile sectors things can move fast.
Always check for upcoming news, earnings, macro conditions, as these can override technicals.
These levels are not guaranteed entry/exit signals — treat them as potential zones.
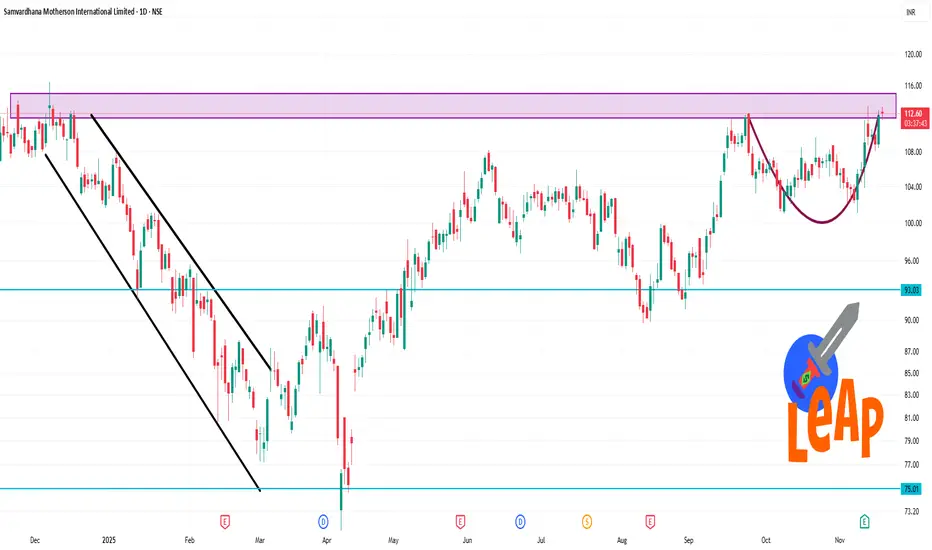
Trend Lines

MOTHERSON 1 Day Time Frame 📊 Latest Price & Range
Last traded around ₹112.40 (as of 20 Nov 2025) on NSE.
Day’s intraday high ~ ₹113.39, intraday low ~ ₹111.78.
52-week range: ~₹71.50 (low) to ~₹116.38 (high).
✅ What to Watch Today
If price holds above ~₹112.50 and moves toward ~₹113.50-₹115, bullish bias.
If price fails to hold support near ~₹111.50 or drops below ~₹110, risk of pull-back.
Volume & broader auto-ancillaries sector trend will matter — weak sector may weigh.
Time-frame is short (intraday / daily) so tight stops and quick reactions recommended.
New Traders’ Mistakes That They Should Avoid1. Trading Without a Proper Plan
One of the biggest and most common mistakes is trading without a plan. Many beginners jump into the market based on tips, social media signals, or impulses. They take trades without having clear entry criteria, stop-loss levels, or profit targets. Trading without a strategy is like driving without direction—you may reach somewhere, but not where you intended.
A good trading plan should include:
Market selection (stocks, forex, commodities, crypto, etc.)
Timeframe you want to trade
Entry and exit conditions
Risk management rules
Position sizing
Maximum daily or weekly loss limit
A plan provides structure and minimizes emotional decisions.
2. Ignoring Risk Management
Risk management is the backbone of successful trading, yet beginners often overlook it. Many new traders risk too much on a single trade or avoid using stop-loss orders because they are “sure” the price will move in their favor.
Typical risk-management mistakes include:
Risking more than 2% of account capital per trade
Not placing a stop-loss
Moving the stop-loss further away to avoid exiting
Using high leverage without understanding it
Effective risk management ensures that a few losing trades don’t destroy your entire account. Professionals understand that preservation of capital is more important than chasing big profits.
3. Overtrading and Revenge Trading
New traders often feel pressured to be in the market constantly. Overtrading happens when traders take too many trades, even when there is no clear setup. This usually leads to emotional decisions and unnecessary losses.
Another related mistake is revenge trading, where traders try to quickly recover losses by placing impulsive trades. This behavior results in even bigger losses.
To avoid this, trade only when your setup appears. Quality beats quantity.
4. Letting Emotions Drive Decisions
Trading is a psychological game. Fear, greed, hope, and frustration are powerful emotions that influence new traders. Examples include:
Greed leading to holding positions too long
Fear preventing you from entering a good setup
Hope making you avoid closing a losing trade
Frustration causing revenge trades
Emotions cloud judgment and break discipline. Successful traders follow logic, not feelings. Practicing discipline and sticking to your plan is key to long-term success.
5. Using Too Much Leverage
Leverage amplifies gains—but also losses. New traders are often attracted to high leverage because it allows larger positions with small capital. However, even small market movements can wipe out the account.
For example, in forex or futures, 1:50 or 1:100 leverage can be extremely risky if not used properly.
To avoid this mistake:
Start with low leverage
Use proper position sizing
Understand margin requirements and liquidation risk
Smart traders treat leverage like a sharp tool—useful, but dangerous if mishandled.
6. Not Keeping a Trading Journal
Most beginners take trades and move on without analyzing what went right or wrong. Without a trading journal, you cannot identify patterns in your behavior or strategy.
A trading journal should record:
Date and time of entry
Chart screenshot
Entry/exit price
Stop-loss and target
Result of the trade
Emotions and reasoning behind the trade
This habit helps improve discipline and refine your system.
7. Following Tips, Noise, and Social Media Signals
Many new traders rely on tips from friends, influencers, Telegram groups, or YouTube videos. The problem is that most of these sources do not explain the logic behind the trade or the risk involved. Acting on tips without understanding the market leads to blind trading and quick losses.
Instead:
Learn technical and fundamental analysis
Understand the reason behind every trade
Follow a tested strategy, not random opinions
Smart traders trust data, not noise.
8. Unrealistic Expectations of Fast Wealth
The biggest psychological trap for new traders is the belief that trading will make them rich quickly. This mindset pushes traders to take oversized risks, leading to frequent blow-ups.
Successful trading requires:
Years of learning
Discipline and emotional control
Proper risk management
Realistic expectations
Think long-term and focus on consistency rather than big, quick profits.
9. Not Understanding Market Conditions
Markets don’t behave the same every day. Sometimes they trend strongly; other times they move sideways or show high volatility. New traders often use the same strategy in all market conditions, leading to losses.
Understanding market phases helps you adapt your strategy. For example:
Trending markets favor breakout or trend-following strategies
Sideways markets favor range trading or mean reversion
High volatility requires wider stop-loss and smaller positions
Adapting to market conditions drastically improves performance.
10. Lack of Patience
Patience is a superpower in trading. New traders often:
Enter too early
Exit too early
Fail to wait for confirmation
Want every trade to be profitable instantly
Markets reward patience and punish impulsiveness. Waiting for the perfect setup improves win rates and reduces unnecessary losses.
11. Not Practicing on Demo/Backtesting
Many beginners jump straight into live trading without testing their strategy. This is like flying a plane without training. Practicing on a demo account helps you understand:
Market movements
Platform functions
Strategy performance
Emotional reactions
Backtesting on historical data helps validate your strategy’s reliability.
12. Ignoring News and Economic Events
Major economic events—like interest rate decisions, CPI data, jobs reports—can cause sharp market movements. Beginners often get trapped when they trade unknowingly during high-impact events.
Always check the economic calendar before entering a trade.
Conclusion
New traders often fail not because markets are impossible, but because they repeat common, avoidable mistakes. Success in trading comes from discipline, risk management, continuous learning, and emotional control. By avoiding the mistakes listed above and building a strong foundation, new traders can gradually develop the skills required to navigate the financial markets confidently.
Candle Patterns Explained Candlestick patterns are one of the most powerful tools in technical analysis. They help traders understand price movements, market psychology, and potential trend reversals. Each candlestick represents four key data points for a specific time frame: Open, High, Low, and Close (OHLC). The body shows the open and close, while the wicks (shadows) show the high and low. By studying these candles in combinations, traders can forecast upcoming market moves.
1. Bullish Candlestick Patterns
2. Bearish Candlestick Patterns
3. Continuation Candlestick Patterns
Why Candlestick Patterns Matter
Candlestick patterns work because they capture market psychology — fear, greed, indecision, and momentum. When combined with volume, support-resistance, and trend analysis, they become a highly effective decision-making tool for traders.

Nifty Is on track !We are in good shape looking at nifty's current price trend.
The middle of the channel around 26300 to 26500 is what I am expecting nifty to be by the end of november, further longs can only be done once we cross the middle of the channel otherwise we can see some correction. Look out for the middle of the channel.

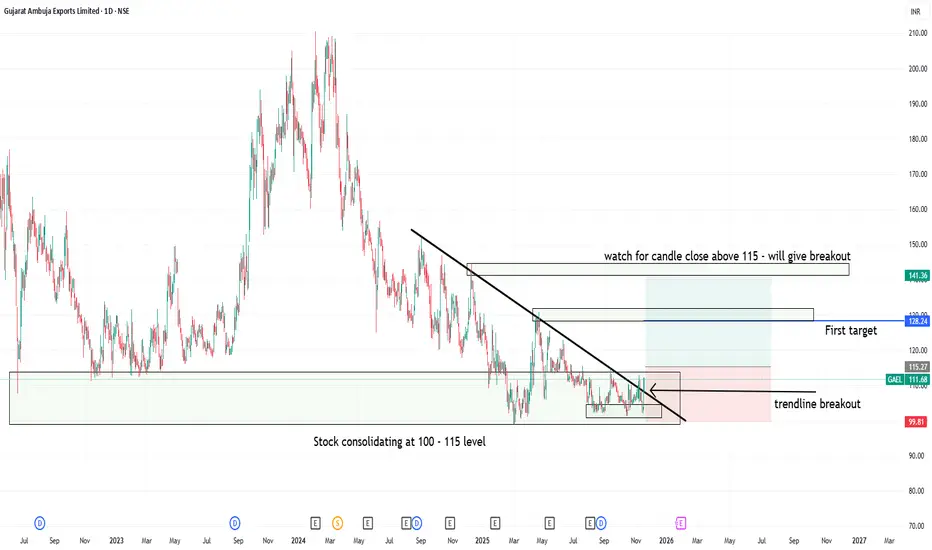
Trendline breakout at support level in GAEL1. Gujrat ambuja export lt- showing consolidation at 100 to 115 levels
2. Candle close above 115 can trigger consolidation breakout at strong support zone
3. Trendline breakout has already happend but above 115 close will be safe and logical
4. Good Risk:Reward one can watch for upside movement with strict sl level
Advanced Hedging Techniques1. What Makes Hedging “Advanced”?
Basic hedging uses straightforward tools like:
Buying puts to protect long positions
Selling futures against a portfolio
Using simple covered calls
Advanced hedging goes several steps deeper, using:
Multi-leg derivatives
Volatility-based adjustments
Dynamic delta/gamma balancing
Cross-asset risk offsets
Market-structure aligned protection
Time decay and IV crush advantage
Partial, rolling, and ratio hedging
The idea is simple: Instead of eliminating risk completely, advanced hedging balances risk and return to improve profitability over time.
2. Dynamic Delta Hedging
One of the core concepts in advanced hedging is delta hedging, primarily used by option writers, institutions, and algorithmic traders.
How it works:
Every option has delta, which measures how much the option’s price moves relative to the underlying.
A trader continuously adjusts futures or stock positions to keep the overall delta close to zero.
For example:
You sell a call option with delta +0.4
To hedge, you short 40 shares (or equivalent futures)
As the market moves, delta changes, so you rebalance (buy/short) to stay delta-neutral.
Why it’s advanced:
Requires constant monitoring
Involves forecasting volatility shifts
Needs strong understanding of Greeks
Delta hedging is the backbone of market-neutral strategies, used heavily by HFTs, prop desks, and market makers.
3. Gamma Scalping
Gamma scalping is an advanced extension of delta hedging.
Key idea:
When you buy options, you gain positive gamma.
Positive gamma lets you profit from intraday price swings, provided you adjust delta actively.
Example:
You buy a straddle (long gamma).
When market moves up, you sell futures at higher price.
When market dips, you buy futures at lower price.
Even if the option decays, this scalping around volatility can outperform theta loss.
Why advanced?
Requires rapid execution and discipline
Depends on volatility forecasts and market structure
Works best in high VIX environments
Many algorithmic strategies use gamma scalping to capture volatility spikes.
4. Ratio Hedging
Instead of a 1:1 hedge, advanced traders use ratio hedging to reduce cost and maximize coverage efficiency.
Example
You hold:
100 shares of a stock
Instead of buying 1 put, you buy:
0.75 puts (3/4th hedge) to reduce premium cost
Or in F&O:
You hedge an equity portfolio with Nifty futures at 0.7 ratio
This covers systemic risk while leaving room for upside.
Why it’s useful:
Cheaper than full hedging
Maintains bullish bias
Helps outperform in rising markets
Professional hedgers rarely hedge 100%—they target optimal hedge ratio, statistically between 0.5 to 0.8.
5. Calendar (Time-Based) Hedging
This technique uses different expiry cycles to hedge positions.
Example
Long monthly futures
Short weekly futures
Or long far-month options and short near-month options
This helps exploit:
Time decay differences
Volatility mispricing
Event-driven risk (Budget, RBI policy, earnings)
Effectiveness:
Calendar hedging allows traders to create income from theta while keeping long-term directional protection.
6. Volatility Hedging (Vega Hedging)
For traders dealing with events like:
Elections
Monetary policy
Global uncertainty
Result season
Volatility hedging becomes essential.
How Vega hedging works:
You neutralize exposure to changes in implied volatility.
Example:
Short straddle = short vega
To hedge, you buy options with similar vega but different strikes or expiries
Or use VIX futures to counter volatility spikes
Why advanced?
Vega moves are unpredictable and can explode during sudden news. Vega hedging is crucial for premium sellers.
7. Cross-Asset Hedging
Institutions and advanced traders hedge positions using different but correlated assets.
Examples:
Hedge HDFC Bank equity risk using Bank Nifty futures
Hedge crude oil exposure with USDINR (as crude affects currency)
Hedge Nifty positions with SGX/GIFT Nifty
Hedge IT stocks using Nasdaq futures
Hedge gold with USD or 10-year bond yields
Why it works:
Market correlations are powerful, especially in globalized trading.
Cross-asset hedging reduces:
Volatility shock
Black swan impact
Sectoral divergence
8. Protective Options Structures
Instead of buying simple puts, advanced traders use multi-leg structures to reduce cost and improve payoff.
a) Collar Hedge
Long stock
Long put
Short call
Reduces cost of put = low-cost downside protection.
b) Put Spread Hedge
Buy ATM put
Sell OTM put
Lower cost than outright put, ideal for event hedging.
c) Synthetic Futures
Long call + short put
or
Short call + long put
Used to replicate or hedge futures efficiently.
d) Risk Reversal
Sell OTM call
Buy OTM put
Used extensively by institutions during bearish phases.
These structures protect against downside while keeping cost manageable.
9. Tail-Risk Hedging
Tail-risk hedging protects against rare, unexpected, but massive crashes (e.g., COVID crash, 2008, sudden geopolitical tension).
Popular tools:
Deep OTM puts
VIX futures / options
Long strangles on low IV days
Black Swan hedges (long gamma long vega)
Though expensive, tail hedging saves portfolios during extreme volatility.
10. AI-Driven Hedging Models
Modern hedging integrates machine learning for:
Volatility prediction
Correlation breakdown detection
Regime identification
Market-structure shifts
Auto delta/gamma adjustments
AI-based hedging can:
Reduce reaction time
Improve precision
Adjust dynamically to liquidity
Detect early signs of volatility expansion
This is used heavily by institutional options desks and large quant funds.
11. Market-Structure Based Hedging
Advanced traders hedge based on:
Liquidity zones
POC levels
Volume profile
VWAP zones
Break of structure (BoS)
Premium/discount zones
For example:
Hedging when price approaches a high-volume node
Hedging intraday longs near previous day high liquidity traps
Scaling hedges based on market structure weakness
This creates context-based hedging, not blind hedging.
12. Rolling Hedges
Instead of static positions, advanced traders roll hedges:
To next strike
Next expiry
Different ratio
Different structure
Rolling helps:
Lock profits on hedges
Reduce premium cost
Maintain continuous risk protection
Adjust to trend changes
Example:
Your protective put becomes profitable after a fall
→ Roll down and capture gains while maintaining coverage.
Conclusion
Advanced hedging is not about eliminating risk—it’s about controlling it intelligently. From delta-gamma management to cross-asset protection, option structures to AI-driven adjustments, the goal is simple: survive volatility, protect capital, and ensure consistent profitability.
Technical Market Explode1. What Is a “Technical Market Explosion”?
A “market explosion” refers to a rapid price breakout driven purely by technical triggers—no fundamental news is required.
It typically includes:
A sudden spike in bullish or bearish momentum
Breakout from a key technical zone
Large volume expansion
Wide-range candles
Fast movement toward next liquidity zones
High volatility and increased trader participation
This is the type of move that surprises many traders because price travels faster than normal and often exceeds expected levels.
2. What Causes a Technical Market Explosion?
(A) Breakout from Key Support/Resistance Zones
When price is stuck inside a range, buyers and sellers accumulate their orders. Once price breaks the range, trapped traders exit, and new participants join the move.
This results in:
Short-covering or long liquidation
Fresh momentum
Increased volatility
This combination sparks explosive movement.
(B) Market Structure Shift
A technical explosion often begins with a market structure change, usually identified by:
Higher high + higher low (bullish shift)
Lower low + lower high (bearish shift)
Break of trendline
Break of previous swing high/low
Once market structure shifts, technical traders jump in, creating momentum that pushes price aggressively.
(C) High Volume Breakouts
Volume is the fuel behind explosive moves.
When a resistance is broken with 3–4x above-average volume, the breakout is genuine.
Volume tells us:
Institutional participation
Less chance of false breakout
Strong follow-through
High volume acts as confirmation that the move is real.
(D) Liquidity Hunting and Stop Loss Triggers
Behind every explosive move is a series of stop orders placed by traders.
For example:
When price breaks resistance, short sellers’ stop-losses get hit → leads to panic buying
When price breaks support, long traders’ stop-losses trigger → leads to panic selling
This creates automatic order flow, pushing prices further and fueling the explosion.
(E) Imbalance and Fair Value Gaps
In modern technical analysis (especially Smart Money Concepts), explosive moves originate from imbalances.
These appear as:
Large bullish or bearish candles
Gaps between price levels
Very fast moves due to no opposite orders
When an imbalance occurs, price often travels fast without pullbacks, creating the explosive effect.
(F) Breakout of Consolidation Zones
Before every big move, price usually consolidates because:
Market is building orders
Institutions are accumulating
Traders are waiting for direction
Suddenly breaking out of a long consolidation zone results in a strong directional rally.
3. Technical Indicators Behind Market Explosions
(1) Moving Averages (MA & EMA)
Explosive moves commonly happen during:
Golden Cross (50 EMA > 200 EMA)
EMA breakout (price breaks above 20 or 50 EMA with volume)
Retest of EMA support
MAs align trend, confirming power.
(2) RSI + Momentum Indicators
Before a big explosion, RSI often shows:
Bullish divergence
Oversold reversal
Strong momentum above 60
Bearish divergence in downtrends
Momentum indicators help traders anticipate sharp moves.
(3) Volume Profile
Volume Profile reveals zones of:
High liquidity (value areas)
Low liquidity (low-volume nodes)
When price enters a low-volume zone, it travels very fast, causing explosive moves.
(4) Bollinger Bands Expansion
Before a market explodes, Bollinger Bands typically:
CONTRACT → volatility squeezes
Then EXPAND → breakout move begins
This is known as the Bollinger Band Squeeze breakout.
(5) MACD Crossover
MACD crossovers confirm trend strength.
A powerful MACD crossover above the zero line often signals:
Strong bullish explosion
Trend continuation
Institutional involvement
4. Chart Patterns That Lead to Explosive Market Moves
(A) Triangle Breakout
Symmetrical Triangle
Ascending Triangle
Descending Triangle
These patterns store compression.
When breakout happens → price explodes.
(B) Cup and Handle
This pattern is known for strong post-breakout rallies, often leading to multi-week explosive trends.
(C) Flag and Pennant Patterns
These are continuation patterns.
When breakout happens:
Momentum increases
Volume increases
Price explodes towards next target
(D) Double Bottom or Double Top Breakouts
When neckline breaks → explosion occurs due to aggressive traders piling in.
5. Institutional Trading and Market Explosions
Technical explosions are heavily influenced by institutional traders, who generate:
Large order blocks
Big liquidity shifts
Volume spikes
Long-range impulsive moves
Institutions often accumulate quietly, then trigger big moves that retail traders interpret as “explosive”.
6. Trader Psychology Behind Explosive Moves
A market explosion is powered by emotional reactions:
Fear of missing out (FOMO)
Panic buying/panic selling
Forced stop-loss exits
Momentum chasing
Quick profit-booking
These emotional behaviours create rapid price movement.
7. How Traders Identify a Technical Market Explosion Before It Happens
To predict explosion moments, traders watch for:
Squeeze or compression in price
Sharp increase in buying or selling pressure
Volume begins rising
Breakout from structure
Liquidity zones nearby
Imbalances in market
Momentum indicators turning positive
When all these align, the probability of a market explosion becomes extremely high.
8. How To Trade a Technical Market Explosion
Entry Strategies
Enter on breakout candle close
Enter after retest
Enter on volume confirmation
Enter on EMA bounce
Stop-Loss Placement
Below breakout zone
Below retest level
Below previous swing lows
Profit Targets
Next resistance level
Fibonacci extensions
Volume profile high-volume nodes
Risk Management
Explosive moves can reverse quickly; use:
1:2 or 1:3 risk-reward
Trailing stop-loss
Partial profit booking
9. Examples of Explosive Moves in Markets
Indices breaking all-time highs
Stocks breaking multi-month resistance
Commodity surges after long consolidation
Small-cap stocks breaking out on high volume
Each explosive move follows the same technical principles described above.
Conclusion
A technical market explosion is one of the most profitable and exciting events in trading. It results from a combination of chart patterns, volume expansion, liquidity hunts, market structure shifts, and trader psychology. Traders who understand these elements can anticipate explosive moves before they occur and enter early with confidence.
Unlock Stock Market Gains1. The Foundation: Market Structure Is Everything
Before trying to earn profits, a trader must understand how markets move.
Market structure shows the journey of price through phases—accumulation, markup, distribution, and markdown.
1. Accumulation Phase
Institutions slowly build positions at discounted prices.
Volume is low but stable.
Retail traders usually ignore this zone because nothing exciting happens.
Signs:
Tight range movements
Higher lows on volume spikes
Long consolidation after a fall
This is where smart traders quietly prepare.
2. Markup Phase
A strong breakout happens as demand increases.
Prices rise faster than before.
Signs:
Breakout above resistance
Volume expansion
Strong bullish candles
This is the best phase for trend traders.
3. Distribution Phase
Institutions start selling while retail investors keep buying.
Signs:
Flat top structure
Divergence in volume
High volatility
Many retail traders get trapped here, believing the trend will never end.
4. Markdown Phase
Strong downtrend begins after supply overwhelms demand.
Signs:
Breakdown of support
Series of lower highs
Panic selling
To unlock gains, a trader must learn:
Buy during accumulation and early markup
Exit during distribution
Avoid trading during markdown (unless shorting)
This alone can transform trading performance.
2. Volume Profile: The Secret Tool for Spotting Smart Money
Volume Profile shows where big players are interested—not just how much they buy, but at which price they build positions.
Key levels:
1. Value Area High (VAH)
Upper boundary of heavy-volume zone.
Price above VAH = breakout potential.
Price below VAH = selling pressure.
2. Value Area Low (VAL)
Lower boundary of heavy-interest zone.
Price bouncing from VAL often triggers rallies.
3. Point of Control (POC)
The single most traded price level.
Acts like a magnet—price often revisits it.
Volume Profile tells you:
Where institutions accumulate
Where stop losses of retailers sit
Where breakouts have real conviction
Mastering volume adds huge clarity to entries and exits.
3. Sector Leadership: The Engine Behind Big Market Moves
Stock market gains come fastest when you ride the strongest sectors.
Every market cycle has sector rotation:
When the economy expands → Banks, Autos, Capital Goods rise
When global liquidity improves → IT, Pharma, FMCG move
When government spending rises → Infra, Defence, PSU stocks rally
When risk appetite increases → Smallcaps, Midcaps explode
To unlock gains, always ask:
Which sector is leading right now?
If Bank Nifty is strong, choose financial stocks.
If Nifty Metal is strong, choose steel/aluminum stocks.
If Nifty IT is strong, choose large-cap tech stocks.
Following sector momentum gives you:
Faster returns
Stronger trends
Higher breakout success rate
4. Institutional Behavior: Follow the Big Money
Retailers react to news.
Institutions plan months ahead.
The stock market moves according to:
FII flows (Foreign Institutional Investors)
DII flows (Domestic institutions & mutual funds)
Proprietary desk positions
HNI activity
When big money enters a stock:
Breakouts become cleaner
Trends sustain longer
Pullbacks are shallow
You unlock gains by aligning with big investors, not fighting them.
How to track this?
Look at volume during breakouts
Observe bulk deals and block deals
Track FII and DII daily inflow/outflow
Watch open interest built during consolidation
This creates confidence in your trades.
5. Chart Patterns & Candlestick Mastery: Timing Your Entries Perfectly
A trader with poor entries struggles even in trending markets.
A trader with perfect entries can outperform even in sideways markets.
The best patterns for unlocking gains are:
Cup and Handle
Bull Flag
Ascending Triangle
Double Bottom
Rounding Bottom
Breakout + Retest
Candles that strengthen your confidence:
Bullish Engulfing
Hammer
Marubozu
Inside Bar breakout
Doji at support
Patterns + volume = high conviction trades.
6. Risk Management: The Real Key to Unlocking Gains
Most traders lose money not because of bad trades, but because of:
Oversized positions
No stop loss
Emotional trading
Chasing breakouts
Averaging down
Revenge trading
To consistently unlock gains:
Risk 1–2% of capital per trade
Use stop losses religiously
Maintain good risk-reward ratios (1:2 or 1:3)
Book profits partially on strength
Avoid trading during high-volatility events (Fed, RBI, Budget)
Without risk control, no strategy works.
7. Psychology: The Missing Piece in Most Traders’ Journey
The stock market tests emotions more than intelligence.
The top psychological rules:
Trade plans > Emotional reactions
Patience during consolidation
Discipline during entries
Zero attachment to stocks
No fear during breakout opportunities
No greed during profitable trades
A calm mind sees opportunities clearly.
A stressed mind sees risks everywhere.
8. Position Sizing & Capital Allocation: Multiply Gains Safely
Smart position sizing ensures long-term growth.
Allocation blueprint:
50% in strong trending stocks
20% in sector leaders
20% in high-risk high-reward smallcaps
10% in hedge or defensive stocks
Diversification protects you, but over-diversification kills gains.
Position sizing rules:
Add to winners, not losers
Pyramid only after confirmation
Scale out on signs of distribution
9. Following Market Sentiment & Global Cues
Modern markets are globally interconnected.
Sentiment drivers:
GIFT Nifty
US indices (Dow, Nasdaq, S&P 500)
Dollar index (DXY)
Crude oil prices
India VIX
Bond yields
Geopolitical news
Positive sentiment = higher accuracy in long trades.
Negative sentiment = better opportunities for short trades.
10. Building a Consistent Trading System
A profitable trader uses a structured approach:
Your system should include:
Setup – what pattern/structure you trade
Trigger – the exact candle or signal
Entry – breakout/POC bounce/sector strength
Stop Loss – technical, volatility-based, or structural
Target – R:R-based or trailing stop methodology
Exit signals – rejection, distribution, divergence
A consistent system = consistent gains.

High-Frequency Trading (HFT) in India1. What Is High-Frequency Trading?
High-Frequency Trading is a subset of algorithmic trading that focuses on:
Extremely fast trade execution
Large volumes of orders per second
Short holding periods (milliseconds to seconds)
Taking advantage of tiny price inefficiencies
In simple terms, HFT uses powerful computers, sophisticated mathematical models, and ultra-fast internet connectivity to make profits from small movements in prices that humans cannot catch.
HFT firms compete on speed, because the difference between executing a trade in 1 millisecond vs 2 milliseconds can decide whether a strategy is profitable or not.
2. Why Has HFT Grown in India?
HFT took off in India after the introduction of:
a) Co-Location Services
NSE and BSE allow brokers and trading firms to place their computers inside the exchange’s data center.
This reduces latency (delay) from milliseconds to microseconds.
b) Advanced Technology Stack
Indian markets adopted:
FIX protocol (Financial Information Exchange)
Ultra-low latency APIs
High-speed order matching engines
Direct Market Access (DMA)
c) Derivatives Market Growth
NSE’s index futures and options like Nifty, Bank Nifty, and FINNIFTY provide high liquidity, ideal for HFT strategies.
d) Market Modernization
India upgraded its exchanges with:
Microsecond time-stamping
High-speed leased lines
Real-time risk management
These changes created an environment where HFT could thrive.
3. How Does HFT Work?
HFT follows a technological and mathematical approach:
STEP 1: Detect Micro-Opportunities
Algorithms scan:
Bid-ask spreads
Order book imbalances
Arbitrage gaps between instruments
Momentum bursts
Latency-based inefficiencies
STEP 2: Execute Trades at Extreme Speed
HFT uses:
Multi-core processors
FPGA (Field-Programmable Gate Arrays)
Ultra-low-latency servers
Microwave and fiber networks
These systems can place thousands of orders per second.
STEP 3: Manage Risk Automatically
Risk systems continuously check:
Position limits
Exposure
Margin
Price deviations
If anything exceeds limits, the systems shut down automatically.
STEP 4: Square Off Quickly
HFT positions rarely remain open for more than:
A few milliseconds
A few seconds
Maximum a few minutes
The goal is to earn very small margins multiple times a day.
4. Main HFT Strategies Used in India
1. Market Making
HFT firms provide liquidity by placing both buy and sell orders.
They profit from the bid-ask spread.
Example:
Buy at 201.10 and sell at 201.20 → earn 0.10 repeatedly.
2. Arbitrage
Taking advantage of price mismatches:
Nifty Futures vs Nifty Spot
NSE vs BSE arbitrage
Index vs constituent stock arbitrage
Options mispricing
Currency vs equity cross-market arbitrage
HFT closes the gap instantly.
3. Latency Arbitrage
Ultra-fast algorithms react faster to quote changes than slower traders.
4. Momentum Ignition
Algorithms detect early price momentum and jump in before human traders.
5. Order Book Dynamics Strategies
Using order book patterns such as:
Order flow imbalance
Large hidden orders
Sudden liquidity vacuum
To predict short-term price moves.
5. Who Uses HFT in India?
1. Proprietary Trading Firms (Prop Desks)
These include boutique firms, hedge-fund-style prop desks, and technology-driven trading companies.
2. Institutional Brokers
Large brokers offering low-latency systems to clients.
3. Foreign HFT Firms
Several global players operate in India via local subsidiaries.
4. Market Makers
Liquidity providers for index derivatives and currency markets.
Retail traders generally cannot compete with HFT due to:
Hardware limitations
Lack of co-location access
Slow internet
Higher latency
6. Benefits of HFT in the Indian Market
1. Increased Liquidity
HFT adds continuous buy and sell orders, making markets smoother.
2. Reduced Bid-Ask Spreads
As HFT competes on price, spreads narrow—benefiting all traders.
3. Faster Price Discovery
Arbitrage algorithms instantly align prices across markets.
4. Higher Market Efficiency
Information reflects quickly into prices.
5. Better Execution Quality
Even retail traders indirectly get better fills due to more liquidity.
7. Risks and Criticisms of HFT in India
Despite the benefits, HFT also draws criticism.
1. Market Manipulation Concerns
Some alleged techniques include:
Quote stuffing
Spoofing
Layering
These create artificial supply/demand illusions.
2. Flash Crashes
Ultra-fast algorithms can cause sudden short-term crashes when:
Liquidity disappears
Orders get canceled instantly
Algorithms turn off at the same time
3. Unfair Speed Advantage
Retail traders cannot match co-located HFT machines.
4. Systemic Risk
If multiple HFT firms fail simultaneously, volatility could spike.
5. Technology Costs
Only well-funded firms can afford:
Co-location servers
High-speed networks
FPGA hardware
This creates a natural inequality.
8. Regulation of HFT in India
SEBI has implemented strict controls to ensure fairness.
1. Minimum Resting Time (Proposal)
Idea to force orders to stay in the book for a few milliseconds—reducing ultra-fast flickering.
2. Penalty for Excessive Order-to-Trade Ratio
HFT firms often place thousands of orders but execute only a few.
High OTR attracts penalties.
3. Randomized Order Matching
Proposed mechanism where matching is randomized within small time windows—reducing pure speed advantage.
4. Strengthening Surveillance
SEBI uses machine-learning tools to detect:
Spoofing
Layering
Market manipulation
5. Co-Location Auctioning
Equal access to co-location racks avoids unfair preferential treatment.
9. The Future of HFT in India
1. More Technology Upgrades
Exchanges are adopting:
Microsecond time-stamps
AI-driven surveillance
Faster matching engines
2. Increased Participation in Derivatives
Nifty, Bank Nifty, FINNIFTY continue to attract HFT flows.
3. Entry of Global Quant Firms
More global players are entering due to India’s:
High liquidity
Strong regulation
Growing economy
4. Rising Competition
As more firms adopt low-latency infrastructure, profits will depend more on innovation than speed alone.
Final Summary
High-Frequency Trading in India is a powerful mix of:
Ultra-fast computers
Complex algorithms
Advanced exchange technology
High liquidity
Opportunity-driven trading
It brings both advantages (liquidity, efficiency, tighter spreads) and disadvantages (flash crashes, unfair speed advantage).
SEBI continues to regulate HFT tightly to ensure equal and transparent access.
Overall, HFT has become one of the most influential forces shaping the microstructure and day-to-day volatility of Indian equity and derivatives markets.

GIFT NIFTY: INDIA’S GLOBAL FUTURES BENCHMARK1. What is GIFT Nifty?
GIFT Nifty is a futures contract based on the Nifty 50 Index, traded on NSE IX (NSE International Exchange) located in GIFT City (Gujarat International Finance Tec-City).
It allows global and Indian institutional investors to trade Indian index futures for nearly 21 hours a day. Previously, these contracts were traded in Singapore under the name SGX Nifty, which was one of the largest offshore derivative products linked to India.
In July 2023, SGX and NSE integrated their liquidity and migrated the contract to GIFT City, giving birth to GIFT Nifty. This made GIFT City the official global gateway for trading Nifty futures.
2. Why Was GIFT Nifty Created? (Background Story)
For many years, Indian index derivative trading was happening outside India through SGX Nifty, which traded in Singapore Exchange. Foreign investors widely used SGX Nifty to hedge Indian market exposure and take directional bets before Indian markets opened.
This led to:
Loss of trading volumes outside India
Loss of tax revenues
Limited control over trading data
Strategic disadvantage since India’s index was traded overseas
To resolve this, NSE International Exchange (NSE IX) in GIFT City collaborated with the Singapore Exchange (SGX). After a long process, liquidity was shifted from Singapore to India.
The result:
GIFT Nifty became the global benchmark gateway for international participation in Indian markets.
3. Where is GIFT Nifty Traded?
GIFT Nifty trades exclusively on:
NSE International Exchange (NSE IX)
located in
GIFT City – Gujarat International Finance Tec-City, India’s first global financial hub.
GIFT City provides:
Tax incentives
Global-standard regulatory environment
Ease of international clearing and settlement
USD-denominated trading
This transforms India into a preferred centre for offshore financial activities.
4. Trading Hours: Almost 21-Hour Trading Cycle
One of the biggest advantages of GIFT Nifty is its near-round-the-clock trading window, making it extremely attractive to global traders.
Trading Hours:
Session 1: 6:30 AM IST to 3:40 PM IST
Break: 3:40 PM–4:35 PM
Session 2: 4:35 PM IST to 2:45 AM IST (next day)
These extended hours allow:
European market overlap
US market overlap
Asian market overlap
Thus, GIFT Nifty reacts instantly to global events such as US inflation data, FOMC meetings, geopolitical events, Fed rate changes, or macroeconomic news.
5. Types of GIFT Nifty Contracts
Currently, GIFT Nifty offers four key futures contracts:
GIFT Nifty 50 Futures
— Based on India’s benchmark Nifty 50.
GIFT Nifty Bank Futures
— Based on Nifty Bank Index, preferred by high-volume traders.
GIFT Nifty Financial Services Futures
— Tracks financial, banking, and NBFC stocks.
GIFT Nifty Midcap Select Futures
— Targets mid-cap performance.
These contracts allow global investors to trade multiple Indian market segments.
6. Why is GIFT Nifty Important for Global Investors?
A. Hedging Indian Market Exposure
Foreign institutions and hedge funds use GIFT Nifty to:
Protect portfolios
Manage currency risk
Adjust positions during global events
React when the Indian market is closed
This makes it a powerful risk management tool.
B. Pre-Market Signal for India
Like SGX Nifty earlier, GIFT Nifty acts as:
India’s opening indicator
because it trades before NSE opens at 9:15 AM.
Traders watch GIFT Nifty to predict:
Gap up or gap down opening
Market sentiment
Global reactions to overnight events
C. USD-Denominated Trading
GIFT Nifty trades in US Dollars, eliminating INR volatility risk for foreign traders.
D. Lower Transaction Costs and Tax Benefits
GIFT City offers incentives such as:
Tax exemptions
Reduced transaction charges
Global settlement infrastructure
This improves liquidity and encourages foreign participation.
7. Advantages of GIFT Nifty for India
A. Boosts India’s Global Financial Position
By hosting the world’s primary trading hub for Indian index futures, India:
Captures revenue
Gains global visibility
Strengthens its financial ecosystem
B. Increases Trading Volumes
Liquidity that once belonged to Singapore has now moved to India.
GIFT Nifty is already seeing rising:
Participation
Volumes
Institutional activity
High-frequency trading (HFT)
C. Helps Build GIFT City as Global Hub
GIFT City aims to become:
India’s version of Dubai IFC
A global financial and tech ecosystem
A zone free from heavy domestic regulations
GIFT Nifty is its flagship achievement.
8. Impact on Indian Retail Traders
Even though GIFT Nifty is designed mainly for global players, Indian retail traders benefit indirectly:
A. Stronger Pre-Market Analysis
GIFT Nifty offers reliable cues for:
Market opening
Overnight sentiment
Global macro impact
This helps traders prepare strategies before NSE opens.
B. Better Volatility Understanding
Since GIFT Nifty reacts to global data instantly, it signals:
How big events may move Nifty
Expected risk levels
Next-day volatility zones
C. Improved Liquidity in Main Nifty Contracts
With global volumes migrating to GIFT Nifty, institutional hedging becomes more efficient, indirectly supporting NSE liquidity.
9. Comparison: GIFT Nifty vs SGX Nifty
Feature SGX Nifty GIFT Nifty
Location Singapore GIFT City, India
Currency USD USD
Trading Hours ~16 hours 21 hours
Settlement SGX NSE IX
Liquidity Earlier highest Now shifted to GIFT
Regulatory Foreign Indian global zone
Result: GIFT Nifty is now the official global benchmark for Nifty futures.
10. Role in Global Financial Markets
GIFT Nifty plays a significant role in the global market ecosystem:
Helps global funds include India in their derivatives portfolios
Enhances India’s market visibility
Acts as a hedge instrument for emerging markets exposure
Allows cross-border arbitrage strategies
As India rises economically, GIFT Nifty strengthens its position in global finance.
11. Future Growth Potential
GIFT Nifty is expected to grow due to:
Increasing foreign portfolio investment (FPI)
India’s rising GDP ranking
More indices being added (IT, Auto, FMCG, etc.)
Growing participation from global institutions
GIFT City plans to add:
Options contracts
More currency derivatives
More global settlement links
This will convert GIFT City into a global derivatives powerhouse.
Conclusion
GIFT Nifty is more than just a futures contract—it represents India’s emergence as a global financial centre. By shifting index derivative trading from Singapore to GIFT City, India has strengthened control over its markets, increased participation, expanded trading hours, and built a powerful financial ecosystem aligned with international standards.
For traders, GIFT Nifty remains a crucial indicator of market sentiment. For institutions, it is an efficient hedging and speculative tool. For India, it is a milestone showcasing financial modernization and global ambition.

Banking Sector Leadership in the Trading Market1. Why Banking Sector Holds Leadership in the Market
1.1 Highest Weightage in Index
The Nifty 50 allocates the largest share — around 33–38% — to financials, mainly banks.
Bank Nifty itself is a major index, made up of leading private and public banks.
When banks move, the entire index moves, causing large-scale shifts in sentiment.
Because of this high weightage, even a small percentage change in heavyweights like HDFC Bank, ICICI Bank, SBI, Kotak, or Axis Bank heavily influences Nifty’s direction.
1.2 Heart of the Economy
Banks are essential to every major economic activity:
Loans to corporates
Retail credit (housing, auto, personal loans)
Government bond investments
Infrastructure project financing
MSME support
If the banking sector is healthy, it signals that the economy is healthy — which boosts market confidence.
1.3 Institutional Ownership & Liquidity
Foreign investors (FIIs) and domestic institutions (DIIs) prefer banking stocks because:
They offer high liquidity
Business models are predictable
Regulated by the RBI
They move directly with interest rate cycles
This heavy ownership ensures that banking stocks are actively traded, making them natural leaders.
2. How Banking Sector Influences Market Sentiment
2.1 Reacts Fast to Macro Events
The banking sector responds immediately to:
RBI interest rate decisions
Inflation data
GDP trends
Liquidity conditions
Global interest rate changes
Whenever an economic event occurs, banking stocks show the first and strongest reaction. Traders watch them closely to judge market direction.
2.2 Credit Growth vs. Market Trend
High credit growth indicates:
Expansion in business activity
Higher consumption demand
Strong financial health
This fuels bullish sentiment across the market.
On the other hand, slowing credit growth reflects:
Weak business confidence
Stress in industries
Tightened liquidity
Markets often turn bearish when banks show declining loan growth.
2.3 NPA (Non-Performing Assets) Cycle
Bank NPA trends influence corporate health and market mood:
Falling NPAs = better profitability = bullish sector = bullish market
Rising NPAs = stress in corporates = bearish tone
Thus, traders consider NPA cycles as early indicators of broader market conditions.
3. Why Traders Focus on Bank Nifty as a Lead Indicator
3.1 Bank Nifty Moves Faster and Sharper
Bank Nifty is more volatile than Nifty due to:
Leverage-based business model
High sensitivity to macroeconomic shifts
Higher FII participation
Bigger intraday moves
Because of this, it often leads the market — if Bank Nifty is bullish, Nifty usually follows.
3.2 Option Trader’s Favourite Index
Bank Nifty has:
High liquidity in options
Narrow bid-ask spreads
Better price discovery
Faster momentum
Day traders, scalpers, and positional option traders use Bank Nifty as a sentiment gauge.
3.3 Banking Stocks Form Market Breadth
When major banks like HDFC Bank, ICICI Bank, SBI surge together, it signals:
Strong institutional buying
Rising market confidence
Start of a broader upward trend
When they fall together, it often marks:
Weak sentiment
FII selling pressure
Potential index correction
4. Key Drivers of Banking Sector Leadership
4.1 Interest Rate Cycle
The banking sector's performance is strongly tied to interest rates:
Rate hikes increase banks' net interest margin (NIM)
Rate cuts boost loan demand
Stable rates create predictable earnings
Traders use interest rate expectations to forecast banking stock direction.
4.2 Liquidity Environment
Banks thrive when liquidity is high:
Credit expansion happens easily
Market cap of banks rises
Valuations improve
Low liquidity can stress banking stocks, sending negative signals to the overall market.
4.3 Corporate & Retail Loan Mix
Private sector banks with strong retail portfolios (HDFC Bank, Kotak) often lead bullish rallies due to stable earnings.
PSU banks lead when:
Government spending rises
Infrastructure cycle strengthens
Bond yields fall
The leadership shifts based on the credit cycle.
5. How Banking Sector Leadership Affects Other Sectors
5.1 Triggers Rally in Interest-Sensitive Sectors
When banks are bullish, other sectors also pick up:
Real estate
Auto
Infra
Metals
FMCG (due to consumer spending boost)
This creates a broad-based market rally.
5.2 Influences Economic Cyclicals
Banks act as a barometer for:
Capital expenditure cycles
Corporate profit cycles
Manufacturing activity
Consumption levels
Strong banks = strong growth cycle = bullish markets.
5.3 Leads Early Reversals
Before a major rally or correction, banks usually turn first.
In early bull markets → banks break out first
In early bear phases → banks drop sharply before other sectors
This makes the banking sector a predictive indicator.
6. Traders’ Framework for Using Banking Leadership
6.1 Monitor Bank Nifty First
Before trading Nifty or other indices, traders check:
Bank Nifty trend
Price action
Volume profile
Leading stocks strength
Derivatives data
If Bank Nifty is strong, traders prefer bullish trades in the broader market.
6.2 Track Leading Banks
Key stocks to watch:
HDFC Bank
ICICI Bank
Axis Bank
SBI
Kotak Mahindra Bank
IndusInd Bank
These stocks often show early signs of trend continuation or reversal.
6.3 Use Leadership for Confirmation
A market cannot sustain a bullish trend for long without support from banks.
So traders look for:
Breakouts in Bank Nifty
Strong candle formations
Low wicks (showing buying pressure)
Heavy volumes
Positive FII data
These signals confirm strength.
7. Conclusion: Why Banking Sector Remains Market Leader
The banking sector’s leadership is not temporary — it is structural. Banking acts as:
The largest weighted sector in indices
The economic engine of credit and liquidity
The favorite playground for institutions and traders
The macro-sensitive sector that reacts first
The trendsetter for bullish and bearish phases
In simple terms:
If banks rise → the market rises.
If banks fall → the market weakens.
For any trader trying to understand market structure, trend strength, or broader sentiment, analyzing the banking sector — especially Bank Nifty — is essential.

AI Trading Profits1. What Is AI Trading?
AI trading refers to the use of machine learning models, algorithms, and automation to analyze markets, predict price movements, and execute trades. Unlike traditional trading, where decisions depend on human judgment, AI uses data patterns to make logical, emotion-free decisions.
AI trading systems usually combine:
Machine Learning Models
Neural Networks
Natural Language Processing (NLP)
High-frequency trading (HFT) algorithms
Automated execution engines
These systems can scan thousands of indicators, news events, and market variables in seconds — something that is impossible for a human trader.
2. How AI Trading Generates Profits
AI earns profits primarily through accuracy, speed, pattern recognition, and disciplined execution. Let’s break it down:
a) Predictive Accuracy
AI systems analyze past price action, volume, volatility, order flow, sentiment, and macro data to forecast short-term or long-term price movements.
Profits are generated when AI predicts:
Trend continuation
Trend reversal
Breakouts
Market structure shifts
High-probability entry and exit points
A well-trained AI model can identify winning setups with higher precision than manual analysis.
b) Speed and Efficiency
Markets move fast — especially in intraday or high-frequency trading.
AI reacts in microseconds, allowing it to:
Enter and exit trades before retail traders react
Capture small price inefficiencies
Take advantage of rapid sentiment changes
This speed gives AI a competitive edge that converts directly into profits.
c) Removing Human Emotions
Human traders often suffer from:
Fear
Greed
Overtrading
Emotional reactions
Confirmation bias
AI avoids all emotional biases.
Once trained, it follows logic-based rules, improving consistency and profitability.
d) 24/7 Market Monitoring
AI never sleeps.
It continuously scans market conditions, technical signals, global news, and sentiment changes.
This constant monitoring allows AI to:
Identify opportunities instantly
Avoid bad trades
React faster to volatility
The result? More accurate trades and higher profit probability.
e) Backtesting and Optimization
Before trading live, AI models test strategies on historical data.
This process includes:
Validating accuracy
Measuring risk-reward
Fine-tuning indicators
Eliminating unprofitable setups
Backtesting ensures that only statistically profitable strategies go live.
3. AI Trading Strategies Used for Profit
AI can be deployed in multiple trading styles. Each strategy targets different types of profits:
**1. Trend-Following Algorithms
AI identifies strong bullish or bearish trends early and rides them until the trend weakens.
It predicts:
Higher highs/lows
Momentum strength
Trend exhaustion
Profits come from capturing major directional moves.
**2. Mean Reversion AI Models
AI detects when prices deviate too far from their average (mean).
It forecasts when price is likely to:
Bounce
Revert back
Correct after overbuying/overselling
Profits come from short-term rebounds.
**3. Breakout and Breakdown Detection
AI is excellent at spotting breakout patterns before they occur.
It analyzes:
Volume spikes
Liquidity clusters
Pressure zones
Market structure
Profits come from sharp moves after a breakout or breakdown.
**4. High-Frequency Trading (HFT)
HFT uses ultra-fast algorithms to profit from small price changes.
AI helps:
Detect micro-patterns
Execute instantly
Create thousands of tiny profitable trades
This strategy generates small but consistent profits.
**5. Arbitrage Trading
AI identifies price differences between:
Exchanges
Brokers
Markets
Derivatives vs spot
It instantly buys low and sells high, locking in risk-free profits.
**6. Sentiment Analysis-Based Trading
AI uses NLP to scan:
News
Social media
Analyst reports
Earnings updates
Economic data
It converts sentiment into actionable trades.
Example: detecting early negative sentiment before a stock falls.
**7. Options AI Trading
AI is widely used in options due to complex pricing dynamics.
It predicts:
Implied volatility
Premium movement
Option Greeks shifts
Probability of strike price touching
Profits come from precision in volatility forecasting.
4. Why AI Trading Is So Profitable
1. Pattern Detection Beyond Human Capability
AI sees patterns in data that humans can’t detect.
2. Ability to Process Massive Data
Millions of data points are processed per second.
3. Discipline and Consistency
AI stays consistent in all market conditions.
4. Lightning-Fast Execution
AI acts instantly when price levels hit.
5. Adaptability
AI models adjust to changing market conditions by retraining or rebalancing strategies.
5. Real-World Examples of AI Trading Profitability
Hedge Funds
Many funds using AI (e.g., Renaissance Technologies, DE Shaw) have generated billions in returns, outperforming traditional traders.
Banks
J.P. Morgan, Goldman Sachs, and Citi use AI to improve:
Risk models
Trade execution
Market predictions
Retail Traders
With AI bots and automated systems, retail traders can:
Avoid emotional mistakes
Trade professionally
Increase win rate
6. Risks and Limitations of AI Trading
Even though AI can be highly profitable, it is not foolproof.
Risks include:
1. Overfitting
Model becomes too dependent on past data and fails in live markets.
2. Black Swan Events
AI struggles during unexpected market crashes.
3. Data Quality Issues
Wrong data = wrong predictions.
4. High Cost of Development
Reliable AI models require:
Huge data sets
Expensive training
High computational power
5. Excessive Confidence
Believing AI is 100% accurate can lead to unnecessary risk.
7. Final Summary
AI trading generates profits by:
Predicting market movements with high accuracy
Executing trades at lightning speed
Eliminating emotional decisions
Continuously learning and adapting
Identifying micro-patterns invisible to humans
While it can be extremely profitable, success depends on good strategy, quality data, and proper risk management.

Part 10 Trade Like Institutions 1. Buying a Call (Bullish Bias)
You profit when the price goes above the strike price + premium.
Example:
Nifty at 22,000
You buy 22,100 CE for a ₹50 premium
Breakeven = 22,150
Above 22,150 → profit begins
2. Buying a Put (Bearish Bias)
You profit when the price goes below the strike price – premium.
Example:
Nifty at 22,000
You buy 21,900 PE for ₹40 premium
Breakeven = 21,860
Below 21,860 → profit begins

Part 9 Trading Master Class With Experts Best Practices for Safe Option Trading
Start with buying options, not selling.
Use a defined stop-loss and target.
Avoid trading during low liquidity.
Choose ATM/ITM options for better probability.
Follow trend + volume + price action.
Don’t trade based on emotions or rumours.
For selling, always hedge positions.
Keep risk per trade under 1–2% of capital.

BUY TODAY SELL TOMORROW for 5%DON’T HAVE TIME TO MANAGE YOUR TRADES?
- Take BTST trades at 3:25 pm every day
- Try to exit by taking 4-7% profit of each trade
- SL can also be maintained as closing below the low of the breakout candle
Now, why do I prefer BTST over swing trades? The primary reason is that I have observed that 90% of the stocks give most of the movement in just 1-2 days and the rest of the time they either consolidate or fall
Trendline Breakout in KRN
BUY TODAY SELL TOMORROW for 5%

EURJPY: MEDIUM TERM BULLISH Hello everyone,
Let's talk about EURJPY upcoming predictions.
My pure Price action analysis is laying foundation for me to go Bullish.
With not much lift in my trading account, i am taking more risk by trading this pair with H1 Time frame aiming the Flag Target made by H4 Timeframe.
Currently, it crossed the flag's pole which was our confirmation point. Although I already got entered after the price touched the hourly trendline and then breakout above Resistance Level.
Please note that I am also keeping my equity safe and sound by early exit.
I am taking two trades each with 1% risk. Though the final target is 182.60 .
If my first trade target hits then I will move the SL of other trade to BE to ride the same direction with great peace of mind. Happy Trading.
Trade No. 1
Entry: 179.93
SL: 178.97
TP: 181.13000
Trade No. 2
Entry: 179.93
SL: 178.97
TP: 182.33000

Part 8 Trading Master Class With Experts1. Unlimited Losses (for Option Sellers)
Selling naked options can be dangerous due to sudden market spikes.
2. Time Decay
Option buyers lose money daily if the market doesn’t move.
3. Volatility Crush
After an event (e.g., earnings), option premiums drop sharply.
4. Wrong Strike Selection
Choosing inappropriate strikes reduces the probability of profit.
5. Lack of Discipline
Options require risk management more than prediction.

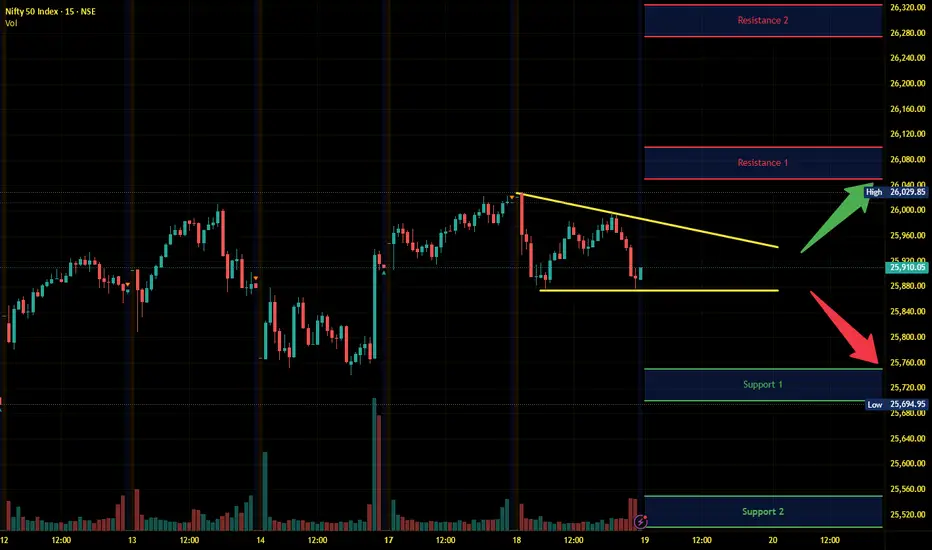
Nifty Intraday Analysis for 19th November 2025NSE:NIFTY
Index has resistance near 26050 – 26100 range and if index crosses and sustains above this level then may reach near 26275 – 26325 range.
Nifty has immediate support near 25750 – 25700 range and if this support is broken then index may tank near 25550 – 25500 range.
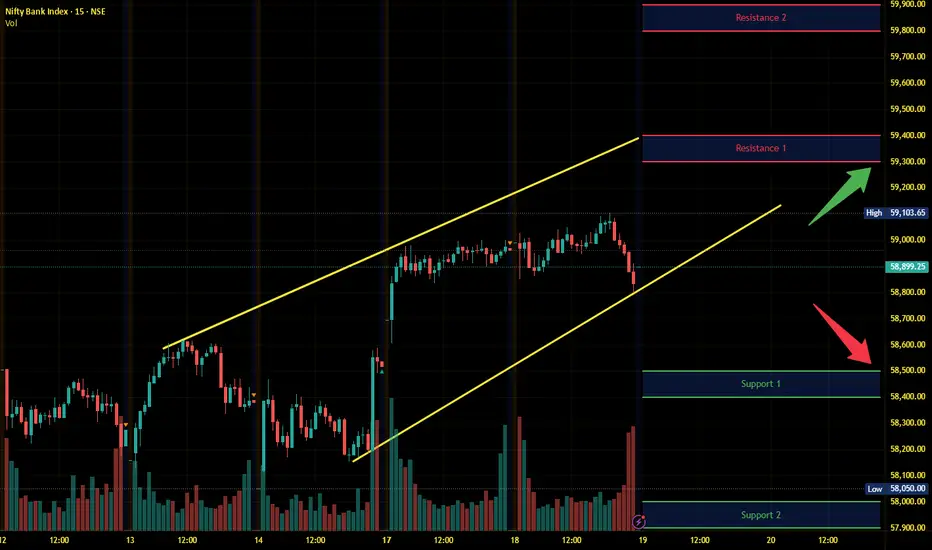
Banknifty Intraday Analysis for 19th November 2025NSE:BANKNIFTY
Index has resistance near 59300 – 59400 range and if index crosses and sustains above this level then may reach near 59800 – 59900 range.
Banknifty has immediate support near 58500 - 58400 range and if this support is broken then index may tank near 58000 - 57900 range.
Finnifty Intraday Analysis for 19th November 2025 NSE:CNXFINANCE
Index has resistance near 27750 - 27800 range and if index crosses and sustains above this level then may reach near 27975 - 28025 range.
Finnifty has immediate support near 27375 – 27325 range and if this support is broken then index may tank near 27150 – 27100 range.

Midnifty Intraday Analysis for 19th November 2025NSE:NIFTY_MID_SELECT
Index has immediate resistance near 14050 – 14075 range and if index crosses and sustains above this level then may reach 14200 – 14225 range.
Midnifty has immediate support near 13800 – 13775 range and if this support is broken then index may tank near 13650 – 13625 range.

Part 7 Trading Master Class With Experts 1. Delta
Measures how much the option premium changes with a ₹1 move in the underlying.
Call delta: +0.0 to +1.0
Put delta: –0.0 to –1.0
2. Theta (Time Decay)
Measures how much value the option loses each day.
Buyers suffer from Theta
Sellers benefit from Theta
3. Vega
Measures impact of volatility.
High volatility → higher premium
Low volatility → lower premium
4. Gamma
Measures how fast delta changes.
High gamma = high speed of price movement.
