JTEKT India Technical AnalysisHere's a comprehensive TradingView report for JTEKT India Limited:
Current Price:160.90
📊 TECHNICAL SETUP OVERVIEW
JTEKT India is displaying a compelling technical structure within a well-defined ascending channel pattern that has been in play since the 2020 lows. The stock is currently consolidating after a significant rally and appears to be setting up for the next leg of movement.
KEY TECHNICAL OBSERVATIONS
1. Channel Pattern Analysis:
- Long-term Ascending Channel: The stock has been respecting a parallel channel since 2020, with clear support and resistance boundaries
- Current Position: Trading in the middle zone of the channel, suggesting room for movement in either direction
- Channel Support: Lower trendline around 120-130 zone
- Channel Resistance: Upper trendline projecting towards 220-240 zone
2. Moving Average Structure:
All major moving averages are sloping upward, confirming a strong bullish trend across multiple timeframes.
3. Price Action Patterns:
- Clear higher highs and higher lows formation since 2020
- Recent consolidation after touching 220+ levels suggests healthy profit-booking
- Volume expansion during rallies indicates strong buying interest
- Formation of a potential inverse head and shoulders pattern on monthly timeframe
4. Support & Resistance Levels:
Immediate Support Zones:
- S1: 148-150 (8/13 EMA cluster)
- S2: 134-135 (50 EMA + channel support)
- S3: 120-122 (psychological level + lower channel boundary)
Resistance/Target Zones:
- Target 1:188.50 (Previous swing high)
- Target 2: 209.71 (Major resistance + psychological 200 level)
- Target 3: 255.40 (Channel top + Fibonacci extension)
PROJECTION & TREND ANALYSIS
Bullish Scenario (Higher Probability):
If the stock holds above 148-150 support zone:
1. First target: 188.50 (18% upside potential)
2. Breakout above 190 could trigger momentum towards 209.71
3. Ultimate target within channel: 255.40 (58% upside from current levels)
Bearish Scenario (Risk Assessment):
Break below 134 (50 EMA) could lead to:
- Retest of 120-122 zone (channel support)
- Deeper correction to 110-115 if channel breaks
- This would invalidate the current bullish setup
CONCLUSION
JTEKT India Limited presents a well-defined bullish channel with strong moving average support. The technical structure suggests the stock is consolidating before the next leg up, with multiple targets identified.
Accumulate on dips toward 148-150, add on strength above 170, with ultimate targets of 188, 210, and ₹255.
Disclaimer: This is a technical analysis for educational purposes only. Not financial advice. Technical analysis should be combined with fundamental research, and proper risk management should always be employed. Past performance does not guarantee future results.
#JTEKT #TechnicalAnalysis #StockMarket #ChannelTrading #SwingTrading #NSE #AutoSector #MovingAverages #TrendAnalysis #IndianStocks
Trend Lines

INDIGOPNTS: Trendline Breakout Post Q2FY26, Chart of the WeekWhy NSE:INDIGOPNTS Could Be Your Next Multi-Bagger: Breaking Out After a Brutal 60% Correction Post Good Q2 FY26 Numbers: Let's Analyze in Chart of The Week
As per the Latest SEBI Mandate, this isn't a Trading/Investment RECOMMENDATION nor for Educational Purposes; it is just for Informational purposes only. The chart data used is 3 Months old, as Showing Live Chart Data is not allowed according to the New SEBI Mandate.
Disclaimer: "I am not a SEBI REGISTERED RESEARCH ANALYST AND INVESTMENT ADVISER."
This analysis is intended solely for informational purposes and should not be interpreted as financial advice. It is advisable to consult a qualified financial advisor or conduct thorough research before making investment decisions.
Price Action Analysis:
Historical Price Movement:
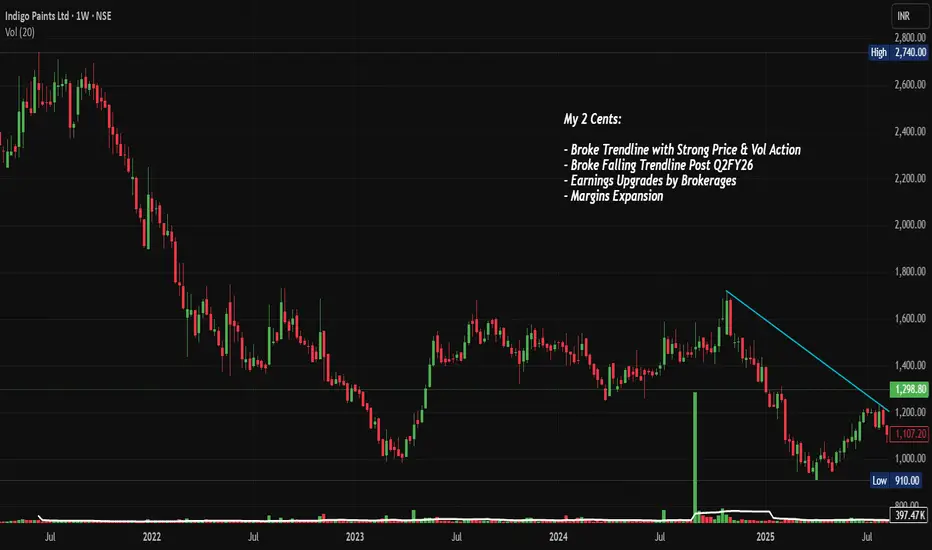
- The stock experienced a steep downtrend from its all-time high of approximately ₹2,695 in early 2022, declining over 60% to a low of ₹910 by mid-2024
- A prolonged bear market spanning nearly two years created a massive consolidation zone between ₹1,000 and ₹1,600 during 2023-2024
- Recent price action shows a strong bullish candle in November 2024, breaking above the downward trendline with significant momentum
- The current price of ₹1,298.80 represents a sharp recovery from the lows, gaining approximately ₹294.70, or 29.35%, in the recent move
Trendline Analysis:
- A clear falling trendline (marked in cyan on the chart) connected the lower highs from the 2022 peak through mid-2024
- This trendline acted as dynamic resistance, rejecting multiple rally attempts throughout 2023 and early 2024
- The recent breakout above this multi-year trendline occurred with strong price and volume confirmation, suggesting a potential trend reversal
- The breakout candle shows conviction with a decisive close above the trendline resistance
Price Structure:
- The stock formed a descending triangle pattern from 2022 to 2024, with lower highs and relatively flat lows around ₹900-₹1,000
- Post-Q2FY26 results (released in early November 2024), the stock has shown explosive upside momentum
- The recent surge created a bullish engulfing pattern on the weekly timeframe, signaling strong buyer interest
Volume Spread Analysis:
Volume Trends:
- Volume during the downtrend was relatively subdued, indicating lack of aggressive selling pressure
- The recent breakout candle shows significantly elevated volume at 7.67 million shares, representing 587.73 thousand volume units
- This volume spike confirms genuine buying interest and institutional participation in the breakout
- Volume expansion during the rally validates the authenticity of the price move
Volume-Price Relationship:
- The correlation between rising prices and expanding volume suggests healthy accumulation
- Previous attempts to break the trendline failed due to insufficient volume support
- Current volume levels are approximately 3-4x the average, indicating strong conviction among market participants
Key Technical Levels:
Support Levels:
- Primary Support (S1): ₹1,200—This represents the previous resistance zone that should now act as support
- Secondary Support (S2): ₹1,100 - The breakout point from the falling trendline
- Major Support (S3): ₹1,000-₹1,006 - Strong psychological level and previous consolidation base
- Ultimate Support (S4): ₹910 - The 52-week low acts as the ultimate floor
Resistance Levels:
- Immediate Resistance (R1): ₹1,400 - Near-term psychological barrier
- Intermediate Resistance (R2): ₹1,600 - Previous consolidation zone highs from 2023-2024
- Major Resistance (R3): ₹1,800 - Key supply zone from the downtrend phase
- Long-term Resistance (R4): ₹2,200-₹2,400 - Retracement levels toward the all-time high
Base Formation:
- A solid base has been established between ₹900 and ₹900-₹1,100 over an extended 18-month period
- This accumulation zone represents significant institutional buying at lower levels
- The base demonstrates strong hands holding the stock, reducing downside volatility
- Multiple tests of the ₹900-₹1,000 zone without breaking down confirms strong demand
Technical Patterns:
Reversal Patterns:
- A falling wedge/descending triangle pattern formed from 2022 to 2024, which is typically a bullish reversal pattern
- The pattern shows lower highs with relatively consistent lows, indicating selling exhaustion
- A breakout from this multi-year pattern suggests a major trend change is underway
Candlestick Patterns:
- The recent weekly candle shows strong bullish characteristics with a large body and minimal upper shadow
- The candle closed near its high, indicating buyer dominance throughout the period
- Previous candles show a transition from consolidation to expansion phase
Fundamental Backdrop:
Company Overview:
- Indigo Paints is India's fourth-largest decorative paints company with strong brand recognition
- The company operates three manufacturing facilities located in Jodhpur, Kochi, and Pudukkottai
- Headquartered in Pune, Maharashtra, the company was founded in 2000 and listed on stock exchanges in 2021
- Known for innovative product launches and being first-to-market with several differentiated paint solutions
Recent Financial Performance:
- Q2FY26 revenue grew 3.45% year-on-year to ₹298 Cr., though net income grew 5.85% to ₹26 Cr, due to competitive pressures
- Gross margins expanded to 45.1% from 44.1% in the previous year, driven by softening raw material costs and premium product focus
- EBITDA margin improved to 15.3% from 14.8%, reflecting operational efficiency gains
- The company has expanded its dealer network to over 18,900 active dealers and more than 11,650 tinting machines
Growth Catalysts:
- Management expects double-digit volume growth by Q4FY25, supported by strong leading indicators like dealer fund inflows and painter token scanning
- Extended monsoon impacted August sales, but July and September showed robust growth momentum
- The company is focusing on premium product mix to defend margins against aggressive competition from new entrants
- Expansion into project sales and construction chemicals segments provides new revenue streams
Sectoral Outlook:
Indian Paint Industry Overview:
- The Indian paints and coatings market is estimated at USD 10.46 billion in 2025 and expected to reach USD 16.38 billion by 2030, growing at 9.38% CAGR
- Architectural applications account for 77.56% of market demand in 2024, driven by India's construction boom
- The decorative segment accounts for nearly 75% of total demand, with 80% coming from repainting activity
- Repainting cycles have shortened from 7-8 years to just 4-5 years, accelerating demand growth
Competitive Landscape:
- New players like Birla Opus, JSW Paints, and Pidilite have entered with aggressive strategies and significant capital expenditure
- Birla Opus alone plans to increase industry capacity by 40% over the next three years, aiming to become the second-largest manufacturer by 2025
- Revenue growth slowed to 4% in FY24 after 14-15% CAGR between FY19 and FY23 due to price cuts and competitive pressures
- Despite margin pressure, established players like Indigo maintain advantage through distribution networks and brand loyalty
Industry Drivers:
- Residential unit sales surged 30% year-on-year to 474,000 units in 2024, supported by PM Awas Yojana affordable housing scheme
- The government plans to construct 30 million affordable houses over the next five years through PM Awas Yojana
- Rising disposable incomes, urbanization, and lifestyle changes are compressing repaint intervals in major cities
- Infrastructure projects under Bharatmala and Sagarmala are driving demand for industrial and protective coatings
Bull Case:
- A technical breakout from multi-year falling trendline with strong volume confirmation suggests major trend reversal
- Established player with differentiated product portfolio and strong gross margins outperforming peers
- Sector tailwinds from government infrastructure push and housing demand provide multi-year growth runway
- Valuation correction of 60% from peak creates attractive entry point for long-term wealth creation
- Management's focus on premium products and margin expansion positions company well against competition
Bear Case:
- Intense competition from well-capitalized new entrants (JSW, Birla Opus) could pressure market share
- Slower-than-expected volume growth in Q2FY26 raises concerns about demand momentum
- Margins vulnerable to aggressive pricing by competitors offering trade discounts
- An elongated monsoon and macroeconomic uncertainties could impact near-term performance
- Stock has rallied sharply in short period, creating potential for profit-booking
Key Monitoring Points:
- Track quarterly volume growth trajectory to confirm management's guidance of double-digit growth by Q4
- Monitor gross margin trends to ensure premium strategy is working despite competitive intensity
- Watch dealer expansion metrics and market share data versus new entrants
- Observe raw material price trends, particularly crude-linked derivatives impacting costs
- Follow infrastructure spending and housing sales data as leading indicators for industry demand
My 2 Cents:
- The stock has decisively broken out from a multi-Week falling trendline resistance with exceptional volume support
- Multiple technical factors align favorably: pattern breakout, volume confirmation, base formation, and momentum shift
- Risk-reward ratio remains attractive even after the recent rally, particularly on any pullback to ₹1,200 levels
- The base formation between ₹900 and ₹900-₹1,100 provides strong downside support for long-term holders
- While near-term earnings growth is muted due to competition, the long-term sector outlook remains robust
- The company's focus on operational efficiency and margin expansion is yielding results despite challenges
NSE:INDIGOPNTS presents a compelling asymmetric risk-reward opportunity where the technical setup, fundamental improvement trajectory, and sectoral tailwinds are aligning after a prolonged correction. The breakout from a multi-year base with strong volume support provides a high-conviction entry point for wealth creation over the next 12-24 months.
Full Coverage on my Newsletter this Week
Keep in the Watchlist and DOYR.
NO RECO. For Buy/Sell.
📌Thank you for exploring my idea! I hope you found it valuable.
🙏FOLLOW for more
👍BOOST if you found it useful.
✍️COMMENT below with your views.
Meanwhile, check out my other stock ideas on the right side until this trade is activated. I would love your feedback.
As per the Latest SEBI Mandate, this isn't a Trading/Investment RECOMMENDATION nor for Educational Purposes; it is just for Informational purposes only. The chart data used is 3 Months old, as Showing Live Chart Data is not allowed according to the New SEBI Mandate.
Disclaimer: "I am not a SEBI REGISTERED RESEARCH ANALYST AND INVESTMENT ADVISER."
This analysis is intended solely for informational purposes and should not be interpreted as financial advice. It is advisable to consult a qualified financial advisor or conduct thorough research before making investment decisions.
Candle Patterns Risk Management in Options
While options offer opportunities, they also carry risks:
Selling naked options can lead to unlimited losses
High leverage can magnify mistakes
Emotional trading during volatility can destroy capital
Ignoring Greeks can cause unexpected losses
Disciplined traders use:
Stop loss
Position sizing
Hedging
Proper strategy selection
Options should always be traded with clear logic, not hope or fear.

Part 2 Ride The Big MovesMoneyness of Options
Options are classified as:
In the Money (ITM) – already profitable if exercised
At the Money (ATM) – strike close to current price
Out of the Money (OTM) – not profitable yet
Traders choose strikes based on strategy, risk appetite, and market view.
Greeks: The DNA of Options
Options behave differently based on market conditions. The Greeks measure these sensitivities:
Delta – how much the option price changes with underlying movement
Gamma – how much delta changes
Theta – time decay
Vega – sensitivity to volatility
Rho – sensitivity to interest rates
Understanding Greeks helps traders manage risk and predict option behavior.

Part 1 Ride The Big Moves Why Traders Use Options
Options offer several unique advantages:
1. Leverage
With a small premium, you can control a much larger position.
2. Hedging
Investors can protect portfolios from downside risk using puts.
3. Income Generation
Selling options—especially covered calls—creates consistent passive income.
4. Flexibility
You can profit in:
Upward markets
Downward markets
Sideways markets
High or low volatility environments
This flexibility gives options an edge over simple stock trading.

Part 2 Support and Resistance Straddle – Big Move Expected (Either Side)
Market View: Highly volatile ±10%
How it Works:
Buy ATM Call + ATM Put
If stock shoots up or crashes, you earn big
Used During:
Results day
Budget announcement
Major news event
Strangle – Cheaper Version of Straddle
Market View: High volatility expected
How it Works:
Buy OTM Call + OTM Put
Cheaper than straddle
Requires bigger move to profit

Part 1 Support and Resistance Bear Put Spread – Low Cost Bearish Trade
Market View: Moderately bearish
How it Works:
Buy ATM/ITM put
Sell lower strike put
Cheap alternative to buying a naked put
Iron Condor – Sideways Market Strategy
Market View: Neutral/Range-bound
How it Works:
Sell OTM call spread
Sell OTM put spread
Collect premium from both sides
Profit in a non-trending market
Best For:
Market consolidation
Expiry day premium decay

Option Trading Strategies Covered Call – Income Strategy
Market View: Moderately bullish
How it Works:
You hold shares of a stock.
You sell a call option on those shares.
You earn premium as profit.
Best For:
Generating fixed income in a sideways/bullish market.
Low-risk traders.
Risk: Stock may get “assigned” if it crosses strike price.

Part 2 Master Candlestick PatternBull Call Spread – Low Cost Bullish Trade
Market View: Moderately bullish
How it Works:
Buy ATM/ITM call
Sell higher strike call
Reduces cost + reduces risk
Best For:
Controlled bullish trades
Trending markets
Bear Put Spread – Low Cost Bearish Trade
Market View: Moderately bearish
How it Works:
Buy ATM/ITM put
Sell lower strike put
Cheap alternative to buying a naked put

Part 1 Master Candlestick PatternCash-Secured Put – Buying Stock at Discount
Market View: Moderately bearish
How it Works:
You sell a put option by keeping cash aside.
If stock falls, you buy it at lower (strike) price.
If stock stays above strike, you keep the premium.
Best For:
Investors wanting stock at a discount.
Very safe strategy.

LiamTrading – XAUUSD H1 | Two scenarios for the new weekLiamTrading – XAUUSD H1 | Two scenarios for the new week: wait for reactions at 4100 & Fibonacci zone – prioritise bullish trades when the market recovers
Gold is completing a technical rebound after a sharp drop, and H1 is showing two clear scenarios for the new week. The medium-term trend remains a corrective decline, but on H1, the price is in a rebound phase, so bullish trades will be prioritised – as long as the lower liquidity zones are maintained.
The key this week lies at 4100, where FVG, Fibonacci, and liquidity converge – this is the decisive point to see if gold will bounce back or continue to decline deeply.
🔍 Technical Analysis (Fibonacci • Trendline • Liquidity • Volume Zone)
Fibonacci H1: The price may rebound to Fib 0.5 (~4140–4150) – a zone with high liquidity & likely to show a bearish reaction.
Fib 0.382 (~4120–4130) is currently the first short-term resistance.
Price Structure: The medium-term downtrend is still present, but H1 is forming a rebound wave → prioritise buying when the price pulls back at the support zone.
The descending trendline is still controlling the market. If it breaks the trendline + holds above 4130–4150 → the uptrend is confirmed stronger.
Important liquidity zones:
4100: liquidity confluence + previous bullish resistance → strong reaction zone.
4085 and 4060: liquidity bottoms – if breached, it will trigger a deep decline scenario.
4032: FVG + Fibonacci bottom – the "break or hold" zone for buyers.
Key resistance this week: 4161 – 4187 – 4138 – 4111
📈 TRADING SCENARIOS FOR THE NEW WEEK
Scenario 1 – Bullish trade (priority)
Logic: Gold is rebounding; if it holds 4100 and pulls back strongly → target is the upper Fibonacci zone.
Entry: 4100–4111
SL: 4090
TP: 4138 → 4161 → 4187
Suggestion: Wait for strong signals like pin bar or engulfing H1 to confirm the rebound bottom.
Scenario 2 – Bearish trade (when the market fails to hold the bottom)
Logic: If gold breaks the H1 bottom and retests 4100 without holding → the medium-term downtrend continues to activate.
Entry: 4100–4108 (retest after break)
SL: 4120
TP: 4085 → 4060 → 4032
Suggestion: Only enter when H1 closes below 4100.
🌍 Macro Analysis – Fed causes market noise
According to the latest data from CME Watch:
54.1% chance the Fed maintains rates at 375–400 bps
45.9% chance the Fed cuts rates
The ratio is almost balanced → the market is very indecisive, creating unpredictable volatility ahead of the 10/12 meeting.
In this environment, gold often reacts strongly to unexpected news, so prioritise trading at liquidity zones – wait for clear confirmation.
⚠️ Invalidation Conditions
Price closes below 4060 → fully prioritise bearish trades.
Price closes above 4161 → strong bullish trade activated, discard all sell setups.
What scenario are you preparing for the new week?
Please comment & hit Follow on LiamTrading channel to receive the earliest analysis every day!

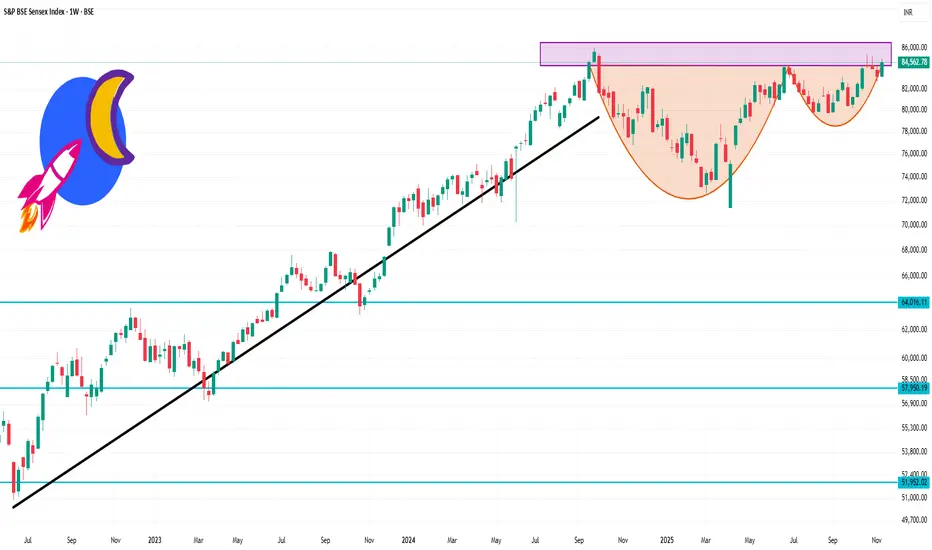
Sensex 1 Week Time Frame 🔍 Current Positioning
The index is currently trading in the ~ ₹84,500 zone.
Its 52-week high is around ₹85,290 and 52-week low is around ₹71,425.
On a weekly basis it has shown modest upward movement (~1–2 %) in the last week.
📏 Key Levels to Watch (Weekly)
Here are approximate levels to monitor for structure, support/resistance and trading bias:
Resistance zone: ~ ₹85,500–₹86,000 — near the recent highs and potential supply area.
Pivot / mid-zone: ~ ₹84,000–₹84,500 — where the index is currently hovering; acts as short-term equilibrium.
Initial support zone: ~ ₹83,000–₹83,500 — if weekly closes dip below this, risk of deeper correction increases.
Deeper support zone: ~ ₹80,000–₹81,000 — a major support on weekly view, if structure breaks lower.
📊 Weekly Structure & Bias
Because the index is near the highs, the weekly structure suggests caution: upside potential exists, but risk of consolidation or pull-back is higher given the proximity to resistance.
If we see a weekly close above ~₹85,500 with strong momentum, the bullish bias gains strength.
Conversely, a weekly break and close below ~₹83,000 would tilt structure towards a corrective phase and shift bias more neutral to bearish.
At present, the bias is moderately bullish but conditioned on support holding (i.e., above ~₹83K zone).
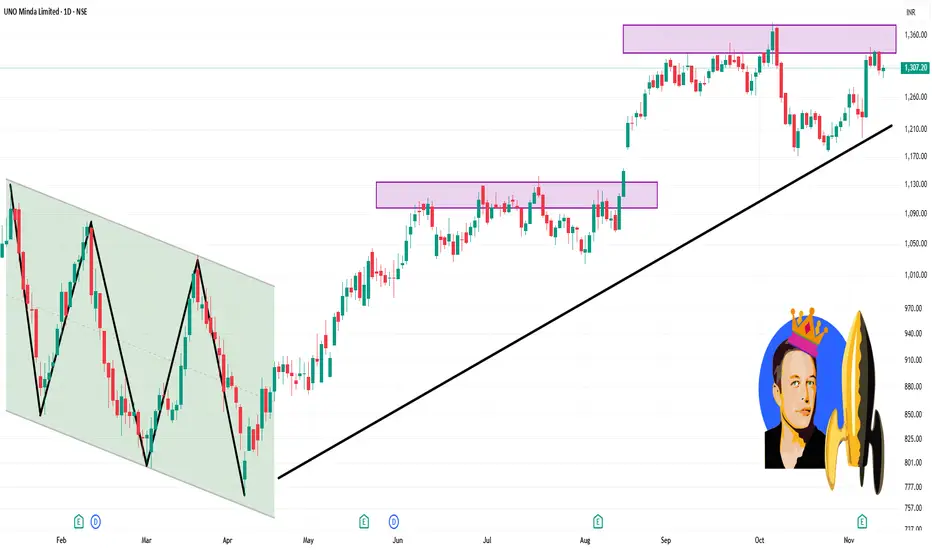
UNOMINDA 1 Day Time Frame 🔍 Current Price & Range
Last close: ~ ₹1,307.20.
Day range: ~ ₹1,290.05 (Low) → ₹1,311.05 (High).
VWAP: ~ ₹1,302.08.
✅ How to use these levels
If price holds above ₹1,290 and moves upward past ₹1,311 with volume, then a move toward ₹1,330-₹1,340 becomes plausible.
If price breaks below ₹1,290 on strong volume, watch for decline toward ~ ₹1,280 or worse.
Use stop-losses and manage risk, especially since the stock is trading near its 52-week high (~ ₹1,382) which may create stronger resistance.
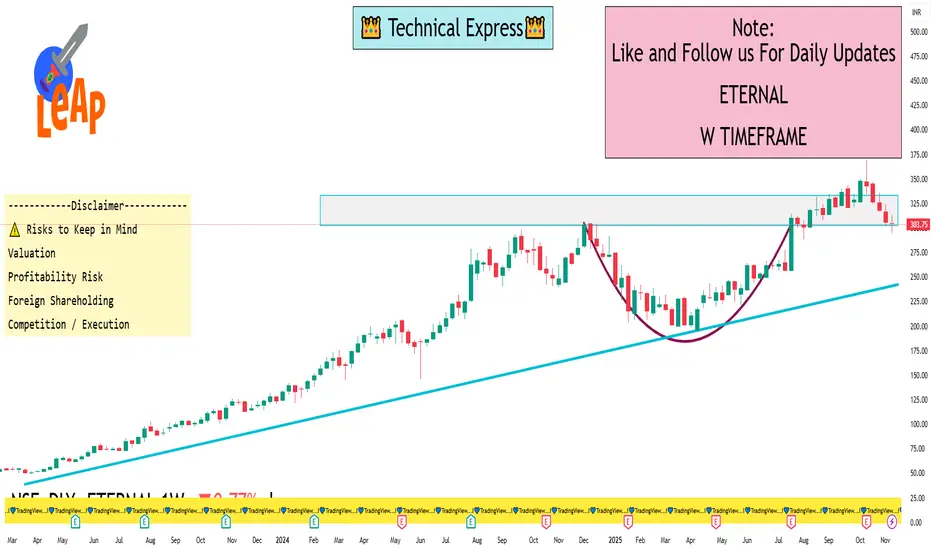
ETERNAL 1 Week View🔎 Weekly Timeframe Levels & Technical Picture
1. Current Price Context
a) Eternal is trading around ~₹303–306.
b) On 5paisa, support levels: ~₹297.3 (S1), then ~₹290.8 (S2).
c) Their 200-day SMA (on weekly or daily) is around ~₹280.2 (etMoney data).
2. Trend Structure & Key Zones
a) Major Support Zone: ~₹290–300 — this is a psychologically important zone, and there’s technical support around here.
b) Resistance / Key Level: ~₹320 — based on multiple trader viewpoints, breaking decisively above 320 could change short-term bias.
c) According to etMoney, RSI on weekly is not overly strong; momentum is somewhat neutral-to-down.
3. Chart Patterns / Candlestick Signal
a) Some traders point to a bearish engulfing pattern on the weekly.
b) If the weekly closes below ~₹320 with this pattern, the bearish case gains strength (according to those traders).
c) On the flip side, if 320 holds and price bounces, we might see a retracement or consolidation rather than a full breakdown.
4. Valuation Risk / Fundamental Pressure
a) Eternal’s valuation is very rich: its P/E is extremely high, which concerns some market participants.
b) On the fundamental side: strong revenue growth is being driven by Blinkit (quick commerce), but profit pressures remain.
c) According to a report, losses might have peaked, but execution risk remains.
Hedging with GoldWhy Gold Works as a Hedge
Gold’s hedging power comes from a few fundamental characteristics that have not changed for hundreds of years:
Limited Supply – Gold cannot be printed like currency. Central banks cannot create gold, so its value is less influenced by inflationary policies.
Universal Acceptance – Every country accepts gold as real value. It works beyond borders, politics, and currency systems.
Safe-Haven Asset – When global markets face uncertainty—war, recession, market crashes—investors run towards gold.
Anti-Inflation Characteristics – When inflation rises, the purchasing power of money falls, but gold usually appreciates.
Low Correlation with Equity Markets – When equities fall, gold often stabilizes or rises, making it a natural hedge.
These traits make gold a protective shield in a diversified investment or trading portfolio.
Types of Risks You Can Hedge Using Gold
1. Hedging Against Inflation
Inflation erodes the value of currency over time. Historically, gold prices rise when inflation goes up because currencies weaken.
Example: If inflation in India rises due to rising oil prices or currency depreciation, gold prices often rise in INR.
Investors use gold to preserve their purchasing power.
2. Hedging Against Currency Risk
Gold is priced globally in USD. For countries like India, gold becomes expensive when:
USD strengthens
INR weakens
Thus, gold acts as a hedge against domestic currency depreciation.
3. Hedging Against Equity Market Volatility
When stock markets fall sharply, gold generally rises or stays stable. This negative correlation helps protect portfolios.
Example: During global shocks like lockdowns, wars, or economic crises, investors move from risky assets to gold.
4. Hedging Against Geopolitical Risk
Gold reacts instantly to geopolitical uncertainty such as:
War threats
Diplomatic tensions
Oil supply disruptions
Global sanctions
When these events surface, gold becomes a safe refuge.
5. Hedging Systemic and Financial Risks
Gold holds value even when:
Banks collapse
Bond yields spike
Cryptocurrencies crash
Interest rates change
Therefore, gold is used by central banks and hedge funds as an “insurance asset.”
How to Hedge with Gold – Practical Methods
1. Physical Gold
Traditional but effective.
Gold bars
Coins
Jewellery (not efficient due to making charges)
Pros:
Tangible, no counterparty risk
Cons:
Storage, purity, liquidity issues
Best for: Long-term hedging and wealth preservation.
2. Gold ETFs (Exchange Traded Funds)
Most popular hedging tool for stock market investors.
Why they’re effective:
Easily tradable on NSE/BSE
Backed by physical gold
No storage issues
Example: Buying Gold ETF when expecting market volatility or inflationary pressure.
3. Sovereign Gold Bonds (SGBs)
Issued by RBI, these are ideal for medium-long term hedging.
Benefits:
2.5% annual interest
No storage issue
Tax-free on redemption after maturity
SGBs hedge inflation and currency risks while earning returns.
4. Gold Futures (MCX)
For traders, MCX gold futures are the most flexible hedge.
Uses:
Hedge short-term trading volatility
Lock buying/selling prices
Protect equity positions
Example:
If you are long in equities and expect a global shock, you can hedge by buying gold futures.
5. Gold Options
Options on gold, available on MCX, allow hedging using limited risk.
Example:
Buy Call option on gold → hedge against rising inflation/geopolitical risk
Buy Put option on gold → hedge against falling gold prices
Portfolio Hedging Strategies Using Gold
1. 10–15% Allocation Strategy
Most global experts recommend allocating 10% to 15% of a portfolio to gold to hedge against macro-economic risks.
Stable long-term return
Smoothens volatility
Acts as insurance during market crashes
Example allocation:
70% equity + 20% debt + 10% gold
2. Hedge When VIX Spikes
When volatility index (India VIX) rises sharply:
Markets become unstable
Investors flee to safety
Gold absorbs fear-driven flows
Traders use gold futures/options during VIX spikes to protect equity positions.
3. Dollar-Cost Averaging (DCA) in Gold
Instead of buying gold at once, accumulate slowly.
Reduces timing risk
Works during inflation cycles
Smoothens price fluctuations
Ideal for ETFs or SGBs.
4. Gold as a Hedge During Rate Cycle Changes
When central banks cut interest rates:
Gold rises (because opportunity cost drops)
When central banks raise rates:
Gold slows down, but still holds for hedging
Understanding rate cycles helps time your hedge better.
When You MUST Hedge with Gold
1. Rising Inflation Trend
If CPI inflation moves up consistently, gold becomes essential.
2. Weakening Rupee
When INR falls beyond 83–85 levels, gold prices rise quickly in India.
3. Global Recession Fears
In recessionary conditions:
Equities fall
Bond yields drop
Investors shift to gold
4. When Oil Prices Spike
Historically, oil and gold move together during crises:
higher oil = higher inflation = higher gold
5. Major Geopolitical Tensions
Wars, sanctions, Middle-East disruptions, or supply chain risks push gold higher.
Advantages of Gold as a Hedge
✔ Consistent Performance across decades
✔ Liquidity – easily traded
✔ Crisis-proof asset
✔ Acts as insurance for portfolios
✔ Balances equity risk
✔ Low correlation with other asset classes
✔ Effective against inflation and currency depreciation
Limitations of Hedging with Gold
⚠ No dividends or corporate earnings
⚠ Gold can go sideways for long periods
⚠ Short-term volatility exists
⚠ Futures require margin and skill
Gold is best used as a hedge, not as the only investment.
Conclusion
Hedging with gold is one of the oldest and most reliable risk-management strategies in financial markets. Whether it’s inflation risk, market volatility, geopolitical uncertainty, or currency depreciation, gold acts as a protective layer around your portfolio. For traders, gold provides a negative correlation hedge during equity market turbulence. For investors, gold safeguards long-term wealth and future purchasing power. In modern markets where data, algorithms, and AI influence every price move, gold remains a timeless asset—quiet, powerful, and consistent as a hedge.
India’s Market Surge1. Strong Domestic Economic Growth
The backbone of India’s market rally is its robust and consistent economic growth. India remains the fastest-growing major economy, with GDP growth often staying in the 6–7.5% range, even when global economies struggle with recession fears.
Key factors boosting economic momentum include:
High domestic consumption (India is a consumption-driven economy)
Strong government capital expenditure, especially in infrastructure
Rising manufacturing activity, supported by PLI schemes
Improving rural demand and financial inclusion
This economy-market alignment builds investor confidence that the expansion is backed by real economic progress, not just speculative money flow.
2. Consistent FII and Strong DII Participation
In previous market cycles, India heavily depended on Foreign Institutional Investors (FIIs). But the recent surge shows the strength of domestic investors:
Domestic Institutional Investors (DIIs)
Mutual funds, SIPs, and pension funds are investing record amounts every month.
Monthly SIP inflows crossing new highs build a stable, continuous support for equities.
Foreign Institutional Investors (FIIs)
FIIs have returned strongly due to India’s improving macro stability.
Compared to China, many FIIs see India as a safer, higher-growth, long-term bet.
This dual inflow dynamic creates a powerful liquidity engine that keeps markets supported even during short-term corrections.
3. Corporate Profit Boom
One of the most underestimated drivers is India’s corporate profit cycle.
Corporate profits as a percentage of GDP have hit multi-year highs.
Banks and financials are reporting record profits due to low NPAs and higher credit growth.
Manufacturing, IT, auto, and capital goods sectors are showing both volume growth and margin improvement.
When earnings grow consistently, markets rise not just because of sentiment—but because fundamentals justify higher valuations.
4. Government’s Long-Term Policy Stability
Policy continuity has played a major role in boosting investor confidence.
Important policy drivers:
GST stabilizing over time
Digitization and UPI-driven fintech boom
PLI schemes encouraging manufacturing expansion
Infrastructure push: roads, railways, logistics corridors
Make-in-India & Atmanirbhar Bharat initiatives
Clear, predictable policy frameworks attract both domestic and global investors who prefer stable emerging markets.
5. India’s Rising Global Preference vs China
A major geopolitical shift is happening:
Global investors are rebalancing away from China and moving to India.
Reasons include:
Better political stability
Fewer regulatory uncertainties
High-quality corporate governance
Massive demographic advantage
A growing middle-class consumption engine
India is being viewed as the next global growth leader, not just an emerging market. This perception shift alone adds premium valuations to Indian equities.
6. Middle-Class Expansion and Financialization of Savings
India’s middle class is growing rapidly, and with it, the financialization trend:
More people opening Demat accounts
SIP participation rising steadily
Increasing awareness of equity markets
Young investors entering trading and investing
This broad-based participation provides long-term depth and resilience to the markets—even during global volatility.
7. Sectoral Supercycles Fueling the Rally
Several sectors are experiencing their own mini supercycles:
a) Banking & Financials
Strong credit growth
Lower NPAs
Improved capital adequacy
Better provisioning
b) Capital Goods & Infrastructure
High order books
Massive government capex
Private capex revival
c) Auto & EV-related industries
Strong sales across passenger/2-wheeler/commercial vehicles
EV ecosystem development
d) Defence & PSU Stocks
Higher orders
Strategic focus on self-reliance
Market sentiment turning positive towards PSUs
e) New-Age & Tech Companies
Improved profitability
Better cash flows
More mature valuations
This multi-sector momentum gives the market a broader base, making the rally durable.
8. Stability in Inflation and Interest Rates
India has managed to maintain relatively stable inflation compared to many countries hit by energy crises, geopolitical tensions, or currency volatility.
RBI’s strict monetary policy helped keep inflation in control.
Rupee stability protects India from imported inflation.
Lower commodity prices benefit India’s manufacturing base.
Stable inflation and controlled borrowing costs help companies expand without pressure on margins.
9. Strong Global Positioning and Favourable Demographics
India’s demographic advantages will drive its markets for decades:
Average age around 29 years
Growing skilled workforce
Urbanization increasing yearly
Digital adoption growing at the fastest pace worldwide
Investors see India as a long-term compounding story rather than a short-term trade.
10. The Sentiment Factor: Confidence is at a Multi-Year High
Market cycles are also influenced by emotions—fear, greed, confidence, uncertainty.
Right now, India is riding on:
High confidence in government
Strong consumer sentiment
Optimistic business outlook
Healthy global reputation
This sentiment acts as the fuel that keeps the rally alive even during global shocks.
Is the Surge Sustainable?
While short corrections will always come, the long-term structure of India’s market rally remains strong due to:
Strong macroeconomic foundation
Corporate earnings visibility
Global capital preference
Domestic investor strength
Multi-sector growth
However, investors should be aware of valuations, especially in midcaps and smallcaps, which may see periodic cooling-off phases.
Conclusion
India’s market surge is not a temporary excitement—it is the result of strong fundamentals, stable policies, global shifts, and rising domestic participation. As the country transitions into a global economic powerhouse, its stock markets are reflecting this journey through steady, multi-layered growth. The next decade is expected to be one of the most promising periods for Indian equities, supported by structural transformation, digitization, manufacturing expansion, and a confident investor base.

AI Trading Secrets and the Indian Psychology Trading Era1. The Rise of AI Trading: Invisible Machines Behind Every Move
AI trading refers to the use of machine learning models, predictive algorithms, neural networks, and automation to make trading decisions. These systems process data far beyond human capability — from price movements and volatility to sentiment and macro signals. The real secret of AI trading is that it doesn’t just “see data”; it learns from historical patterns and adapts to real-time conditions.
AI Trading Secret #1: Feature Engineering Is More Important Than Models
Most people think AI magic lies in fancy models. But in reality, the quality of input data (“features”) determines how good the prediction is. Smart AI traders know how to extract features like:
Volume clusters
Volatility squeeze signals
Order book buildup
High-frequency momentum micro-patterns
These allow AI systems to predict not the “future market”, but the probability of short-term moves.
AI Trading Secret #2: AI Does Not Predict — It Works on Probability Mapping
AI systems calculate probability zones. For example:
68% probability: NIFTY may stay within a certain band
55% probability: a breakout may occur
72% probability: volume expansion confirms momentum
This probabilistic thinking makes AI far more disciplined and emotion-free compared to human traders.
AI Trading Secret #3: Alternative Data Is the True Edge
Modern AI traders are not limited to charts. They read “unseen data,” including:
Social media sentiment
Google Trends
WhatsApp retail buzz
FII/DII trading micro-behaviour
Global ETF flow patterns
Options chain clustering
This alternative data gives AI a big advantage — early detection of shifts that humans take hours or days to notice.
AI Trading Secret #4: Automation Protects You From Human Weakness
AI never:
Overtrades
Gets greedy
Averages blindly
Seeks revenge trades
Breaks rules
This discipline alone gives AI traders a massive edge.
AI Trading Secret #5: AI’s Final Power — Backtesting + Optimization
AI systems test thousands of scenarios:
Different stop losses
Different entries/exits
Different indicators
Different position sizing rules
This creates strategies that are mathematically optimized rather than emotionally guessed.
2. Indian Psychology Trading Era: A New Mindset Born After 2020
India has seen a trading revolution after COVID. Nearly 10+ crore retail traders entered the market. But what makes Indian trading psychology unique?
2A. India’s Retail Trader Behaviour: Emotional Yet Evolving
Indian traders historically operated on:
Tips
WhatsApp calls
Penny stocks
Rumours
Overconfidence
But after 2020, a shift began — more awareness, YouTube learning, Algo tools, and community learning transformed the mindset.
Psychology Trend #1: Hope-Based Trading to Data-Based Trading
Earlier:
People traded based on “feeling Nifty will go up.”
Now:
People analyse:
OI data
PCR
Volume profile
Institutional flow
This marks the birth of the Indian Data-Driven Retail Era.
Psychology Trend #2: From Heroic Trading to Systematic Trading
Earlier:
“Bhai, full margin laga do, kal upper circuit jayega!”
Now:
Traders prefer:
Swing + risk-reward
Stop-loss
Algo automation
Hedged option strategies
The ego of “catching tops and bottoms” is slowly dying.
Psychology Trend #3: Options Mania Changed Behaviour
Indians love leverage. Options gave them:
Low capital
High ROI possibility
Fast trading cycles
This created both growth and chaos. But now traders are learning:
Sell-side edges
Premium decay
IV crush
Weekly expiry psychology
This learning curve is transforming the Indian retail community into a more sophisticated force.
3. Blending AI With Indian Psychology: The New Era of Smart Retail
This is where the magic happens. When AI meets Indian trading psychology, three powerful shifts occur:
Shift #1: AI Reduces Emotional Mistakes of Indian Traders
Indian traders struggle with:
Fear of missing out (FOMO)
Holding losers
Exiting winners early
Overtrading for “thrill”
AI solves these with:
Rule-based systems
Automatic execution
Pre-fixed risk management
Objective signals
Disciplined execution removes 80% emotional damage.
Shift #2: Indian Traders Bring Intuition AI Cannot See
AI understands data, but not “political sentiment,” budget buzz, or Indian-style retail behaviour. Indian traders understand:
Election season moves
Dubbed “operator activity”
Midcap burst cycles
Sectoral rotations
Market mood swings
This intuition plus AI’s objectivity creates the perfect trading duo.
Shift #3: The Rise of Hybrid Systems in India
This is the future:
A blend of human analysis + AI execution.
Example workflow:
Trader analyses volume profile + market structure
AI system generates probability zones
Human selects scenario
AI trades automatically
This hybrid edge will dominate the Indian markets in coming years.
4. Biggest Psychological Barriers Indian Traders Must Break
To fully enter the AI + psychology era, Indian traders must overcome:
Barrier 1: Overconfidence Bias
Thinking “I know the market” instead of “market can do anything.”
Barrier 2: Tip Addiction
Relying on outside voices instead of system-based confidence.
Barrier 3: Quick-Rich Fantasy
Expecting to make 50,000/day with 10,000 capital.
Barrier 4: Revenge Trading
Trying to “win back” lost money emotionally.
Barrier 5: Impulse Trading
Taking a trade because the candle “looked good.”
AI erases most of these — if traders let the system work.
5. What the Future Looks Like
India is entering a very powerful trading era:
AI will handle execution
Humans will handle market structure
Psychology will be increasingly coded into systems
More retail traders will use algos
Market will become more competitive
Only disciplined + data-driven traders will survive
The ones who stay in the game the longest will be those who embrace AI discipline + Indian intuition.

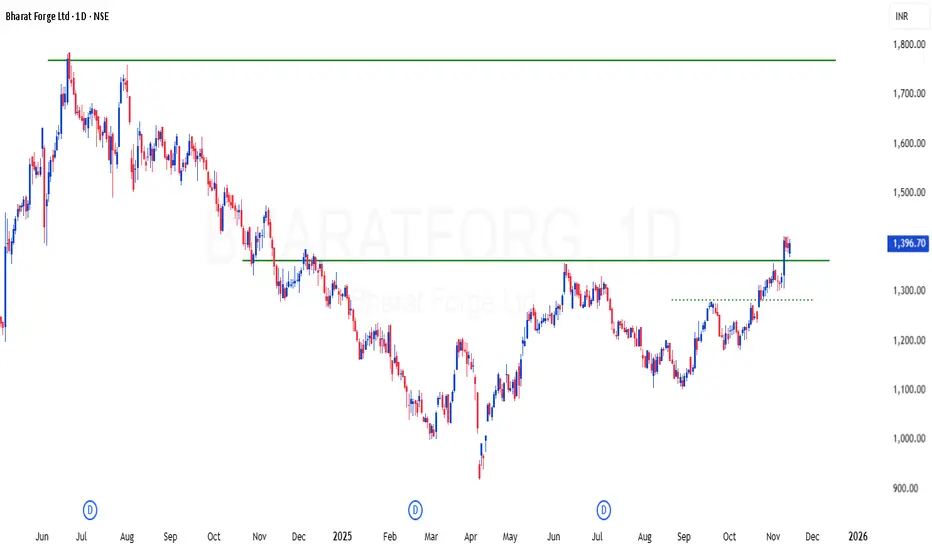
BHARATFORG | Simple Supply and demand play - Looks good for 25%BHARATFORG | Simple Supply and demand play - Looks good for 25%
CMP : 1396 (Dip : 1300)
SL : 1250
XAUUSDAs we see gold has been giving short opportunities timing is the key , I prefer for best sniper entry rather. Entering in fomo please checkout my idea.
KEEP IT SIMPLE.
DROP BASE DROP BOYS...

GOLD SHORTI was bearish on gold today was looking for a good opportunity although I didn't got chance to get entry up but got another chance and made short entry you can checkin the idea

BUY TODAY SELL TOMORROW for 5%DON’T HAVE TIME TO MANAGE YOUR TRADES?
- Take BTST trades at 3:25 pm every day
- Try to exit by taking 4-7% profit of each trade
- SL can also be maintained as closing below the low of the breakout candle
Now, why do I prefer BTST over swing trades? The primary reason is that I have observed that 90% of the stocks give most of the movement in just 1-2 days and the rest of the time they either consolidate or fall
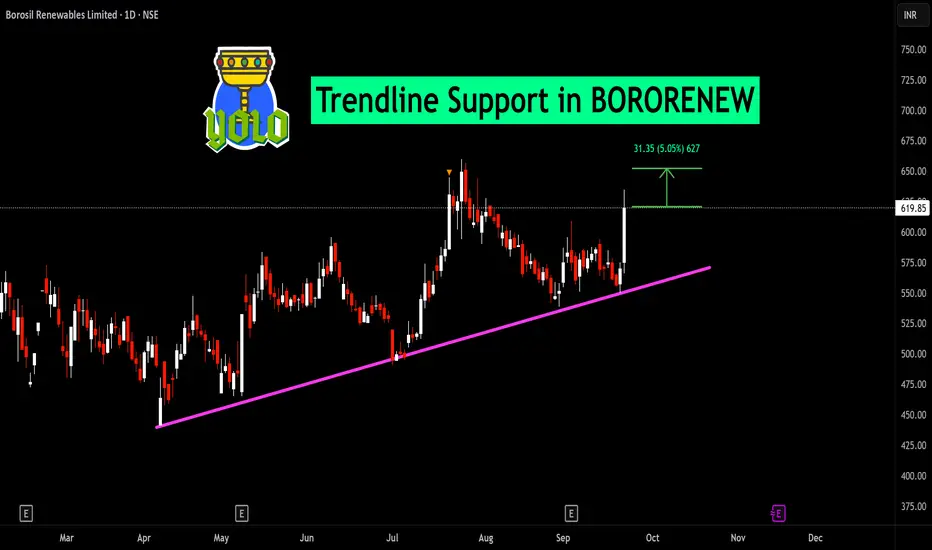
Trendline Support in BORORENEW
BUY TODAY SELL TOMORROW for 5%
BUY TODAY SELL TOMORROW for 5%DON’T HAVE TIME TO MANAGE YOUR TRADES?
- Take BTST trades at 3:25 pm every day
- Try to exit by taking 4-7% profit of each trade
- SL can also be maintained as closing below the low of the breakout candle
Now, why do I prefer BTST over swing trades? The primary reason is that I have observed that 90% of the stocks give most of the movement in just 1-2 days and the rest of the time they either consolidate or fall
Trendline Breakout in MTARTECH
BUY TODAY SELL TOMORROW for 5%

BUY TODAY SELL TOMORROW for 5%DON’T HAVE TIME TO MANAGE YOUR TRADES?
- Take BTST trades at 3:25 pm every day
- Try to exit by taking 4-7% profit of each trade
- SL can also be maintained as closing below the low of the breakout candle
Now, why do I prefer BTST over swing trades? The primary reason is that I have observed that 90% of the stocks give most of the movement in just 1-2 days and the rest of the time they either consolidate or fall
Trendline Breakout in PRIVISCL
BUY TODAY SELL TOMORROW for 5%
