Finnifty Intraday Analysis for 19th November 2025 NSE:CNXFINANCE
Index has resistance near 27750 - 27800 range and if index crosses and sustains above this level then may reach near 27975 - 28025 range.
Finnifty has immediate support near 27375 – 27325 range and if this support is broken then index may tank near 27150 – 27100 range.
Trend Lines

Midnifty Intraday Analysis for 19th November 2025NSE:NIFTY_MID_SELECT
Index has immediate resistance near 14050 – 14075 range and if index crosses and sustains above this level then may reach 14200 – 14225 range.
Midnifty has immediate support near 13800 – 13775 range and if this support is broken then index may tank near 13650 – 13625 range.

Part 7 Trading Master Class With Experts 1. Delta
Measures how much the option premium changes with a ₹1 move in the underlying.
Call delta: +0.0 to +1.0
Put delta: –0.0 to –1.0
2. Theta (Time Decay)
Measures how much value the option loses each day.
Buyers suffer from Theta
Sellers benefit from Theta
3. Vega
Measures impact of volatility.
High volatility → higher premium
Low volatility → lower premium
4. Gamma
Measures how fast delta changes.
High gamma = high speed of price movement.

Part 6 Learn Institutional Trading Hedging
Investors use options to protect portfolios from sudden market falls.
Example:
You own Infosys shares
You buy a put as insurance
If the price falls, the put offsets the loss
Leverage
With a small premium, you can control a large position.
Example:
A stock worth ₹1,00,000 can be controlled by paying ₹5,000 premium.

Part 4 Learn Institutional Trading Call Option
A call option gives you the right to buy the underlying asset at the strike price.
Traders buy calls when they expect prices to go up.
Example: You buy a call option on Reliance at ₹2,500. If the stock jumps to ₹2,700, your call becomes profitable.
2. Put Option
A put option gives you the right to sell the underlying asset at the strike price.
Traders buy puts when they expect prices to go down.
Example: You buy a put on TCS at ₹3,600. If the stock falls to ₹3,300, your put gains value.
Both call and put options derive their value from the underlying asset, which is why they are called derivatives.

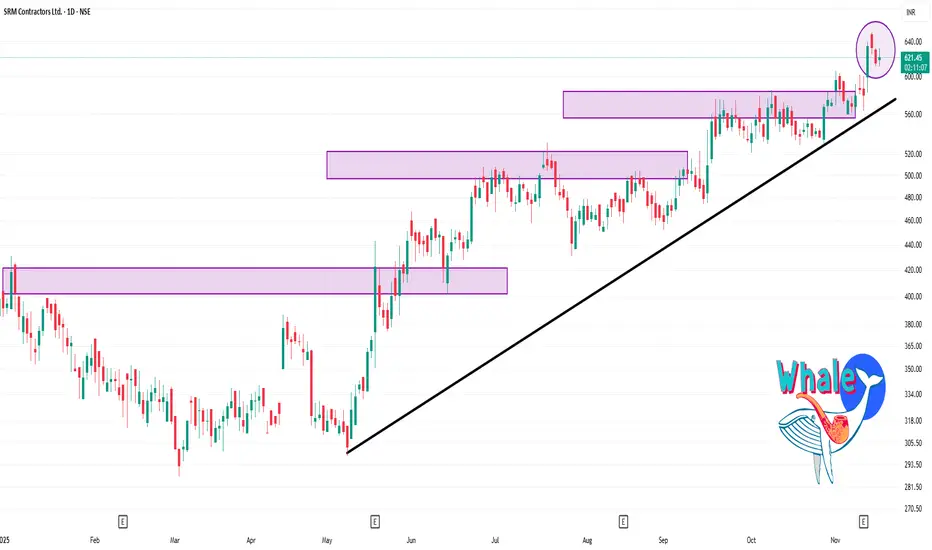
SRM 1 Day Time Frame 🔍 Key Levels (Daily Pivot / Support / Resistance)
Based on classic pivot calculations from recent prices:
Pivot: ~ ₹626.4 approx.
Resistance Zones:
R1 ~ ₹636.8
R2 ~ ₹645.3
R3 ~ ~ ₹655.7
Support Zones:
S1 ~ ₹617.99
S2 ~ ~ ₹607.6
S3 ~ ~ ₹599.1
🎯 My Short-Term View
Bullish setup: If the stock holds above the pivot ~₹626 and the support zone near ~₹617-620, it has room to test ~₹636-645 and potentially ~₹655.
Risk / caution area: If price drops back below ₹617-620 convincingly, then support near ~₹607-600 becomes important.
Ideal buy: A pull-back to the ~₹620 region with confirmation (volume/support) could offer a good risk/reward. Alternatively, a breakout above ~₹645 with strong volume could trigger further upside.
Stop / risk control idea: For a long trade, one could consider a stop below ~₹600-607 depending on risk tolerance.
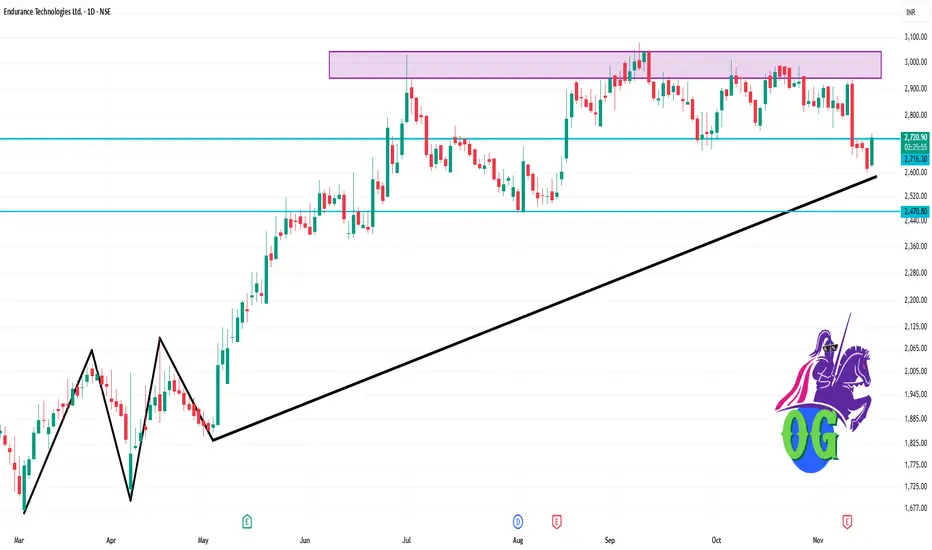
ENDURANCE 1 Day Time Frame 📌 Key Price Data
Last traded price: ~ ₹2,720.50 (as of 19 Nov 2025, ~11:57 AM IST)
Day’s high ~ ₹2,729.90, day’s low ~ ₹2,616.10
Previous close: ~ ₹2,615.10
📉 Daily Support & Resistance Zones
Based on the intraday range and recent levels:
Immediate support zone: ~ ₹2,620 – ₹2,650 (just above the day’s low)
Second support: ~ ₹2,580 – ₹2,600 (below current trading, potential break level)
Immediate resistance zone: ~ ₹2,730 – ₹2,760 (near day’s high)
Higher resistance: ~ ₹2,900 – ₹3,000+ (a more medium-term zone)
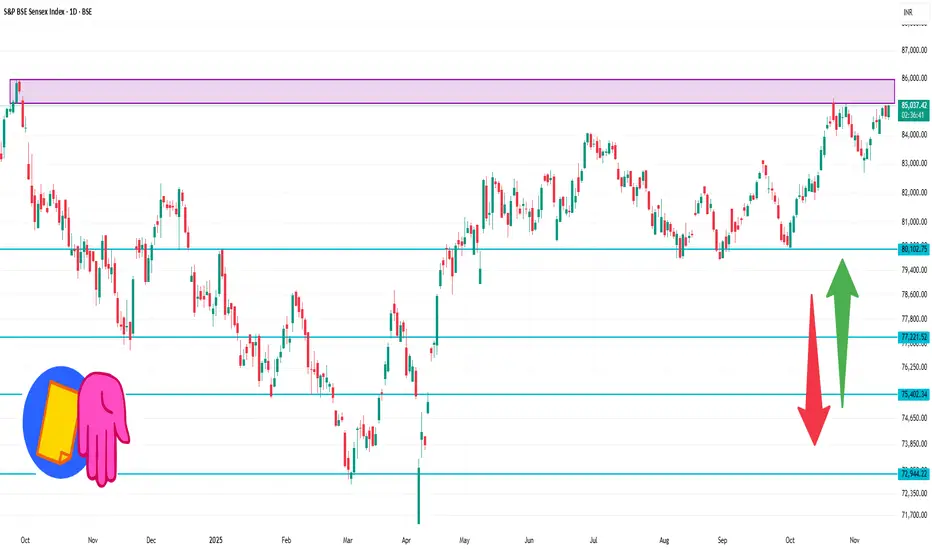
Sensex 1 Day Time Frame ✅ Current value
The index is trading around ~ 85,040 points.
Today’s high has been ~ 85,080 and low ~ 84,525.
📍 Key pivot & support/resistance levels (Daily)
From recent technical data:
Pivot Point: ~ 84,757.93
Resistance 1 (R1): ~ 84,957.50
Resistance 2 (R2): ~ 85,241.98
Support 1 (S1): ~ 84,473.45
Support 2 (S2): ~ 84,273.88
Support 3 (S3): ~ 83,989.40
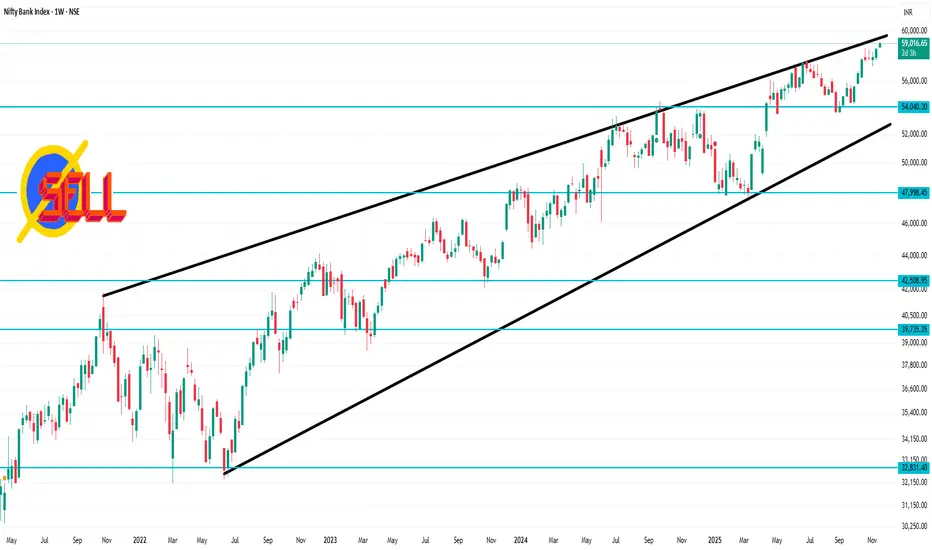
Bank Nifty 1 Week Time Frame🔍 Current snapshot
The index is trading around ~ 58,900-59,000 points.
It recently hit a fresh all-time high of around 59,100 points in recent sessions.
The structure shows it is near upper-resistance territory and signs of short-term exhaustion appear.
✅ Key Weekly Time-Frame Levels
Resistance zones
~ 59,100 – 59,300 points: This is the immediate upper resistance (recent ATH level) which bulls need to clear for a fresh leg up.
On a breakout above ~59,300, the next psychological target zone might be ~59,500-60,000+.
Support zones
~ 58,600 – 58,300 points: A key near-term support zone. Breakdown below ~58,800 may trigger weakness toward this zone.
A stronger support below that is around ~ 57,500 – 57,200 points, which becomes relevant if heavy selling or structural break occurs.
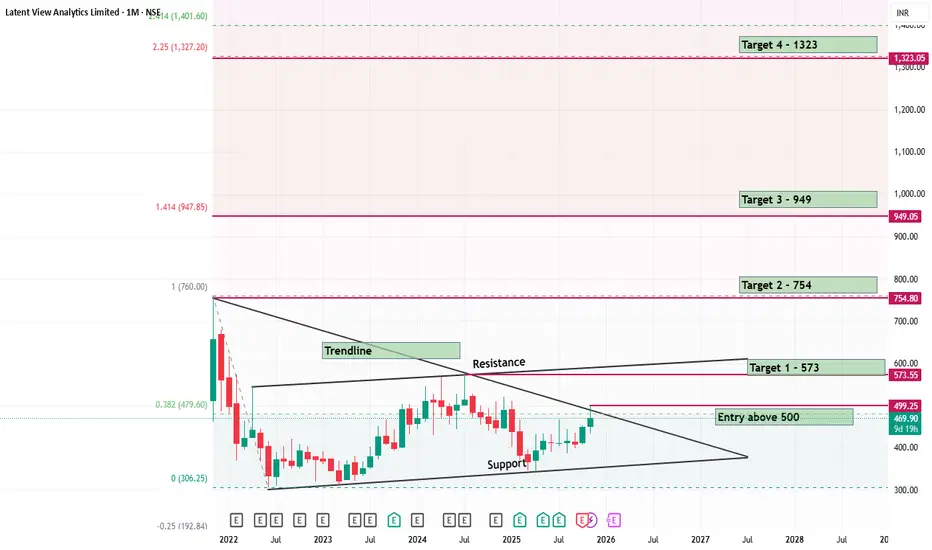
Latent View a Hidden Gem BUY with 2 Years Horizon
BUY LATENT VIEW
BUY ABOVE RS500 AND HOLD FOR 2 YEARS FOR A TARGET OF 1323.
Stock needs to break the upside resistance of Rs 573 with an entry on monthly close above 500.
It will rocket above 754 with is the the all time high.
Plotted the trendline for your understnading.
Below is the companies details. Great Share for Investors with a long time view.
The Company is a global digital analytics firm that inspires and transforms businesses to excel in the digital world by harnessing the power of data and analytics. The Company provides a 360-degree view of the digital consumer, enabling companies to predict new revenue streams, anticipate product trends and popularity, improve customer retention rates and optimize investment decisions. It is a trusted partner to enterprises worldwide, including over 30 Fortune 500 companies in the Retail, CPG, Financial, Technology and Healthcare sectors and has 860 employees in offices in Princeton, N.J., San Jose, California, London, Singapore, and Chennai, India.
The Company launched GenAI solution in FY23. It acquired Decision Point, by making a strategic move to enhance its capabilities in revenue growth management, in the Consumer-Packaged Goods Division (CPG) in 2024.
Sequent (D): Strongly Bullish, Fundamentally-Driven BreakoutThe stock has confirmed a major breakout from a 3-year structural turnaround. The move is backed by a massive earnings beat, high-conviction volume, and aligned indicators across all timeframes.
📈 1. The Long-Term Structure (The Turnaround)
- The Crash (2021-2023): After hitting its All-Time High (ATH) in June 2021, the stock entered a brutal correction, falling ~81% to form a base around ₹62 in February 2023.
- The Recovery: Since March 2023, the stock has been in a steady uptrend, forming a classic "rounding bottom" or recovery structure.
- The Hurdle: The recovery faced a stiff horizontal resistance trendline at the ₹239 - ₹241 zone. This level acted as a ceiling in October 2024 (High: ₹240.70) and rejected price action multiple times recently.
🚀 2. The Catalyst & Breakout (Today's Action)
- The Catalyst: The breakout is fueled by Q2 FY26 Earnings , where the company reported a staggering 209.1% YoY jump in Net Profit
- The Breakout: Today (Nov 18, 2025), the stock decisively shattered the ₹240 resistance, surging 7.10% to close near ₹247 .
- Volume Confirmation: The move was backed by massive volume of 9.15 Million shares, a sharp spike compared to the drying volume seen during the recent consolidation. This confirms institutional buying.
📊 3. Technical Indicators
- EMAs: Short-term EMAs are in a PCO (Price Crossover) state across Monthly, Weekly, and Daily timeframes, signaling a synchronized bullish trend.
- RSI: The Relative Strength Index is rising across all three timeframes, confirming that momentum is expanding with price.
🎯 4. Future Scenarios & Targets
The breakout has opened the door to higher levels, with a specific structural target in focus.
- The Gap (The Magnet): An unfilled gap on the daily chart has been identified from the steep 2021 correction. This gap exists between ₹270 and ₹276 (formed in August 2021). Gaps often act as magnets for price.
🐂 Bullish Targets:
1. Target 1 (Gap Support): ₹270 . The stock is likely to run toward the bottom of this unfilled gap.
2. Target 2 (Gap Fill): ₹295 . If momentum sustains and fills the gap, the next extension level is near ₹295.
🛡️ Support (The Entry Zone):
- Re-test Level: The breakout level at ₹239 - ₹240 has now flipped from resistance to support. A pullback to this zone would be a classic "buy-the-dip" opportunity to enter the trend with a favorable risk-reward ratio.
Conclusion
This is a high-quality setup. The combination of a technical breakout , earnings explosion, and gap-fill potential makes this a strong candidate for continuation. Watch for a hold above ₹239 .

Premium Charts Top Premium Chart Patterns
Below are the most powerful, widely used, institutionally-backed chart patterns. Each section includes:
Structure
Psychology
Volume behavior
Entry methods
Stop-loss placement
Profit targets
Smart-money traps
Let’s explore them.

Nifty Intraday Analysis for 18th November 2025NSE:NIFTY
Index has resistance near 26150 – 26200 range and if index crosses and sustains above this level then may reach near 26350 – 26400 range.
Nifty has immediate support near 25850 – 25800 range and if this support is broken then index may tank near 25650 – 25600 range.

Banknifty Intraday Analysis for 18th November 2025NSE:BANKNIFTY
Index has resistance near 59400 – 59500 range and if index crosses and sustains above this level then may reach near 59900 – 60000 range.
Banknifty has immediate support near 58600 - 58500 range and if this support is broken then index may tank near 58100 - 58000 range.

Finnifty Intraday Analysis for 18th November 2025 NSE:CNXFINANCE
Index has resistance near 27800 - 27850 range and if index crosses and sustains above this level then may reach near 28000 - 28050 range.
Finnifty has immediate support near 27450 – 27400 range and if this support is broken then index may tank near 27250 – 27200 range.

Midnifty Intraday Analysis for 18th November 2025NSE:NIFTY_MID_SELECT
Index has immediate resistance near 14125 – 14150 range and if index crosses and sustains above this level then may reach 14275 – 14300 range.
Midnifty has immediate support near 13875 – 13850 range and if this support is broken then index may tank near 13725 – 13700 range.

Part 3 Learn Institutional Trading Option Buyers
Pay premium.
Have limited risk (premium loss).
Have unlimited profit potential (in theory).
Bet on directional moves.
Option Sellers (Writers)
Receive premium upfront.
Have limited reward (premium earned).
Can face significant or unlimited risk.
Bet on time decay, sideways markets, or low volatility.

Part 2 Ride The Big Moves Time Decay (Theta)
One of the most important concepts.
Options lose value as expiry approaches.
Buyers suffer from time decay.
Sellers benefit from time decay.
Weekly expiry options lose value extremely fast, especially near expiry day (Thursday in India).
Popular Option Trading Strategies
Traders use various strategies depending on market conditions and risk appetite.

Part 1 Ride The Big Moves Smart Practices for Successful Option Traders
Trade with a plan and proper risk management.
Avoid overtrading and gambling behaviour.
Understand Greeks and volatility.
Prefer spreads over naked buying.
For sellers, always hedge positions.
Gradually move to advanced strategies after mastering basics.

PCR Trading Strategies How Option Contracts Work
Options have three crucial components:
1. Strike Price
The price at which the buyer can buy or sell the asset.
2. Expiry Date
The date when the option contract becomes invalid (weekly/monthly expiry in India).
3. Premium
The cost of buying the option.
Buyers pay the premium.
Sellers (writers) receive the premium.
Premium fluctuates based on demand, volatility, and time remaining.

Divergence SecretsRisks in Option Trading
1. Option Buying Risks
Premium becomes zero if market doesn’t move
Time decay erodes value daily
Volatility crush hurts premiums
Beginners often lose due to poor timing.
2. Option Selling Risks
Unlimited losses if market breaks range
Requires strict discipline & risk management
Sudden news, gap-ups, crash can blow the account
Margin requirement is high for safety.
3. Emotional Trading
Options move very fast.
Greed, fear, impatience can cause severe losses.

SUPRIYA 1 Day Time Frame Level ✅ Latest Price Snapshot
Most recent price: ~ ₹ 789.70 according to Groww.
Previous close in other sources: ~ ₹ 743.35 (Moneycontrol) for an earlier timestamp.
Day’s trading range (recent): ~ ₹ 779.45 – ₹ 795.10
📊 Key Levels (1-Day)
From recent pivot, support & resistance calculations:
Pivot / central range
Daily pivot approx: ~ ₹ 792.05
Another reference: pivot ~ ₹ 782.65
Resistance levels
R1 ~ ₹ 803 (approx)
R2 ~ ₹ 816
Longer-term upper band: ~ ₹ 842 (52-week high)
Support levels
S1 ~ ₹ 769
S2 ~ ₹ 748
S3 ~ ₹ 735
BEL 1 Day Time Frame 🔍 Current Context
The last quoted price for BEL was around ₹424.55 on the NSE.
The recent day-range (low to high) is approx ₹424.20 to ₹429.40.
52-week high ₹436.00 and low ~ ₹240.25.
🎯 Key Technical Levels (1-Day Chart)
Here are approximate support/resistance levels for the day, based on the recent range and price action:
Major Resistance: around ₹430 to ₹433 — price has approached this zone recently, so it’s an upper hurdle.
Immediate Resistance: near ₹429 to ₹430 given recent high of ~₹429.40.
Current Price Floor / Near Support: around ₹424 to ₹422 — the region where price is trading now.
Strong Support: around ₹417 to ₹420 — this would act as next key floor if the current support fails.
Lower Support / Risk Zone: ~ ₹410 to ₹412 — if price breaks down further, this zone could become relevant.
