Part 2 Ride The Big MovesUses of Option Trading
Hedging: Protecting an existing portfolio from adverse price movements.
Example: Buying a Put Option to hedge a long stock position.
Speculation: Betting on price movement direction with limited capital.
Example: Buying Call Options if expecting a stock to rise.
Income Generation: Selling options to collect premiums in range-bound markets.
Example: Covered Call Writing.
Types of Option Trading Styles
American Options: Can be exercised any time before expiry.
European Options: Can be exercised only on the expiry date.
(In India, most index and stock options are European style.)
Trend Lines

Part 1 Ride The Big Moves Common Option Trading Strategies
Options can be used for various market views—bullish, bearish, or neutral. Some popular strategies include:
Bullish Strategies:
Long Call
Bull Call Spread
Cash-Secured Put Writing
Bearish Strategies:
Long Put
Bear Put Spread
Covered Call Writing
Neutral Strategies:
Iron Condor
Straddle
Strangle
These strategies help traders manage risk and reward depending on their outlook and volatility expectations.

Step-by-Step Divergence Trading StrategyOption Pricing Factors
Option prices are influenced by several key factors:
Spot Price: Current market price of the asset.
Strike Price: Pre-agreed exercise price.
Time to Expiry: Longer duration = higher premium (due to time value).
Volatility: Higher volatility = higher premium (greater uncertainty).
Interest Rates: Affect cost of carry.
Dividends: Expected payouts can impact call and put prices.

Part 2 Intraday Master ClassParticipants in Option Trading
Option Buyers (Holders):
Pay premium to gain the right to buy/sell.
Risk limited to the premium.
Aim to profit from favorable price movement.
Option Sellers (Writers):
Receive premium from buyers.
Take on potential unlimited risk.
Often use strategies to generate income.

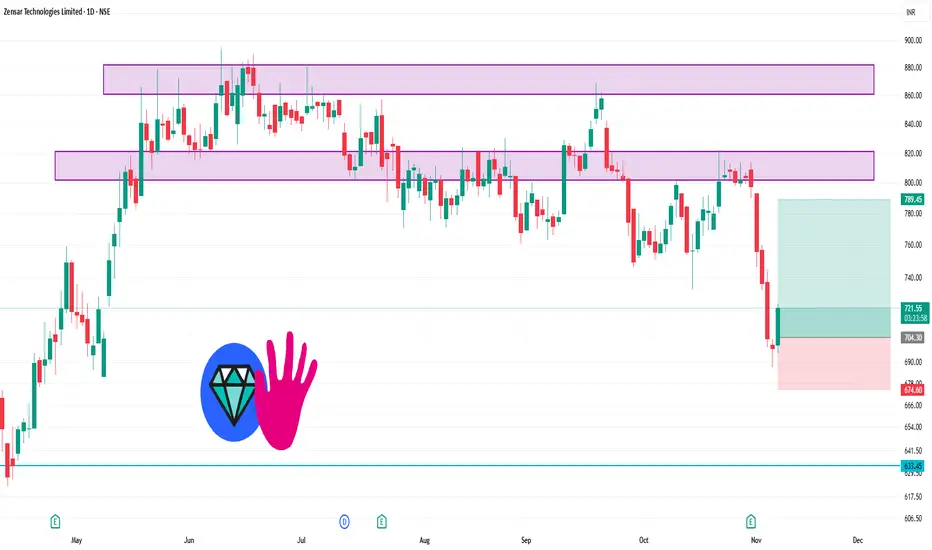
ZENSARTECH 1 Day Time Frame 🎯 Possible Trading Plan (for analysis only)
If bullish: Buy near ₹735–₹740 support with target ₹765 → ₹780 and stop-loss below ₹720.
If breakout: Above ₹780, momentum could extend toward ₹810–₹830 range.
If breakdown: Below ₹720, short-term weakness toward ₹700 possible.
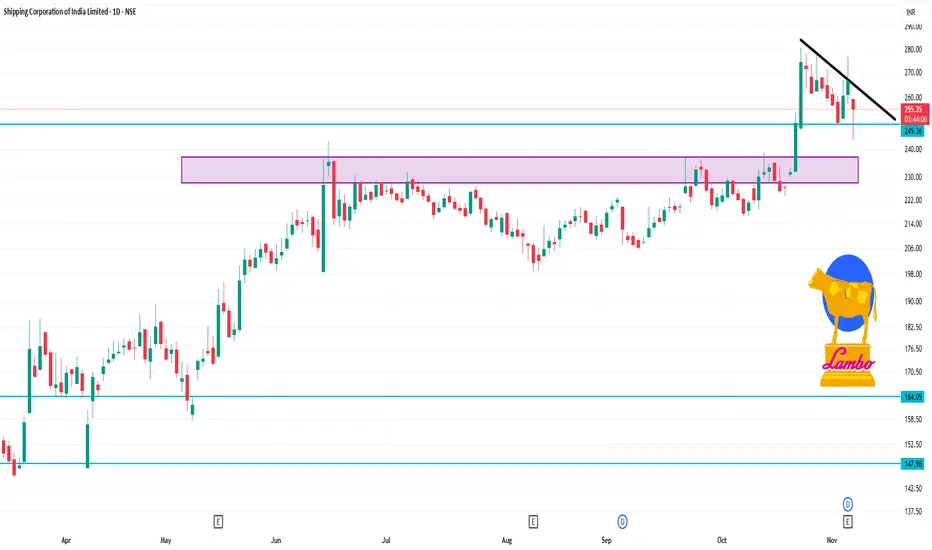
SCI 1 Day Time Frame 🔍 Price Snapshot
Live price around ₹254.20 (as of Nov 10, ~11:14 AM IST).
52-week range: ~ ₹138.26 (low) to ~ ₹280.50 (high).
📊 Key Daily Levels
Using pivot / support-resistance frameworks from sources:
Major Resistance: ~ ₹276-₹286
Primary Support Zone: ~ ₹247-₹256
Secondary Support: ~ ₹237-₹245
Pivot / central zone: ~ ₹266.80 (daily pivot approx)
Silver Triangle BreakoutSilver is attempting breakout forming a ascending triangle pattern on 1h and 4h timeframe. It is also trading above 200ema.

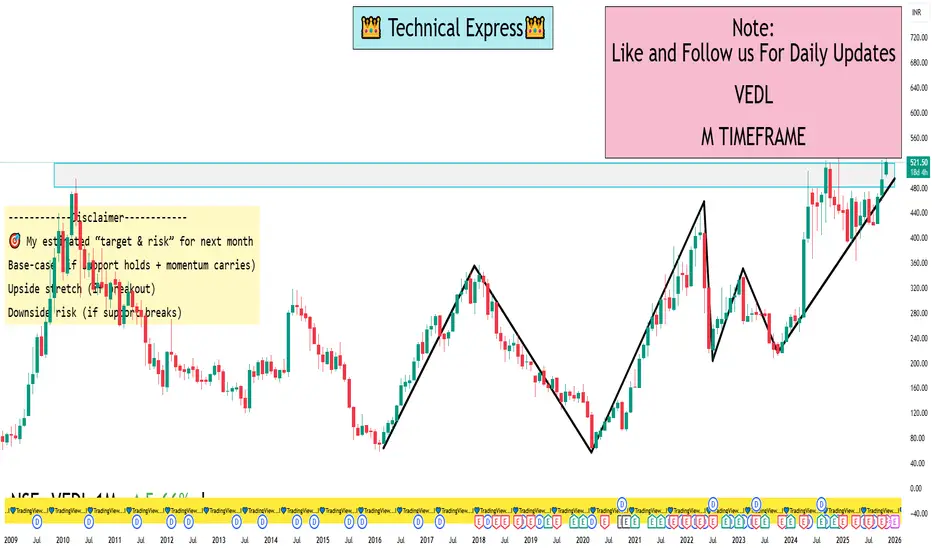
VEDL 1 Month View 📐 Key levels to watch (1-month horizon)
Support zones
Strong near-term support: ~ ₹ 503.
Next support layer: ~ ₹ 490-483 zone.
If broader breakdown: ~ ₹ 451-466 area (per monthly Fibonacci/Support).
Resistance zones
Immediate resistance: ~ ₹ 522-525.
🎯 My estimated “target & risk” for next month
Base-case (if support holds + momentum carries): Upside target ~ ₹ 530-540
Upside stretch (if breakout): ~ ₹ 550 or slightly above (but this requires strong follow-through)
Downside risk (if support breaks): Drop toward ~ ₹ 451-466 zone
The Modern Market Explosion1. The Digital Revolution in Financial Markets
The first and most powerful factor behind the modern market explosion is digitalization. In the 1980s and 1990s, trading floors were filled with brokers shouting bids and offers. Today, a vast majority of global trades happen electronically within milliseconds. Platforms like NSE, NASDAQ, and NYSE are now driven by high-speed algorithms and smart order systems.
Technology has democratized investing. Mobile apps and online platforms have made it possible for anyone — from a college student to a retiree — to invest in stocks, ETFs, or cryptocurrencies from their smartphones. This has led to a surge in retail participation across the world.
Moreover, the integration of AI and machine learning has redefined data analysis. Traders can now detect patterns, forecast trends, and execute trades with precision that was once unimaginable. AI-driven bots make split-second decisions based on vast data streams, helping investors capture opportunities faster than ever before.
2. Globalization and Market Interconnectivity
Today’s markets are no longer local — they are interconnected ecosystems. What happens in one corner of the world instantly impacts another. A rate hike in the U.S. can move Asian currencies, while a geopolitical conflict in the Middle East can spike global oil prices and influence stock indices in Europe and India.
This interconnectivity means opportunities are global. Investors can diversify portfolios across geographies — U.S. tech stocks, Indian mid-caps, Japanese bonds, and even African startups. But it also means higher volatility. The same interlinkage that offers diversification can also spread panic during crises — as seen in the 2008 financial meltdown or the 2020 pandemic shock.
However, globalization has also enabled foreign capital inflows into emerging economies, fueling growth and innovation. Markets like India, Indonesia, and Brazil have seen massive foreign institutional investments (FIIs) as global investors search for higher returns.
3. The Rise of Retail Investors and the “Crowd Effect”
One of the most striking features of the modern market explosion is the rise of retail participation. The COVID-19 pandemic accelerated this trend as millions turned to trading apps during lockdowns. Platforms like Zerodha, Robinhood, and Groww brought zero-commission trading, social learning, and user-friendly interfaces — empowering individuals to take control of their financial future.
Retail investors have become a powerful market force. Their collective moves can influence stock trends, as seen in the 2021 “GameStop phenomenon,” where a community of small traders challenged big hedge funds. Social media platforms like Reddit, X (Twitter), and YouTube have become virtual trading floors, where ideas spread faster than news headlines.
This new wave has made markets more dynamic but also more sentiment-driven. Tweets, rumors, or viral posts can trigger price movements — making psychology as important as fundamentals.
4. Explosion of Asset Classes and Financial Instruments
Modern markets are not limited to stocks and bonds anymore. Investors today have access to an explosion of financial instruments — from commodities and derivatives to cryptocurrencies, NFTs, and tokenized assets.
Cryptocurrencies like Bitcoin and Ethereum have introduced decentralized finance (DeFi), where financial transactions occur without intermediaries.
Exchange-Traded Funds (ETFs) offer exposure to entire sectors, themes, or countries in a single trade.
Options and futures allow traders to speculate or hedge against price movements with leverage.
Green finance and ESG investments are attracting investors seeking both profit and sustainability.
This diversity has expanded investment choices but also increased complexity. The new challenge for traders is not lack of opportunity, but knowing where to focus.
5. Speed, Data, and the New Trading Psychology
Markets now operate at machine speed. Algorithmic trading, powered by data analytics, accounts for more than half of global trading volume. Every second, millions of transactions take place across exchanges.
But this speed comes with a psychological shift. Traders must adapt to shorter timeframes and rapid information flow. In such a fast-moving environment, fear and greed amplify quickly. A small piece of negative news can trigger instant sell-offs, while hype can drive unsustainable rallies.
In this high-speed world, success depends on discipline, emotional control, and understanding market structure rather than chasing trends. Smart traders analyze volume profiles, liquidity zones, and institutional footprints to navigate volatility effectively.
6. The Role of Central Banks and Liquidity Waves
Modern markets also respond strongly to monetary policy. Central banks like the U.S. Federal Reserve, European Central Bank, and the Reserve Bank of India play a key role in shaping liquidity conditions.
Over the past decade, low-interest rates and quantitative easing (QE) flooded markets with liquidity, driving asset prices to record highs. However, when rates rise, the same liquidity reversal can cause sharp corrections — as seen in 2022.
The explosion in asset prices, from real estate to equities, has been largely fueled by easy money. This has also raised concerns about bubbles, inequality, and systemic risk. Thus, the modern market is as much about liquidity cycles as it is about fundamentals.
7. ESG, Sustainability, and the Future of Capital
Another major dimension of the modern market explosion is the rise of responsible investing. Environmental, Social, and Governance (ESG) factors are now integral to corporate strategy and investor decisions.
Global investors are demanding transparency, green energy initiatives, and ethical governance. Companies that align with sustainability goals attract more capital and public trust. This trend represents a moral shift — markets are no longer just about profit but purpose.
Renewable energy, electric vehicles, and carbon-credit trading are becoming new frontiers of market growth. In essence, the explosion isn’t just financial — it’s philosophical.
8. Artificial Intelligence and the Next Market Evolution
AI is the backbone of the next stage of market evolution. From predictive analytics to automated risk management, AI systems are reshaping portfolio strategies. Machine learning models analyze historical data, news sentiment, and global indicators to generate trading insights at unmatched speed.
Even retail investors can now use AI-powered tools to optimize strategies or detect anomalies. This levels the playing field, allowing individuals to compete with institutions — provided they understand how to use data intelligently.
However, this also raises questions about market fairness and algorithmic dominance. When machines control large volumes of trades, flash crashes and liquidity spikes become real risks.
9. Challenges in the Modern Market Era
Despite its opportunities, the modern market explosion faces significant challenges:
Volatility: Rapid information flow can cause unpredictable swings.
Regulation: Governments struggle to keep up with innovations like crypto and DeFi.
Cybersecurity: As markets go digital, hacking and data breaches pose serious risks.
Inequality: Wealth gaps may widen as those with access to technology and information dominate returns.
To sustain growth, regulators, investors, and institutions must strike a balance between innovation and stability.
10. Conclusion: The Future is Decentralized, Digital, and Data-Driven
The modern market explosion is not a single event — it’s an ongoing revolution. Every innovation, every new investor, and every data-driven decision adds another spark to this dynamic ecosystem.
We’re witnessing the democratization of finance — where anyone with knowledge, discipline, and internet access can participate in wealth creation. But success will depend on adaptability, continuous learning, and emotional intelligence.
As technology continues to evolve, markets will become more decentralized, transparent, and intelligent. The future belongs to those who understand that this explosion isn’t just about money — it’s about information, connection, and evolution.
Intraday Scalping Tips: Mastering the Art of Fast Profits1. What Is Intraday Scalping?
Scalping is a subset of intraday trading, but with a much shorter time frame. Instead of holding trades for hours, scalpers enter and exit positions within seconds or minutes. The goal is to capture tiny price movements, often ranging from 0.1% to 0.5%, multiple times a day.
For example, if a stock moves from ₹500 to ₹501, a scalper may book a quick profit and repeat the process across different stocks or price levels. Over the course of the day, these small gains can accumulate into substantial profits if managed properly.
However, because scalping involves high trading frequency, transaction costs, timing, and execution speed become critical factors.
2. The Psychology of a Scalper
Scalping is not just about strategy—it’s about mindset. A successful scalper must be calm under pressure, quick in decision-making, and emotionally detached from wins or losses.
Unlike swing traders, scalpers can’t afford to wait for a market to “come back.” They must accept small losses quickly and move on to the next trade. Emotional control and discipline are therefore more important than technical knowledge alone.
Key psychological traits include:
Speed and decisiveness – No hesitation when an entry or exit signal appears.
Emotional neutrality – Avoid greed after profits or frustration after losses.
Discipline – Follow your plan and respect stop-loss limits, no matter what.
3. Essential Tools for Scalping
To succeed as a scalper, you need a professional setup that allows for precision and speed:
Fast Internet Connection: Delays of even a few seconds can affect profits.
Reliable Trading Platform: Choose brokers and platforms with low latency and fast execution (like Zerodha, Angel One, or Upstox for Indian markets).
Direct Market Access (DMA): Helps execute orders directly without delays.
High-Quality Charting Software: For real-time technical analysis (e.g., TradingView).
Level 2 Data / Market Depth: To understand bid-ask spreads and liquidity levels.
Having these tools in place ensures your decisions are based on real-time data and executed without technical lag.
4. Choosing the Right Stocks for Scalping
Not every stock is suitable for scalping. The best scalping stocks share certain characteristics:
High Liquidity: The stock should have high trading volume so you can enter and exit quickly.
Tight Spreads: A small bid-ask spread ensures that transaction costs remain low.
Volatility: Moderate price movement ensures enough opportunities without erratic swings.
Popular Stocks: Large-cap or index-based stocks like Reliance Industries, HDFC Bank, or Infosys are often good choices due to consistent volume.
Scalpers usually stick to 3–5 familiar stocks daily, mastering their price behavior instead of chasing every trending name.
5. Technical Indicators That Work for Scalping
Scalping relies heavily on technical indicators for quick decision-making. Some of the most effective tools include:
Moving Averages (MA): Short-term MAs like 5-EMA and 9-EMA help identify quick trends and crossovers.
VWAP (Volume Weighted Average Price): Acts as a dynamic support and resistance level; many institutional traders use it for intraday benchmarks.
Relative Strength Index (RSI): Helps identify overbought or oversold conditions (ideal range for scalpers: 5–15 RSI periods).
Bollinger Bands: Indicate volatility and possible breakout zones.
Volume Analysis: Volume spikes often precede major price movements—critical for timing entries.
The best scalpers combine 2–3 of these tools rather than cluttering charts with too many indicators.
6. Entry and Exit Strategies
Scalping thrives on timing and precision. Here are a few commonly used strategies:
a. Breakout Scalping
Scalpers wait for the price to break above resistance or below support with strong volume confirmation. Entry happens immediately after the breakout, and exits occur once quick profit targets (0.3%–0.5%) are achieved.
b. Range Scalping
When markets move sideways, scalpers buy near the lower boundary of the range and sell near the upper boundary. Stop-losses are placed just beyond the range.
c. Momentum Scalping
In this method, traders ride short bursts of momentum caused by news, earnings releases, or large market orders. Scalpers jump in with the trend and exit at the first sign of weakness.
Regardless of the method, stop-losses must be placed immediately—typically 0.25%–0.5% below the entry price—to control risk.
7. The Importance of Risk Management
Scalping without risk management is gambling. Since gains are small, even a few large losses can wipe out profits. Effective risk control ensures survival and consistency.
Position Sizing: Don’t risk more than 1%–2% of total capital per trade.
Tight Stop-Loss: Always use stop-loss orders to cap losses quickly.
Avoid Overtrading: Set a limit on the number of trades per day. Quality over quantity.
Keep Costs in Check: Brokerage and taxes can eat into profits. Use low-cost brokers.
Successful scalpers often say: “Protect your capital first; profits will follow.”
8. Trading Discipline and Routine
Consistency is key in scalping. Having a structured trading routine ensures focus and control.
Morning Preparation:
Review pre-market news, global cues, and technical setups.
Identify your watchlist of 3–5 liquid stocks.
Mark key intraday support and resistance zones.
During Trading Hours:
Trade only within your strategy and avoid impulsive trades.
Monitor volume surges and price reactions near key levels.
Book profits quickly; don’t aim for large moves.
Post-Market Review:
Analyze your trades to identify mistakes or strengths.
Maintain a journal recording entry/exit points, emotions, and results.
This continuous improvement mindset separates professional scalpers from amateurs.
9. Avoid Common Scalping Mistakes
Even experienced traders can fall into common traps. Be aware of these:
Over-leveraging: Using too much margin increases the risk of large losses.
Ignoring News Events: Sudden announcements can cause unexpected volatility.
Chasing Trades: Don’t enter trades just because of missed opportunities.
Neglecting Transaction Costs: Frequent trading magnifies brokerage and taxes.
Lack of Patience: Waiting for the right setup is part of the discipline.
Remember, in scalping, one bad trade can ruin ten good ones.
10. Building a Winning Scalping Mindset
Success in scalping is not about winning every trade—it’s about consistency. A skilled scalper understands that small, steady gains compound over time.
Focus on process over profit:
Stick to your rules.
Accept small losses gracefully.
Never revenge-trade after a loss.
Stay humble—markets reward patience and discipline.
Professional scalpers often compare their work to that of a surgeon: precise, focused, and unemotional.
Conclusion
Intraday scalping is an art that blends speed, strategy, and discipline. It may not suit everyone—its fast pace and emotional intensity demand exceptional control and focus. However, for those who master it, scalping can be one of the most consistent and lucrative trading styles.
By understanding market micro-movements, managing risk, and following a structured trading plan, traders can turn tiny price fluctuations into meaningful daily income. In the world of scalping, success doesn’t come from predicting the market—it comes from reacting to it faster and smarter than everyone else.
Domestic Equity Market Trend1. Overview of the Domestic Equity Market
The domestic equity market refers to the marketplace within a country where shares of publicly listed companies are traded. In India, the two major stock exchanges are the National Stock Exchange (NSE) and the Bombay Stock Exchange (BSE). These exchanges provide the platform for investors to buy and sell equity shares, derivatives, and other securities.
The Indian stock market has seen remarkable growth, transitioning from a traditional broker-driven system to an advanced, technology-based environment. The benchmark indices—Nifty 50 and Sensex—serve as the barometers of the market’s overall performance, representing the health of leading sectors in the economy.
2. Recent Market Trends and Developments
In recent years, the domestic equity market has demonstrated resilience and expansion, driven by factors such as economic reforms, digitalization, and rising participation from retail investors.
a. Record Market Capitalization
India’s market capitalization crossed record highs, placing it among the top five global markets. The continuous inflow of foreign and domestic institutional funds, alongside Initial Public Offerings (IPOs) of emerging companies, has propelled the growth.
b. Retail Investor Dominance
Retail participation has surged significantly post-2020, aided by easy access to trading platforms, low brokerage costs, and increased financial literacy. Demat accounts have grown exponentially, indicating a structural shift where individuals are no longer mere spectators but active participants.
c. Sectoral Rotation
Different sectors have led the rally at different times—technology and pharmaceuticals during the pandemic, followed by banking, infrastructure, and capital goods in the recovery phase. This rotation indicates a healthy and balanced market evolution.
d. Growing SME and IPO Market
The SME (Small and Medium Enterprises) and mainboard IPO segments have gained strong traction. The appetite for new-age business models—such as fintech, renewable energy, and logistics—shows the market’s increasing acceptance of innovation-driven enterprises.
3. Key Drivers Influencing Domestic Equity Trends
a. Economic Growth
Equity markets move in tandem with GDP growth. India’s consistent growth rate, backed by manufacturing revival, infrastructure push, and consumption strength, supports bullish trends in equities.
b. Monetary Policy and Interest Rates
The Reserve Bank of India’s (RBI) policies on liquidity and interest rates play a crucial role. Lower interest rates typically boost equity valuations, as investors prefer equities over fixed-income assets for better returns.
c. Global Influences
Despite being a domestic market, Indian equities are affected by global events such as the U.S. Federal Reserve’s policy stance, crude oil price movements, geopolitical tensions, and global capital flows.
d. Corporate Earnings
Sustained improvement in quarterly corporate earnings has kept investor sentiment positive. Companies with strong balance sheets, high return on equity, and efficient management continue to attract long-term investments.
e. Technological Transformation
The rise of digital trading platforms, AI-based analytics, and algorithmic trading has enhanced liquidity and efficiency. This modernization has encouraged both professional and retail investors to engage more actively.
4. Sector-Wise Trends
The performance of the domestic equity market can be better understood by examining sectoral movements:
a. Banking and Financial Services
The banking sector has regained leadership, supported by improved asset quality, higher credit growth, and profitability. PSU banks have shown a strong turnaround, while private banks maintain their growth momentum.
b. Information Technology
While the IT sector faced margin pressures due to global slowdown concerns, it remains a structural growth driver given India’s digital transformation and global outsourcing demand.
c. Infrastructure and Capital Goods
This sector is witnessing a revival, backed by government infrastructure spending and private capex cycles. Stocks in this space are favored for long-term growth potential.
d. Energy and Renewable Sector
The energy sector is transforming rapidly with the focus shifting to renewables. Companies involved in solar, wind, and green hydrogen are drawing strong investor interest.
e. FMCG and Consumer Discretionary
Consumer-driven sectors benefit from rising income levels and urbanization. Despite inflationary pressures, demand remains robust, making them stable defensive plays.
5. Foreign Institutional Investors (FIIs) vs. Domestic Institutional Investors (DIIs)
The balance between FIIs and DIIs has become a defining factor for market stability. While FIIs bring in large capital inflows that can drive momentum, DIIs—such as mutual funds and insurance companies—help stabilize the market during volatile phases. The growing strength of DIIs reflects increasing domestic confidence in the Indian growth story.
6. Valuation and Liquidity Outlook
India’s equity valuations are relatively higher compared to peers, reflecting strong growth expectations. However, this also implies that any earnings slowdown could trigger short-term corrections. Liquidity remains ample, with consistent inflows from mutual funds and systematic investment plans (SIPs), which have become a cornerstone of long-term investing culture.
7. Policy and Regulatory Support
Reforms such as GST, Insolvency and Bankruptcy Code (IBC), Production-Linked Incentive (PLI) schemes, and Make in India have improved the investment climate. The Securities and Exchange Board of India (SEBI) continues to enhance transparency, corporate governance, and investor protection, strengthening market integrity.
8. Emerging Themes and Opportunities
a. Digital Economy and Fintech
India’s digital economy is expanding rapidly, creating investment opportunities in payment systems, e-commerce, and tech-driven services.
b. Manufacturing and “China+1” Strategy
Global supply chain diversification has made India a preferred destination for manufacturing investments, benefiting auto, electronics, and industrial sectors.
c. Green and Sustainable Investments
ESG (Environmental, Social, and Governance) investing is gaining momentum, with investors focusing on companies with sustainable practices and ethical governance.
d. Small-Cap and Mid-Cap Momentum
Smaller companies have outperformed large caps in recent times, driven by innovation, agility, and niche market leadership. However, this segment also comes with higher risk and volatility.
9. Risks and Challenges
No market is without risks. Key challenges for the domestic equity market include:
Global slowdown impacting exports and IT revenues.
Inflationary pressures leading to tighter monetary policies.
Political and regulatory uncertainties, especially around election periods.
Valuation concerns in overbought segments.
Liquidity shocks if foreign investors withdraw funds suddenly.
Long-term investors must stay alert to these risks while maintaining a diversified portfolio.
10. Long-Term Outlook
The long-term outlook for India’s domestic equity market remains optimistic and growth-oriented. Structural reforms, digital infrastructure, demographic advantage, and a strong entrepreneurial ecosystem make India a compelling investment destination. The combination of policy stability, rising domestic consumption, and innovation ensures that Indian equities remain a central focus for global investors.
Conclusion
The domestic equity market trend reflects a story of transformation, resilience, and opportunity. From being an emerging market to becoming one of the world’s fastest-growing equity destinations, India’s market evolution is driven by strong fundamentals, policy reforms, and investor participation. While short-term corrections are inevitable, the long-term trajectory remains bullish. For investors, staying informed, disciplined, and diversified is the key to navigating this ever-evolving landscape.

Sub-Brokers in India1. Who is a Sub-Broker?
A sub-broker is an intermediary who acts as a bridge between investors and stockbrokers. In simple terms, a sub-broker is an agent or franchise partner who does not directly trade on the stock exchanges but helps investors carry out their trades through a registered stockbroker.
Earlier, sub-brokers were required to register with SEBI under the SEBI (Stock Brokers and Sub-Brokers) Regulations, 1992. However, after 2018, SEBI discontinued the direct registration of new sub-brokers, shifting the model toward Authorised Persons (APs) under the exchange’s regulations (like NSE or BSE). Thus, in the current system, the term sub-broker and authorised person are used interchangeably, although “sub-broker” still exists in market terminology.
2. Evolution of Sub-Brokers in India
In the early 1990s and 2000s, the Indian capital market was dominated by physical trading and traditional brokerage houses. Investors from smaller towns had limited access to stock exchanges located in metros like Mumbai or Delhi. Sub-brokers emerged as local representatives of big brokers, offering access to markets through personalized services.
With the introduction of dematerialization, online trading, and discount brokerages, the ecosystem began to shift. Full-service brokers started expanding their presence through sub-broker networks and franchisees. After SEBI’s 2018 circular, the registration and regulatory structure changed, giving rise to the Authorised Person (AP) model, which simplified processes and brought all sub-brokers under the supervision of exchanges rather than SEBI.
Today, sub-brokers continue to play a vital role in financial inclusion, especially in tier-2 and tier-3 cities, where personal trust and relationships drive investment decisions.
3. Role and Responsibilities of Sub-Brokers
Sub-brokers perform several important functions that help the stock market ecosystem grow smoothly. Their main responsibilities include:
Client Acquisition and Relationship Management:
They identify and onboard new investors, explaining investment opportunities and helping clients open trading and demat accounts through their affiliated brokers.
Advisory Services:
Many sub-brokers provide personalized advisory support—guiding clients about market trends, suitable investment products, and portfolio diversification (though only SEBI-registered advisors can offer paid advice).
Trade Execution Assistance:
They help clients place buy/sell orders, manage trade confirmations, and ensure smooth execution through the broker’s platform.
Documentation and Compliance:
Sub-brokers assist in completing KYC (Know Your Customer) documentation and ensure compliance with SEBI and exchange rules.
After-Sales Service:
They support clients with margin updates, account statements, payout requests, and grievance redressal.
In short, sub-brokers act as the local face of big brokerage firms, ensuring last-mile connectivity and personal service to clients.
4. The Regulatory Framework
The SEBI (Stock Brokers and Sub-Brokers) Regulations, 1992 originally governed sub-broker activities. However, with changing market dynamics, SEBI simplified the process by amending the regulations.
Key milestones include:
1992: Sub-broker registration made mandatory under SEBI rules.
2018: SEBI discontinued new registrations of sub-brokers and replaced them with the Authorised Person (AP) model.
Current Framework:
A sub-broker (now AP) must be affiliated with a SEBI-registered stockbroker (member of NSE, BSE, or MCX).
The stock exchange maintains records and ensures due diligence before approving an AP.
Sub-brokers must follow all rules regarding client onboarding, KYC, and grievance handling.
Thus, while the term “sub-broker” still exists informally, all new participants are registered under the AP structure.
5. How to Become a Sub-Broker or Authorised Person
To become a sub-broker (or AP) in India, the following steps are generally followed:
Select a Broker Partner:
Choose a SEBI-registered brokerage firm like Angel One, ICICI Direct, Zerodha, Sharekhan, or Motilal Oswal that offers franchise or AP programs.
Application Process:
Submit an application to the broker and respective stock exchange with necessary documents (identity proof, educational qualification, business address, etc.).
Documentation:
The documents required typically include:
PAN and Aadhaar Card
Proof of business premises
Educational certificates (minimum 10+2)
Bank statement and canceled cheque
Photograph and signature
Exchange Approval:
The broker forwards the application to the exchange (e.g., NSE or BSE) for approval. Once approved, the applicant becomes an authorised person and can start operations.
Franchise Agreement:
A business agreement is signed between the broker and the sub-broker/AP defining revenue sharing, rights, and responsibilities.
6. Revenue Model of Sub-Brokers
Sub-brokers earn income mainly through revenue sharing with the main broker. The structure varies depending on the broker, product type, and business volume.
Common revenue models include:
Commission Sharing:
The sub-broker earns a fixed percentage of the brokerage generated by clients introduced by them. The typical sharing ratio is 60:40 to 80:20 (in favor of the sub-broker).
Referral Income:
For clients referred to digital brokers, sub-brokers may earn a one-time onboarding incentive or small lifetime brokerage sharing.
Additional Incentives:
Some brokers offer performance bonuses, marketing support, or rebates for reaching trading volume targets.
Thus, income potential depends on the sub-broker’s client base, service quality, and regional presence.
7. Advantages of Being a Sub-Broker
Low Investment, High Potential:
Unlike starting a full-fledged brokerage, becoming a sub-broker requires limited capital investment.
Established Brand Support:
Working with reputed brokers allows sub-brokers to leverage brand trust and advanced technology platforms.
Wide Product Range:
Sub-brokers can offer clients access to equities, derivatives, commodities, mutual funds, and IPOs under one platform.
Recurring Income:
Since brokerage is earned on every transaction, sub-brokers enjoy recurring revenue as long as clients remain active.
Local Market Expansion:
Sub-brokers act as key drivers of financial inclusion, helping investors from smaller cities participate in markets confidently.
8. Challenges Faced by Sub-Brokers
Despite opportunities, sub-brokers face several challenges in the modern trading environment:
Digital Disruption:
Discount brokers like Zerodha and Groww have reduced brokerage fees drastically, impacting commission-based income.
Regulatory Compliance:
Sub-brokers must stay updated with frequent SEBI and exchange rule changes.
Client Retention:
With the rise of online self-trading, retaining clients through personalized service has become more critical.
Competition:
Thousands of sub-brokers and financial distributors operate in the same localities, making differentiation difficult.
Nevertheless, many sub-brokers are adapting by embracing digital tools, offering hybrid advisory models, and focusing on long-term wealth management.
9. Future of Sub-Brokers in India
The sub-broker system is not disappearing—it is evolving. The Authorised Person model, combined with digital franchise frameworks, is making sub-brokerage more transparent, scalable, and technology-driven.
In the coming years, the focus will shift toward:
Digital client acquisition and onboarding
AI-driven advisory and analytics tools
Multi-asset offerings (stocks, mutual funds, insurance, loans)
Partner networks expanding in rural and semi-urban regions
SEBI’s vision of financial inclusion aligns well with the sub-broker model, ensuring that even small investors across India get access to capital markets.
Conclusion
Sub-brokers have been the backbone of India’s retail participation in stock markets. While their regulatory identity has evolved into that of Authorised Persons, their importance remains undiminished. They serve as the personal link between investors and markets—educating, assisting, and empowering individuals to invest confidently.
In an age of digital platforms and algorithmic trading, sub-brokers continue to add human value—trust, guidance, and service—which technology alone cannot replace. As India’s financial markets expand, the sub-broker network will remain an essential pillar of inclusive market growth and investor participation.

Banking Sector LeadershipThe Driving Force Behind Financial Stability and Growth
The banking sector is the backbone of every modern economy. It connects savers and borrowers, funds businesses, manages risks, and stabilizes markets. But at the heart of every successful banking system lies strong leadership—visionary individuals and institutions that shape financial policy, drive innovation, and sustain trust. In the last few decades, the role of leadership in the banking sector has evolved from simple financial management to strategic foresight, digital transformation, and crisis navigation.
This essay explores the meaning, importance, evolution, and future of leadership in the global and Indian banking sectors.
1. The Essence of Leadership in Banking
Leadership in the banking sector goes beyond managing money. It’s about building trust, ensuring stability, and enabling growth. Unlike other industries, banking deals with intangible assets—confidence and credibility. When people deposit their life savings in a bank or borrow for a business, they rely on the institution’s integrity and stability. Strong leadership ensures that trust remains unbroken, even in times of uncertainty.
Effective banking leaders must balance three priorities:
Financial stability: Maintaining liquidity, managing risk, and complying with regulations.
Innovation: Adapting to new technologies, customer preferences, and financial products.
Ethics and governance: Ensuring transparency, fairness, and accountability.
2. Historical Evolution of Banking Leadership
The journey of banking leadership reflects the economic evolution of societies.
Traditional Era (Pre-1980s):
Leadership was conservative and stability-oriented. Banks focused on deposits, lending, and government securities. Leaders prioritized compliance and trust-building, as technology played little role.
Liberalization and Globalization (1980s–2000s):
The rise of multinational corporations, stock markets, and deregulation changed everything. Leaders began emphasizing profitability, expansion, and competitive advantage. Figures like Jamie Dimon (JPMorgan Chase) and Deepak Parekh (HDFC) became known for balancing innovation with prudence.
Digital Transformation (2000s–2020s):
The fintech revolution redefined leadership. The focus shifted toward technology adoption, customer experience, and data-driven decisions. Leaders such as Arundhati Bhattacharya (SBI) and Uday Kotak (Kotak Mahindra Bank) showcased how traditional banking could blend with digital dynamism.
Modern Era (Post-COVID-19):
The pandemic tested leadership resilience. Remote banking, cybersecurity, ESG (Environmental, Social, and Governance) goals, and sustainable finance became the new leadership frontiers.
3. Key Traits of Effective Banking Leaders
Modern banking leadership requires a blend of financial expertise, innovation, and empathy. Below are the core traits defining successful leaders in this sector:
Visionary Thinking:
Leaders must foresee economic trends, anticipate risks, and align institutions with long-term goals. Visionary leadership prevents crises and prepares for technological shifts.
Risk Management:
Banking inherently involves risk—credit, market, and operational. Strong leaders build frameworks to manage these efficiently while avoiding overexposure.
Adaptability:
The financial landscape changes fast. Whether it's blockchain, digital currency, or changing regulations, adaptive leaders drive transformation rather than resist it.
Ethical Integrity:
Scandals and frauds can destroy banks overnight. Ethical leadership ensures transparency, compliance, and fair treatment of customers.
Customer-Centric Focus:
Leaders today must prioritize customer needs, from rural financial inclusion to seamless digital experiences.
Team Empowerment:
A strong leader builds strong teams. By fostering skill development and inclusivity, leaders prepare their organizations for sustainable growth.
4. Leadership Models in Banking
Different banks adopt different leadership styles depending on their goals and market conditions:
Transformational Leadership:
Encourages innovation and digital transformation. For example, Satya Nadella’s approach at Microsoft has inspired similar models in financial institutions focusing on culture change.
Servant Leadership:
Focuses on employee welfare and customer satisfaction. Cooperative banks and regional rural banks often follow this model.
Strategic Leadership:
Seen in global banks like HSBC or Citibank, where leaders must balance complex international regulations and strategies.
Crisis Leadership:
Essential during financial downturns, such as the 2008 global crisis. Leaders like Ben Bernanke (Federal Reserve) and Raghuram Rajan (RBI) demonstrated how proactive policy can restore stability.
5. Indian Banking Sector Leadership
India’s banking leadership landscape is a powerful blend of tradition and innovation. Some iconic examples include:
Arundhati Bhattacharya (SBI):
The first woman to lead the State Bank of India, she championed digital banking, improved governance, and promoted women in leadership.
Aditya Puri (HDFC Bank):
Known for building HDFC Bank into India’s most valuable private lender through strict discipline, innovation, and customer focus.
Uday Kotak (Kotak Mahindra Bank):
Pioneered entrepreneurial banking and emphasized capital efficiency and risk management.
Raghuram Rajan (RBI):
Brought global recognition to Indian monetary policy through transparency, macroeconomic stability, and inflation control.
Shaktikanta Das (RBI):
His leadership during the pandemic exemplified resilience—balancing growth and inflation with measured monetary policies.
Indian banking leaders have also pushed for financial inclusion, digitalization (UPI, RuPay), and green finance, making India a model for emerging economies.
6. Challenges Faced by Banking Leaders
Banking leadership today faces complex challenges:
Technological Disruption:
Fintechs and digital wallets are reshaping consumer behavior. Leaders must collaborate rather than compete blindly with fintech firms.
Cybersecurity Threats:
As digital transactions grow, so do cyberattacks. Leadership must invest in secure systems and data protection.
Regulatory Complexity:
Complying with diverse local and international regulations is a balancing act between innovation and compliance.
Economic Volatility:
Interest rate hikes, inflation, and geopolitical tensions test financial resilience.
Talent Retention:
The next generation seeks flexibility and purpose. Modern leaders must create value-driven workplaces.
7. The Future of Banking Leadership
The future of banking leadership will revolve around three pillars: digital intelligence, sustainability, and inclusivity.
Digital Intelligence:
Leaders must master AI, blockchain, and data analytics to personalize banking and improve risk models.
Sustainability and ESG Goals:
Banking leaders will increasingly fund green projects, carbon-neutral businesses, and social initiatives.
Financial Inclusion:
Leadership must ensure banking reaches every citizen, not just urban elites. India’s Jan Dhan Yojana and digital KYC models show what visionary policy can achieve.
Collaborative Ecosystems:
Banks will partner with fintech startups, tech giants, and regulators to build integrated financial ecosystems.
8. Conclusion
Leadership in the banking sector is not just about managing money—it’s about managing trust, technology, and transformation. From managing crises to embracing digital revolutions, banking leaders shape the future of economies. The best leaders combine financial prudence with social responsibility, ensuring that banking remains a force for inclusion and growth.
In a rapidly changing world, where finance merges with technology and sustainability, the next generation of banking leaders must be adaptive visionaries—balancing risk and opportunity, ethics and innovation, profit and purpose. Their success will define not just the future of banks, but the economic destiny of nations.

Part 1 Intraday Master ClassWhat Are Options?
An option is a financial contract that gives the holder the right, but not the obligation, to buy or sell an underlying asset (such as stocks, indices, or commodities) at a predetermined price (called the strike price) before or on a specific expiry date.
Options are classified into two types:
Call Option: Gives the right to buy an asset at a specific price.
Put Option: Gives the right to sell an asset at a specific price.
For this right, the buyer of an option pays a premium to the seller (writer) of the option.

ETHUSD SHOWING A GOOD UP MOVE WITH 1:10 RISK REWARDETHUSD SHOWING A GOOD
UP MOVE WITH 1:10 RISK REWARD
DUE TO THESE REASON
A. its following a rectangle pattern that stocked the market
which preventing the market to move any one direction now it trying to break the strong resistant lable
B. after the break of this rectangle it will boost the market potential for break
C. also its resisting from a strong neckline the neckline also got weeker ald the price is ready to break in the outer region
all of these reason are indicating the same thing its ready for breakout BREAKOUT trading are follws good risk reward
please dont use more than one percentage of your capitalfollow risk reward and tradeing rules
that will help you to to become a bettertrader
thank you

How will 25500 act now! As a SUPPORT or RESISTANCE!?As we can see NIFTY showed strong recovery despite opening weak exactly as analysed bt failed to close above 25500 which could potentially make 25500 psychological level as STRONG DEMAND ZONE TURNED SUPPLY ZONE but will turn void if opens gap up and sustains itself above 25500! 25500 can be ascertained as a SUPPLY ZONE only if NIFTY despite opening strong fails to hold itself above 25500 and closes below so keeping all these important points in mind, plan your trades accordingly.
Sobha- A breakout of consolidation is on cardsRealty sector has been performing well post Q2 results announcements.
Sobha has posted stellar Q2 numbers but it might be one off quarter as well.
Technically, stock is looking ripe for a good flag breakout of consolidation.
We might soon see a breakout coming but sustainment of breakout is crucial for further upmove.
Levels are mentioned on chart. We can see upside of more than 50% if breakout sustains.
You can also check other realty sector stocks and see if any similar pattern is visible.
Please note that I am just NISM certified RA and not SEBI registered.
This analysis is not a recommendation but has been shared for educational purposes only.

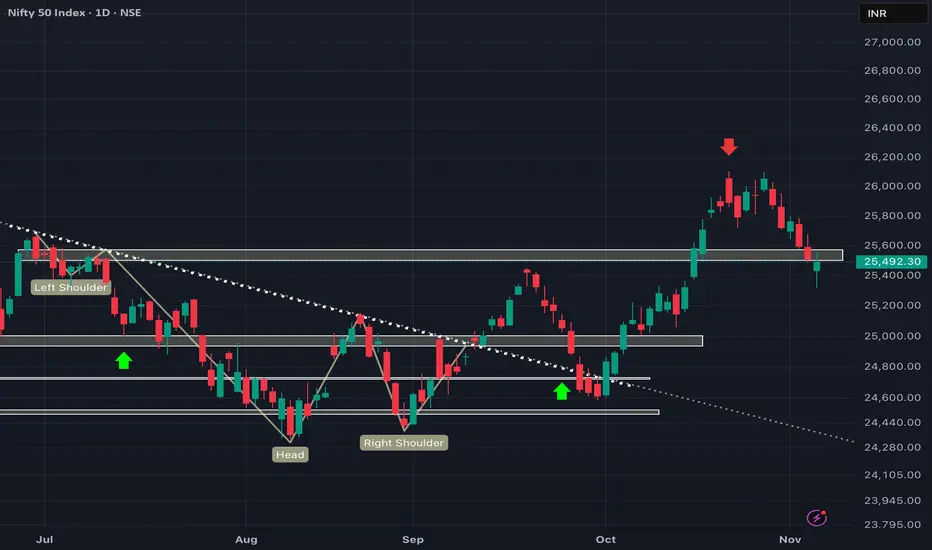
Nifty - Weekly review Nov 10 to Nov 14Last week, the price fall down gradually. Friday took support at the 25280 - 25320 support zone.
Now the price has to sustain above the 25500 zone to move up. 25700 - 25720 can act as a resistance.
The daily chart also shows a similar support/resistance zone.
Buy above 25520 with the stop loss of 25470 for the targets 25560, 25600, 25660, 25720, 25760 and 25820. This is work if the price shows bullish strength at 25500.
Sell below 25400 with the stop loss of 25450 for the targets 25360, 25320, 25260, 25220 and 25160. This will work if the price shows bearish strength around the 25500 zone.
Always do your analysis before taking any trade.

Chart Patterns Risks Involved
Time Decay: Option value decreases as expiry nears.
Volatility Risk: Rapid volatility changes can affect premiums.
Unlimited Loss for Writers: Option sellers face theoretically unlimited loss potential.
Complexity: Requires strong understanding of pricing and market movement.

Premium Chart PatternTips for Successful Trading
Always trade with a clear risk management plan.
Use stop-loss and position sizing.
Understand implied volatility before trading.
Avoid holding options till expiry unless necessary.
Start with simple strategies and move to advanced ones gradually.

Part 2 Identifying Support and ResistanceRisks in Option Trading
While options offer flexibility, they also come with inherent risks:
Time Decay: Option value erodes as expiry nears, especially for buyers.
High Volatility: Sudden volatility spikes can cause unpredictable price swings.
Leverage Risk: Small movements in the underlying can lead to large gains or losses.
Unlimited Loss Potential for Sellers: Option writers face potentially large losses, especially with uncovered (naked) positions.
Liquidity Risk: Some stock options may have wide bid-ask spreads, making entry and exit difficult.
Proper risk management, position sizing, and stop-loss mechanisms are essential for long-term success.

Part 1 Identifying Support and ResistanceWhy Trade Options?
Options serve multiple purposes in modern finance:
Hedging:
Investors use options to protect their portfolios from adverse price movements. For example, a stockholder may buy a put option to guard against a potential price fall.
Speculation:
Traders can speculate on short-term market movements with limited risk and potentially high returns. Buying calls or puts allows traders to profit from expected price directions without owning the underlying asset.
Income Generation:
Selling options (writing covered calls or cash-secured puts) generates regular income through premiums. Many institutional investors use this strategy to enhance portfolio returns.

PCR-basedTradingOption Pricing
Option prices are influenced by several factors, known collectively as the “Greeks.” These variables determine how an option’s value changes with respect to different market conditions.
Delta (Δ): Measures how much an option’s price changes for a ₹1 change in the underlying asset.
Gamma (Γ): Measures the rate of change of Delta.
Theta (Θ): Represents time decay — how much an option loses value as it nears expiry.
Vega (ν): Sensitivity to changes in volatility.
Rho (ρ): Sensitivity to changes in interest rates.
The Black-Scholes model is commonly used to estimate theoretical option prices by combining these factors.
