Part 4 Learn Institutional Trading Two Sides of an Option Trade
Every option contract involves two parties:
a. Option Buyer
Pays a premium (price of the option)
Limited risk (only the premium paid)
Unlimited profit potential in some cases
b. Option Seller (Writer)
Receives the premium
Limited profit potential
Higher risk (sometimes unlimited)
Option buyers purchase potential, while sellers sell that potential in exchange for premium income.
Trend Lines

Part 3 Learn Institutional Trading What Are Options?
Options are derivative contracts, meaning their value is derived from an underlying asset. The underlying asset may be stocks, indices, commodities, currencies, ETFs, or even cryptocurrencies.
There are two main types of options:
Call Option – Gives the buyer the right, but not the obligation, to buy the underlying asset at a specific price before a specific date.
Put Option – Gives the buyer the right, but not the obligation, to sell the underlying asset at a specific price before a specific date.
The specific price is called the strike price, and the last day the contract is valid is the expiry date.

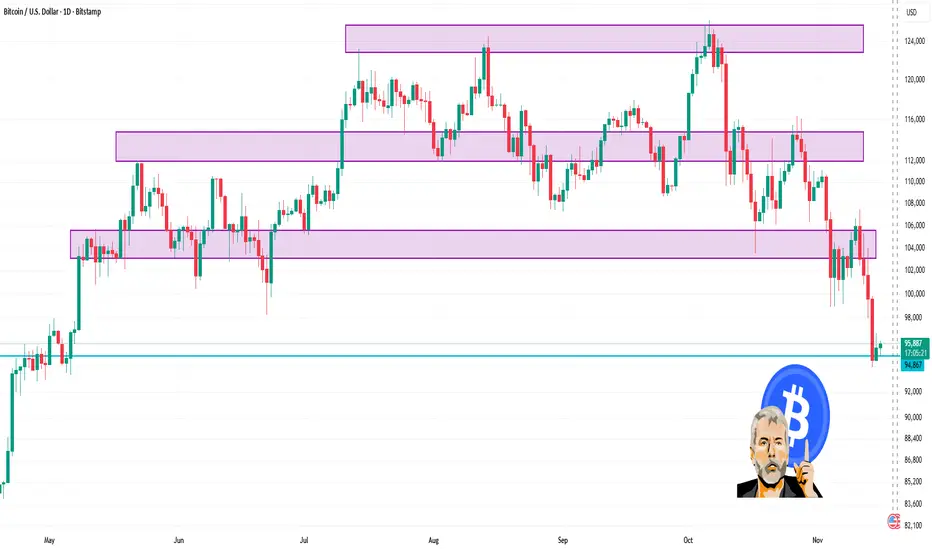
BTC 1 Day Time Frame 🔍 Price snapshot:
1. It’s trading in the vicinity of ~US$95,900 (as per latest data) per coin.
2. Daily range (roughly) sits between ~US$94,800 and ~US$96,400 (depending on source).
3. Technical summary on the daily timeframe is leaning toward a “Strong Sell / Sell” bias per one analytics page.
📌 Key levels to watch (daily chart):
1. Support zone: Around the US$94,000–95,000 area (recent lows)
2. Resistance zone: Around the US$100,000 + region (psychological + prior highs)
3. Because the data shows price trading below ~US$100,000 and bouncing near US$95,000, the latter areas act as important anchors.
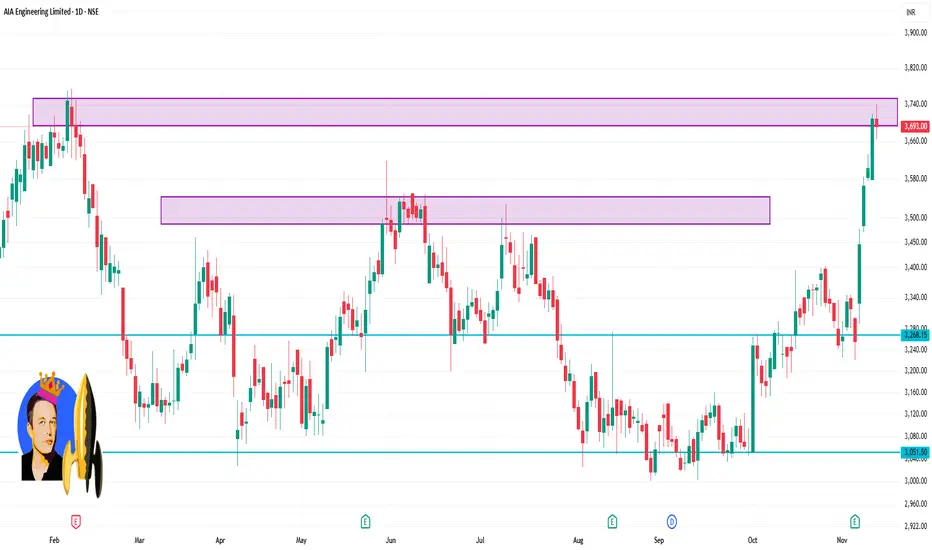
AIAENG 1 Day Time Frame Last close: ₹ 3,693.00.
Day’s range: Approx ₹ 3,665.50 to ₹ 3,740.30.
52-week high/low: ~ ₹ 3,774.60 / ₹ 3,001.10.
⚠️ Risks / Things to Watch Today (Intraday)
If price drops below the pivot ~ ₹3,311, it could test support around ₹3,280 or even further.
Strong intraday resistance around mid-MA levels — especially if it rejects around the ₹3,600+ mark.
Volume risk: without strong buying volume, momentum might fade later in the day.
Macro or sector news (mining, cement) could sharply influence this stock intraday.
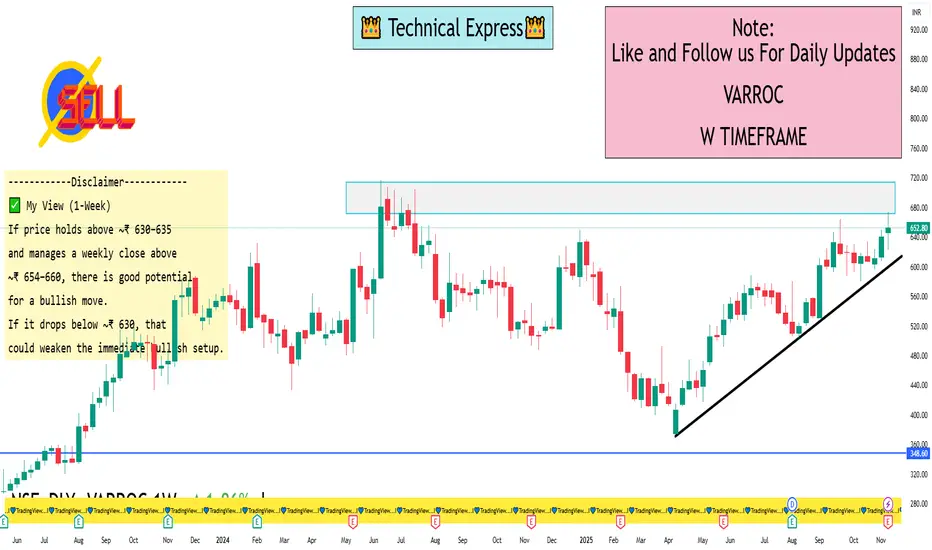
VARROC 1 Week View📊 VARROC – 1-Week (Current) Key Levels to Watch
1. Current Price
a) According to EtMoney, VARROC is around ₹ 652.45.
b) On Investing.com, the weekly technical summary is Strong Buy.
2. Support Levels (Weekly / Key Zones)
a) ~ ₹ 630–635: This zone emerges as a support area (near some pivot and past price congestion).
b) From Research360: support seen at ₹ 600.63 and then ₹ 593.82.
c) On 5paisa pivots: S1 around ₹ 622.23.
3. Resistance / Important Levels
a) ₹ 654–660: According to Investing.com’s pivot table, a pivot is at ₹ 645.3, with R1 = ₹ 654, R2 = ₹ 658.35, R3 = ₹ 667.05.
b) From Torus Digital pivot points: R1 ~ ₹ 656.37, R2 ~ ₹ 671.88.
c) On weekly chart (TradingView ideas): there’s a neckline around ~₹ 637.7 for a potential inverse head & shoulders.
4. Oscillators / Momentum
a) Weekly RSI (Moneycontrol) is ~ 63.23 — suggests bullish strength but not extremely overbought.
b) On EtMoney, short-term oscillators (daily) are showing strong uptrend (CCI is very high, MFI bullish).
✅ My View (1-Week)
If price holds above ~₹ 630–635 and manages a weekly close above ~₹ 654–660, there is good potential for a bullish move.
If it drops below ~₹ 630, that could weaken the immediate bullish setup.
Given strong weekly technicals (moving averages + momentum), the bias is mildly bullish, but confirmation at the higher resistance is important.
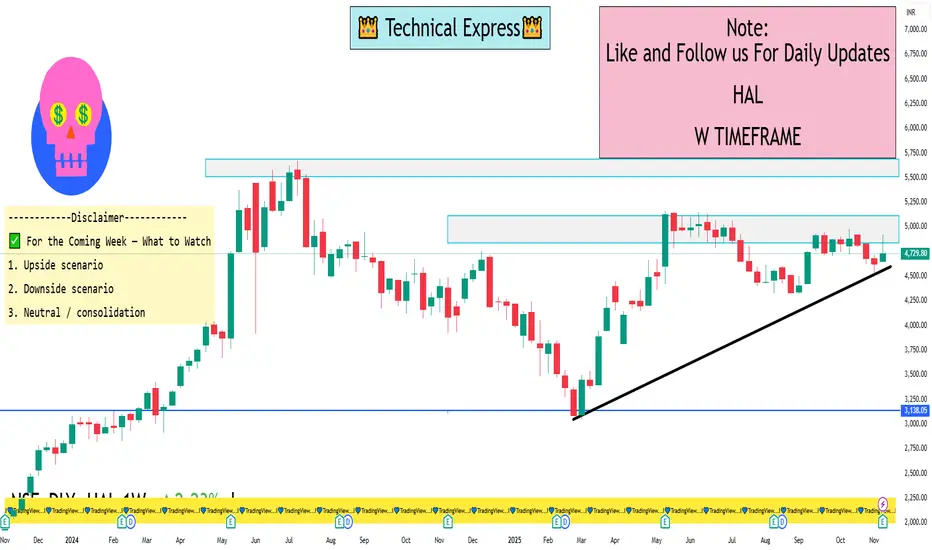
HAL 1 Week View 📌 Current Price
The stock is trading around ₹4,748 – ₹4,862 on the NSE.
The 52-week range is about ₹3,046 (low) and ₹5,165 (high).
🔍 Weekly Pivot / Support / Resistance Zones
According to one pivot-point table: Weekly Standard pivot for HAL:
Pivot ~ ₹4,762.50
Support levels: ~ ₹4,604, ₹4,478
Resistance levels: ~ ₹4,888, ₹5,046
From a technical analysis site: Weekly S1 around ₹4,530, S2 around ₹4,433; R1 ~ ₹4,719, R2 ~ ₹4,811.
✅ For the Coming Week — What to Watch
Upside scenario: If HAL holds above ~ ₹4,760 (the weekly pivot area) and breaks above ~ ₹4,888-₹5,000, the next target zone could be ~ ₹5,000-₹5,100+ (within this week) given its proximity to recent 52-week highs.
Downside scenario: If it fails to hold the pivot ~ ₹4,760 and slides below ~ ₹4,600-₹4,500, then support zones ~ ₹4,478 and ~ ₹4,433 come into play. A break below those could open more downside.
Neutral / consolidation: It may also trade sideways between ~ ₹4,600 and ~ ₹4,900 until a catalyst drives a breakout.
Automated AI Trading1. What is Automated AI Trading?
Automated AI trading is a system that uses machine-learning models to identify market patterns, predict price movements, and execute trades without human intervention. It operates on:
Data (price, volume, order flow, macro news, sentiment)
Logic (rules, model predictions, risk parameters)
Execution engines (API connectivity with brokers/exchanges)
Feedback loops (continuous learning and improvement)
Unlike traditional algo trading, which follows fixed mathematical rules (e.g., moving average crossover), AI-driven trading systems learn from data, recognize non-linear relationships, adapt to different market regimes, and evolve over time.
How AI differs from simple algos:
Traditional Algo Trading AI-Driven Trading
Follows fixed rules Learns from millions of data points
Struggles in changing markets Adapts to new volatility and structure
Limited to indicators Understands patterns, order flow, sentiment
No self-improvement Continuously improves via ML models
This shift is why the world’s biggest hedge funds—Citadel, Renaissance, Two Sigma—rely heavily on AI-powered trading.
2. Core Components of Automated AI Trading
**1. Data Collection Systems
AI learns from large amounts of data such as:
Historical price data (candles, ticks)
Volume profile and order-book data
News articles, macro releases
Social media sentiment
Company fundamentals
Global market correlations (Forex, commodities, indices)
The more accurate the data, the more powerful the AI.
2. Machine-Learning Models
AI trading uses models like:
Supervised learning → Predicting future prices from historical patterns
Unsupervised learning → Detecting hidden clusters and regimes
Reinforcement learning → Teaching models how to “reward” profitable actions
Deep learning → Working on complex and high-dimensional inputs (order flow, charts)
For example, a reinforcement learning model may learn to buy dips in a rising market and fade breakouts in a choppy market because it has “experienced” millions of simulated trades.
3. Strategy Engine
This links model predictions to market actions. It includes:
Entry signals
Exit signals
Stop-loss and target placement
Position sizing
Hedging decisions
Time-based rules
Even if the AI predicts a bullish move, the strategy engine decides:
how much capital to deploy,
how many trades to execute,
whether to trail SL or take partials,
whether to hedge via options.
4. Order Execution Engine
This is the part that actually executes trades through APIs. It handles:
Slippage control
Spread detection
Smart order routing
Latency optimization
High-frequency micro-decisions
Professional systems place orders in milliseconds to take advantage of liquidity pockets.
5. Feedback & Reinforcement System
AI trading bots track every action:
Did the model react correctly?
Was there unnecessary drawdown?
Did volatility shift?
Did correlations break?
These results feed back into the learning cycle, making the system smarter.
3. How Automated AI Trading Works Step-by-Step
Here’s a simplified version of how an AI system might trade Nifty or Bank Nifty:
Data Input:
The AI collects candlesticks, volume profile, India VIX, global cues (SGX/GIFT Nifty), news sentiment, and order-flow metrics.
Prediction:
The model predicts probabilities such as:
Market trending or ranging
Expected volatility
Direction bias (up/down/neutral)
Strength of buyers vs sellers
Signal Generation:
If the AI believes there is a 70% chance of an upside breakout based on VWAP deviation, delta imbalance, and global sentiment, it triggers a buy signal.
Risk Management:
The AI sets SL based on ATR or structure, adjusts position sizing based on volatility, and may hedge using options if needed.
Execution:
Orders are placed instantly at the best liquidity point, often slicing orders to reduce slippage.
Monitoring & Adaptation:
If volatility spikes due to news, the AI tightens stops or exits early.
Feedback Learning:
After the trade, the outcome is fed back into the model to refine future decisions.
This continuous loop is what makes AI trading so powerful.
4. Types of AI Trading Strategies
AI systems can run multiple strategy categories simultaneously:
1. Trend-Following AI Strategies
They identify trending markets using ML-based pattern recognition.
Useful for:
Indices
FX
Commodities
2. Mean Reversion AI Strategies
The AI detects overextensions or liquidity vacuum areas.
Excellent for:
Low-volatility equities
Options premium selling
3. High-Frequency Trading (HFT)
AI reads order-book microstructure and executes trades in milliseconds.
4. Arbitrage & Statistical Arbitrage
The system scans correlated assets (e.g., Nifty–BankNifty, Gold–USDINR) and identifies mispricing.
5. Option Trading AI Models
They use Greeks, IV crush patterns, gamma exposure, and flow data to:
Sell premium during low volatility
Buy options during breakout volatility expansions
Hedge positions dynamically
5. Advantages of Automated AI Trading
1. Eliminates Emotional Trading
Fear, greed, revenge trading, and FOMO are removed completely.
2. Faster Decision Making
AI can scan hundreds of markets in milliseconds.
3. High Accuracy in Pattern Recognition
It sees relationships invisible to human eyes.
4. Consistency
AI follows rules perfectly 24/7 with no fatigue.
5. Ability to Adapt
Markets shift from trending to ranging, from low to high volatility—AI systems detect these shifts early.
6. Better Risk Management
AI adjusts SL, TS, exposure, and hedging dynamically.
6. Limitations of Automated AI Trading
Despite its power, AI trading has practical challenges:
1. Overfitting Risk
Models may memorize old data and fail in live markets.
2. Regime Changes
AI trained on low-volatility years might struggle during black-swan events.
3. Technology Costs
High-quality data, GPUs, and low-latency infra are expensive.
4. Black-Box Nature
Many AI decisions lack transparency—difficult to interpret.
5. Dependency
Traders relying too much on bots may lose market intuition.
7. The Future of Automated AI Trading
The next era will combine:
AI + Market Structure
Using volume profile, liquidity zones, order-flow imbalance.
AI + Global Macro Intelligence
Models that read FOMC statements, inflation prints, and currency flows.
AI + Voice/Chat Interfaces
Traders will speak: “AI, manage my Nifty long, hedge with a put spread,” and the system will execute.
AI-Driven Portfolio Automation
Fully autonomous wealth-management engines.
We are entering a world where AI will not assist traders—it will act as a complete trading partner.
Conclusion
Automated AI trading is transforming financial markets by combining vast data processing, machine learning, and rule-based automation. It removes human emotion, enhances precision, adapts to market shifts, and executes strategies with high speed. While it comes with limitations like overfitting and model opacity, the benefits far outweigh the challenges. Whether you trade indices, equities, commodities, or options, AI will play a central role in future trading success.
Macro Events and Their Impact on the Indian Market1. Global Monetary Policy and Interest Rates
One of the strongest macro forces is the US Federal Reserve’s policy, followed by decisions from the RBI. When global central banks hike interest rates, especially the Fed, foreign investors tend to move their capital towards the US because higher yields become attractive. This leads to:
FPI outflows from Indian equities and bonds
Rupee depreciation
Volatility spikes in Nifty and Bank Nifty
RBI intervention in forex markets
Conversely, when global rates fall or the Fed hints at dovishness, money flows into emerging markets, creating rallies. Indian stocks, particularly financials and large caps, benefit the most.
2. Inflation Trends and Price Stability
Inflation is a key macro indicator. Rising inflation reduces purchasing power, increases raw material costs, and compresses corporate margins. When inflation spikes:
RBI increases interest rates
Borrowing costs rise
Economic growth slows
Sectors like banks, autos, real estate face pressure
Moderate and stable inflation supports steady growth in GDP and corporate earnings. India’s CPI data and the US inflation numbers are therefore watched closely by traders, as they shape interest rate expectations.
3. Fiscal Policies: Budget, Taxation, Government Spending
Every February, the Union Budget is one of the most powerful macro events influencing Indian markets. Government spending on infrastructure, agriculture, manufacturing, and welfare programs affects sectoral performance:
Higher capex → bullish for construction, cement, metals, railways, infra
Lower corporate tax → boosts earnings → Nifty re-rating
Changes in import/export duties → impact autos, electronics, oil & gas
Fiscal deficit numbers also matter. A high deficit worries investors because it increases borrowing and inflation risk. A lower-than-expected deficit boosts bond prices and strengthens the rupee.
4. Global Commodity Prices (Crude Oil, Gold, Metals)
India is a major importer of crude oil, so oil prices significantly impact inflation, the rupee, and fiscal deficit.
Rising crude → higher fuel prices → inflation → rate hikes → market pressure
Falling crude → lower inflation → stronger rupee → corporate margin expansion
Metal prices (aluminium, copper, steel) affect manufacturing and infra companies, while gold movements influence currencies and interest rate dynamics.
5. Geopolitical Events and Global Tensions
Geopolitical events include wars, trade tensions, sanctions, border conflicts, and diplomatic breakdowns. These events increase uncertainty, which is the enemy of financial stability. Impacts include:
Supply chain disruptions
Rising commodity prices
Risk-off sentiment globally
FPI selling in emerging markets
Recent examples such as US-China tensions, Russia-Ukraine war, and Middle East conflicts all created volatility in Indian markets.
6. Currency Movements and Rupee Dynamics
The rupee’s performance is a barometer of macro health. A depreciating rupee:
Increases import costs
Worsens inflation
Reduces foreign investor confidence
However, exporters like IT, pharma, textiles, and chemicals benefit from a weaker rupee.
A stronger rupee generally signals macro strength, lower inflation, and high capital inflows.
7. GDP Growth Trends and Economic Cycles
GDP growth is the ultimate measure of economic performance. Strong GDP growth signals a healthy economy and supports:
Higher corporate profits
Strong labor market
Rising consumption
Rising credit demand
Weak GDP prints, on the other hand, lead to:
Lower earnings estimates
Reduced valuations
Bearish market sentiment
Traders look at quarterly GDP numbers, industrial production, and PMI data to gauge the direction of the market.
8. FPI/FII and DII Flow Trends
Foreign Institutional Investors (FIIs/FPI) and Domestic Institutional Investors (DIIs) play a major role in the Indian market. FIIs react heavily to global macro events, while DIIs respond to local economic trends.
FPI buying → Nifty surges
FPI selling → sharp corrections, rupee weakens
DII buying (mutual funds, LIC) → stabilizes markets during global volatility
Tracking FPI/DII trends is crucial for predicting short-term market direction.
9. Corporate Earnings Season
Though company-specific, earnings seasons reflect the macro environment. Strong earnings indicate:
Good demand
Better pricing power
Strong credit cycle
Weak earnings reflect macro issues like inflation, currency depreciation, or weak consumer spending.
Market-wide earnings downgrades often precede significant corrections.
10. Weather Patterns, Monsoons, and Climate Risks
India is heavily dependent on the monsoon. A strong monsoon leads to:
Higher rural consumption
Better crop output
Lower food inflation
Higher GDP growth
A weak monsoon disrupts agriculture, increases food prices, and leads to inflationary pressure, forcing RBI to tighten policy. Climate change events like heatwaves or floods also impact agriculture and supply chains.
11. Political Stability and Policy Reforms
Political stability is one of India’s biggest strengths. Stable governments encourage:
Long-term reforms
Foreign investments
Stronger capital markets
Reforms such as GST, PLI schemes, disinvestment, labor law changes, and digitalization have attracted global capital. Elections are major macro events, often creating pre-result volatility.
12. Banking Sector Health and Credit Cycle
The health of the banking sector influences the overall economic cycle. Low NPAs, strong credit growth, and stable interest rates support expansion. Banking crises—like those in certain global banks—can create panic even in Indian markets.
13. Global Market Movements (US, China, Europe)
Indian markets take cues from global indices:
S&P 500, Nasdaq → tech and IT stocks
Hang Seng, Nikkei, DAX → emerging market sentiment
Risk-on/risk-off cycles decide whether money flows to India or away from it.
The Indian market typically reacts immediately to overnight US market movements.
Conclusion
Macro events are the heartbeat of the Indian financial market. They influence liquidity, valuations, risk sentiment, and corporate earnings. From global interest rates to fiscal policy, from geopolitical tensions to domestic inflation, each macro factor leaves a distinct footprint on sectors, indices, and investor behavior.
A trader who understands the macro landscape gains a tremendous edge: the ability to anticipate market moves rather than just react to them. With India becoming a global economic powerhouse, macro analysis is no longer optional—it is a necessity for successful long-term investing and profitable short-term trading.


JTEKT India Technical AnalysisHere's a comprehensive TradingView report for JTEKT India Limited:
Current Price:160.90
📊 TECHNICAL SETUP OVERVIEW
JTEKT India is displaying a compelling technical structure within a well-defined ascending channel pattern that has been in play since the 2020 lows. The stock is currently consolidating after a significant rally and appears to be setting up for the next leg of movement.
KEY TECHNICAL OBSERVATIONS
1. Channel Pattern Analysis:
- Long-term Ascending Channel: The stock has been respecting a parallel channel since 2020, with clear support and resistance boundaries
- Current Position: Trading in the middle zone of the channel, suggesting room for movement in either direction
- Channel Support: Lower trendline around 120-130 zone
- Channel Resistance: Upper trendline projecting towards 220-240 zone
2. Moving Average Structure:
All major moving averages are sloping upward, confirming a strong bullish trend across multiple timeframes.
3. Price Action Patterns:
- Clear higher highs and higher lows formation since 2020
- Recent consolidation after touching 220+ levels suggests healthy profit-booking
- Volume expansion during rallies indicates strong buying interest
- Formation of a potential inverse head and shoulders pattern on monthly timeframe
4. Support & Resistance Levels:
Immediate Support Zones:
- S1: 148-150 (8/13 EMA cluster)
- S2: 134-135 (50 EMA + channel support)
- S3: 120-122 (psychological level + lower channel boundary)
Resistance/Target Zones:
- Target 1:188.50 (Previous swing high)
- Target 2: 209.71 (Major resistance + psychological 200 level)
- Target 3: 255.40 (Channel top + Fibonacci extension)
PROJECTION & TREND ANALYSIS
Bullish Scenario (Higher Probability):
If the stock holds above 148-150 support zone:
1. First target: 188.50 (18% upside potential)
2. Breakout above 190 could trigger momentum towards 209.71
3. Ultimate target within channel: 255.40 (58% upside from current levels)
Bearish Scenario (Risk Assessment):
Break below 134 (50 EMA) could lead to:
- Retest of 120-122 zone (channel support)
- Deeper correction to 110-115 if channel breaks
- This would invalidate the current bullish setup
CONCLUSION
JTEKT India Limited presents a well-defined bullish channel with strong moving average support. The technical structure suggests the stock is consolidating before the next leg up, with multiple targets identified.
Accumulate on dips toward 148-150, add on strength above 170, with ultimate targets of 188, 210, and ₹255.
Disclaimer: This is a technical analysis for educational purposes only. Not financial advice. Technical analysis should be combined with fundamental research, and proper risk management should always be employed. Past performance does not guarantee future results.
#JTEKT #TechnicalAnalysis #StockMarket #ChannelTrading #SwingTrading #NSE #AutoSector #MovingAverages #TrendAnalysis #IndianStocks

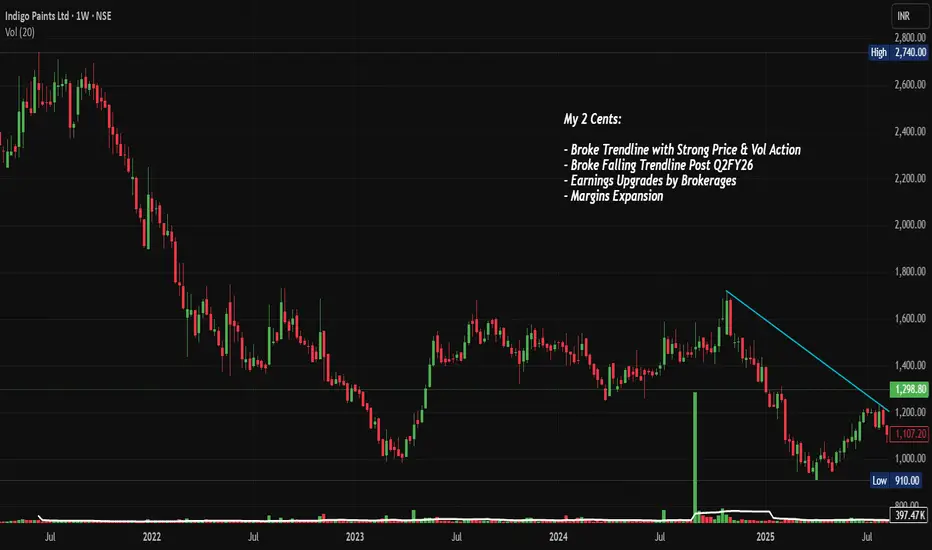
INDIGOPNTS: Trendline Breakout Post Q2FY26, Chart of the WeekWhy NSE:INDIGOPNTS Could Be Your Next Multi-Bagger: Breaking Out After a Brutal 60% Correction Post Good Q2 FY26 Numbers: Let's Analyze in Chart of The Week
As per the Latest SEBI Mandate, this isn't a Trading/Investment RECOMMENDATION nor for Educational Purposes; it is just for Informational purposes only. The chart data used is 3 Months old, as Showing Live Chart Data is not allowed according to the New SEBI Mandate.
Disclaimer: "I am not a SEBI REGISTERED RESEARCH ANALYST AND INVESTMENT ADVISER."
This analysis is intended solely for informational purposes and should not be interpreted as financial advice. It is advisable to consult a qualified financial advisor or conduct thorough research before making investment decisions.
Price Action Analysis:
Historical Price Movement:
- The stock experienced a steep downtrend from its all-time high of approximately ₹2,695 in early 2022, declining over 60% to a low of ₹910 by mid-2024
- A prolonged bear market spanning nearly two years created a massive consolidation zone between ₹1,000 and ₹1,600 during 2023-2024
- Recent price action shows a strong bullish candle in November 2024, breaking above the downward trendline with significant momentum
- The current price of ₹1,298.80 represents a sharp recovery from the lows, gaining approximately ₹294.70, or 29.35%, in the recent move
Trendline Analysis:
- A clear falling trendline (marked in cyan on the chart) connected the lower highs from the 2022 peak through mid-2024
- This trendline acted as dynamic resistance, rejecting multiple rally attempts throughout 2023 and early 2024
- The recent breakout above this multi-year trendline occurred with strong price and volume confirmation, suggesting a potential trend reversal
- The breakout candle shows conviction with a decisive close above the trendline resistance
Price Structure:
- The stock formed a descending triangle pattern from 2022 to 2024, with lower highs and relatively flat lows around ₹900-₹1,000
- Post-Q2FY26 results (released in early November 2024), the stock has shown explosive upside momentum
- The recent surge created a bullish engulfing pattern on the weekly timeframe, signaling strong buyer interest
Volume Spread Analysis:
Volume Trends:
- Volume during the downtrend was relatively subdued, indicating lack of aggressive selling pressure
- The recent breakout candle shows significantly elevated volume at 7.67 million shares, representing 587.73 thousand volume units
- This volume spike confirms genuine buying interest and institutional participation in the breakout
- Volume expansion during the rally validates the authenticity of the price move
Volume-Price Relationship:
- The correlation between rising prices and expanding volume suggests healthy accumulation
- Previous attempts to break the trendline failed due to insufficient volume support
- Current volume levels are approximately 3-4x the average, indicating strong conviction among market participants
Key Technical Levels:
Support Levels:
- Primary Support (S1): ₹1,200—This represents the previous resistance zone that should now act as support
- Secondary Support (S2): ₹1,100 - The breakout point from the falling trendline
- Major Support (S3): ₹1,000-₹1,006 - Strong psychological level and previous consolidation base
- Ultimate Support (S4): ₹910 - The 52-week low acts as the ultimate floor
Resistance Levels:
- Immediate Resistance (R1): ₹1,400 - Near-term psychological barrier
- Intermediate Resistance (R2): ₹1,600 - Previous consolidation zone highs from 2023-2024
- Major Resistance (R3): ₹1,800 - Key supply zone from the downtrend phase
- Long-term Resistance (R4): ₹2,200-₹2,400 - Retracement levels toward the all-time high
Base Formation:
- A solid base has been established between ₹900 and ₹900-₹1,100 over an extended 18-month period
- This accumulation zone represents significant institutional buying at lower levels
- The base demonstrates strong hands holding the stock, reducing downside volatility
- Multiple tests of the ₹900-₹1,000 zone without breaking down confirms strong demand
Technical Patterns:
Reversal Patterns:
- A falling wedge/descending triangle pattern formed from 2022 to 2024, which is typically a bullish reversal pattern
- The pattern shows lower highs with relatively consistent lows, indicating selling exhaustion
- A breakout from this multi-year pattern suggests a major trend change is underway
Candlestick Patterns:
- The recent weekly candle shows strong bullish characteristics with a large body and minimal upper shadow
- The candle closed near its high, indicating buyer dominance throughout the period
- Previous candles show a transition from consolidation to expansion phase
Fundamental Backdrop:
Company Overview:
- Indigo Paints is India's fourth-largest decorative paints company with strong brand recognition
- The company operates three manufacturing facilities located in Jodhpur, Kochi, and Pudukkottai
- Headquartered in Pune, Maharashtra, the company was founded in 2000 and listed on stock exchanges in 2021
- Known for innovative product launches and being first-to-market with several differentiated paint solutions
Recent Financial Performance:
- Q2FY26 revenue grew 3.45% year-on-year to ₹298 Cr., though net income grew 5.85% to ₹26 Cr, due to competitive pressures
- Gross margins expanded to 45.1% from 44.1% in the previous year, driven by softening raw material costs and premium product focus
- EBITDA margin improved to 15.3% from 14.8%, reflecting operational efficiency gains
- The company has expanded its dealer network to over 18,900 active dealers and more than 11,650 tinting machines
Growth Catalysts:
- Management expects double-digit volume growth by Q4FY25, supported by strong leading indicators like dealer fund inflows and painter token scanning
- Extended monsoon impacted August sales, but July and September showed robust growth momentum
- The company is focusing on premium product mix to defend margins against aggressive competition from new entrants
- Expansion into project sales and construction chemicals segments provides new revenue streams
Sectoral Outlook:
Indian Paint Industry Overview:
- The Indian paints and coatings market is estimated at USD 10.46 billion in 2025 and expected to reach USD 16.38 billion by 2030, growing at 9.38% CAGR
- Architectural applications account for 77.56% of market demand in 2024, driven by India's construction boom
- The decorative segment accounts for nearly 75% of total demand, with 80% coming from repainting activity
- Repainting cycles have shortened from 7-8 years to just 4-5 years, accelerating demand growth
Competitive Landscape:
- New players like Birla Opus, JSW Paints, and Pidilite have entered with aggressive strategies and significant capital expenditure
- Birla Opus alone plans to increase industry capacity by 40% over the next three years, aiming to become the second-largest manufacturer by 2025
- Revenue growth slowed to 4% in FY24 after 14-15% CAGR between FY19 and FY23 due to price cuts and competitive pressures
- Despite margin pressure, established players like Indigo maintain advantage through distribution networks and brand loyalty
Industry Drivers:
- Residential unit sales surged 30% year-on-year to 474,000 units in 2024, supported by PM Awas Yojana affordable housing scheme
- The government plans to construct 30 million affordable houses over the next five years through PM Awas Yojana
- Rising disposable incomes, urbanization, and lifestyle changes are compressing repaint intervals in major cities
- Infrastructure projects under Bharatmala and Sagarmala are driving demand for industrial and protective coatings
Bull Case:
- A technical breakout from multi-year falling trendline with strong volume confirmation suggests major trend reversal
- Established player with differentiated product portfolio and strong gross margins outperforming peers
- Sector tailwinds from government infrastructure push and housing demand provide multi-year growth runway
- Valuation correction of 60% from peak creates attractive entry point for long-term wealth creation
- Management's focus on premium products and margin expansion positions company well against competition
Bear Case:
- Intense competition from well-capitalized new entrants (JSW, Birla Opus) could pressure market share
- Slower-than-expected volume growth in Q2FY26 raises concerns about demand momentum
- Margins vulnerable to aggressive pricing by competitors offering trade discounts
- An elongated monsoon and macroeconomic uncertainties could impact near-term performance
- Stock has rallied sharply in short period, creating potential for profit-booking
Key Monitoring Points:
- Track quarterly volume growth trajectory to confirm management's guidance of double-digit growth by Q4
- Monitor gross margin trends to ensure premium strategy is working despite competitive intensity
- Watch dealer expansion metrics and market share data versus new entrants
- Observe raw material price trends, particularly crude-linked derivatives impacting costs
- Follow infrastructure spending and housing sales data as leading indicators for industry demand
My 2 Cents:
- The stock has decisively broken out from a multi-Week falling trendline resistance with exceptional volume support
- Multiple technical factors align favorably: pattern breakout, volume confirmation, base formation, and momentum shift
- Risk-reward ratio remains attractive even after the recent rally, particularly on any pullback to ₹1,200 levels
- The base formation between ₹900 and ₹900-₹1,100 provides strong downside support for long-term holders
- While near-term earnings growth is muted due to competition, the long-term sector outlook remains robust
- The company's focus on operational efficiency and margin expansion is yielding results despite challenges
NSE:INDIGOPNTS presents a compelling asymmetric risk-reward opportunity where the technical setup, fundamental improvement trajectory, and sectoral tailwinds are aligning after a prolonged correction. The breakout from a multi-year base with strong volume support provides a high-conviction entry point for wealth creation over the next 12-24 months.
Full Coverage on my Newsletter this Week
Keep in the Watchlist and DOYR.
NO RECO. For Buy/Sell.
📌Thank you for exploring my idea! I hope you found it valuable.
🙏FOLLOW for more
👍BOOST if you found it useful.
✍️COMMENT below with your views.
Meanwhile, check out my other stock ideas on the right side until this trade is activated. I would love your feedback.
As per the Latest SEBI Mandate, this isn't a Trading/Investment RECOMMENDATION nor for Educational Purposes; it is just for Informational purposes only. The chart data used is 3 Months old, as Showing Live Chart Data is not allowed according to the New SEBI Mandate.
Disclaimer: "I am not a SEBI REGISTERED RESEARCH ANALYST AND INVESTMENT ADVISER."
This analysis is intended solely for informational purposes and should not be interpreted as financial advice. It is advisable to consult a qualified financial advisor or conduct thorough research before making investment decisions.
Candle Patterns Risk Management in Options
While options offer opportunities, they also carry risks:
Selling naked options can lead to unlimited losses
High leverage can magnify mistakes
Emotional trading during volatility can destroy capital
Ignoring Greeks can cause unexpected losses
Disciplined traders use:
Stop loss
Position sizing
Hedging
Proper strategy selection
Options should always be traded with clear logic, not hope or fear.

Part 2 Ride The Big MovesMoneyness of Options
Options are classified as:
In the Money (ITM) – already profitable if exercised
At the Money (ATM) – strike close to current price
Out of the Money (OTM) – not profitable yet
Traders choose strikes based on strategy, risk appetite, and market view.
Greeks: The DNA of Options
Options behave differently based on market conditions. The Greeks measure these sensitivities:
Delta – how much the option price changes with underlying movement
Gamma – how much delta changes
Theta – time decay
Vega – sensitivity to volatility
Rho – sensitivity to interest rates
Understanding Greeks helps traders manage risk and predict option behavior.

Part 1 Ride The Big Moves Why Traders Use Options
Options offer several unique advantages:
1. Leverage
With a small premium, you can control a much larger position.
2. Hedging
Investors can protect portfolios from downside risk using puts.
3. Income Generation
Selling options—especially covered calls—creates consistent passive income.
4. Flexibility
You can profit in:
Upward markets
Downward markets
Sideways markets
High or low volatility environments
This flexibility gives options an edge over simple stock trading.

Part 2 Support and Resistance Straddle – Big Move Expected (Either Side)
Market View: Highly volatile ±10%
How it Works:
Buy ATM Call + ATM Put
If stock shoots up or crashes, you earn big
Used During:
Results day
Budget announcement
Major news event
Strangle – Cheaper Version of Straddle
Market View: High volatility expected
How it Works:
Buy OTM Call + OTM Put
Cheaper than straddle
Requires bigger move to profit

Part 1 Support and Resistance Bear Put Spread – Low Cost Bearish Trade
Market View: Moderately bearish
How it Works:
Buy ATM/ITM put
Sell lower strike put
Cheap alternative to buying a naked put
Iron Condor – Sideways Market Strategy
Market View: Neutral/Range-bound
How it Works:
Sell OTM call spread
Sell OTM put spread
Collect premium from both sides
Profit in a non-trending market
Best For:
Market consolidation
Expiry day premium decay

Option Trading Strategies Covered Call – Income Strategy
Market View: Moderately bullish
How it Works:
You hold shares of a stock.
You sell a call option on those shares.
You earn premium as profit.
Best For:
Generating fixed income in a sideways/bullish market.
Low-risk traders.
Risk: Stock may get “assigned” if it crosses strike price.

Part 2 Master Candlestick PatternBull Call Spread – Low Cost Bullish Trade
Market View: Moderately bullish
How it Works:
Buy ATM/ITM call
Sell higher strike call
Reduces cost + reduces risk
Best For:
Controlled bullish trades
Trending markets
Bear Put Spread – Low Cost Bearish Trade
Market View: Moderately bearish
How it Works:
Buy ATM/ITM put
Sell lower strike put
Cheap alternative to buying a naked put

Part 1 Master Candlestick PatternCash-Secured Put – Buying Stock at Discount
Market View: Moderately bearish
How it Works:
You sell a put option by keeping cash aside.
If stock falls, you buy it at lower (strike) price.
If stock stays above strike, you keep the premium.
Best For:
Investors wanting stock at a discount.
Very safe strategy.

LiamTrading – XAUUSD H1 | Two scenarios for the new weekLiamTrading – XAUUSD H1 | Two scenarios for the new week: wait for reactions at 4100 & Fibonacci zone – prioritise bullish trades when the market recovers
Gold is completing a technical rebound after a sharp drop, and H1 is showing two clear scenarios for the new week. The medium-term trend remains a corrective decline, but on H1, the price is in a rebound phase, so bullish trades will be prioritised – as long as the lower liquidity zones are maintained.
The key this week lies at 4100, where FVG, Fibonacci, and liquidity converge – this is the decisive point to see if gold will bounce back or continue to decline deeply.
🔍 Technical Analysis (Fibonacci • Trendline • Liquidity • Volume Zone)
Fibonacci H1: The price may rebound to Fib 0.5 (~4140–4150) – a zone with high liquidity & likely to show a bearish reaction.
Fib 0.382 (~4120–4130) is currently the first short-term resistance.
Price Structure: The medium-term downtrend is still present, but H1 is forming a rebound wave → prioritise buying when the price pulls back at the support zone.
The descending trendline is still controlling the market. If it breaks the trendline + holds above 4130–4150 → the uptrend is confirmed stronger.
Important liquidity zones:
4100: liquidity confluence + previous bullish resistance → strong reaction zone.
4085 and 4060: liquidity bottoms – if breached, it will trigger a deep decline scenario.
4032: FVG + Fibonacci bottom – the "break or hold" zone for buyers.
Key resistance this week: 4161 – 4187 – 4138 – 4111
📈 TRADING SCENARIOS FOR THE NEW WEEK
Scenario 1 – Bullish trade (priority)
Logic: Gold is rebounding; if it holds 4100 and pulls back strongly → target is the upper Fibonacci zone.
Entry: 4100–4111
SL: 4090
TP: 4138 → 4161 → 4187
Suggestion: Wait for strong signals like pin bar or engulfing H1 to confirm the rebound bottom.
Scenario 2 – Bearish trade (when the market fails to hold the bottom)
Logic: If gold breaks the H1 bottom and retests 4100 without holding → the medium-term downtrend continues to activate.
Entry: 4100–4108 (retest after break)
SL: 4120
TP: 4085 → 4060 → 4032
Suggestion: Only enter when H1 closes below 4100.
🌍 Macro Analysis – Fed causes market noise
According to the latest data from CME Watch:
54.1% chance the Fed maintains rates at 375–400 bps
45.9% chance the Fed cuts rates
The ratio is almost balanced → the market is very indecisive, creating unpredictable volatility ahead of the 10/12 meeting.
In this environment, gold often reacts strongly to unexpected news, so prioritise trading at liquidity zones – wait for clear confirmation.
⚠️ Invalidation Conditions
Price closes below 4060 → fully prioritise bearish trades.
Price closes above 4161 → strong bullish trade activated, discard all sell setups.
What scenario are you preparing for the new week?
Please comment & hit Follow on LiamTrading channel to receive the earliest analysis every day!

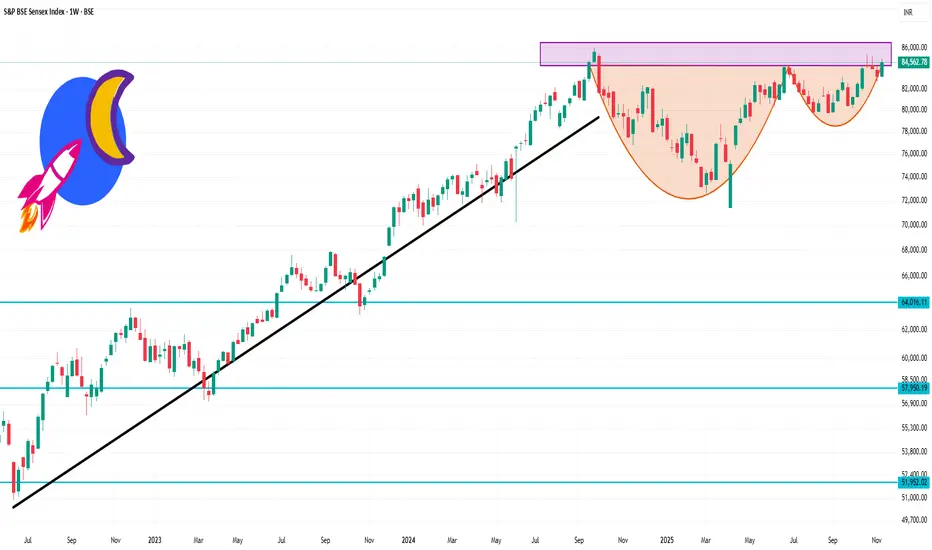
Sensex 1 Week Time Frame 🔍 Current Positioning
The index is currently trading in the ~ ₹84,500 zone.
Its 52-week high is around ₹85,290 and 52-week low is around ₹71,425.
On a weekly basis it has shown modest upward movement (~1–2 %) in the last week.
📏 Key Levels to Watch (Weekly)
Here are approximate levels to monitor for structure, support/resistance and trading bias:
Resistance zone: ~ ₹85,500–₹86,000 — near the recent highs and potential supply area.
Pivot / mid-zone: ~ ₹84,000–₹84,500 — where the index is currently hovering; acts as short-term equilibrium.
Initial support zone: ~ ₹83,000–₹83,500 — if weekly closes dip below this, risk of deeper correction increases.
Deeper support zone: ~ ₹80,000–₹81,000 — a major support on weekly view, if structure breaks lower.
📊 Weekly Structure & Bias
Because the index is near the highs, the weekly structure suggests caution: upside potential exists, but risk of consolidation or pull-back is higher given the proximity to resistance.
If we see a weekly close above ~₹85,500 with strong momentum, the bullish bias gains strength.
Conversely, a weekly break and close below ~₹83,000 would tilt structure towards a corrective phase and shift bias more neutral to bearish.
At present, the bias is moderately bullish but conditioned on support holding (i.e., above ~₹83K zone).
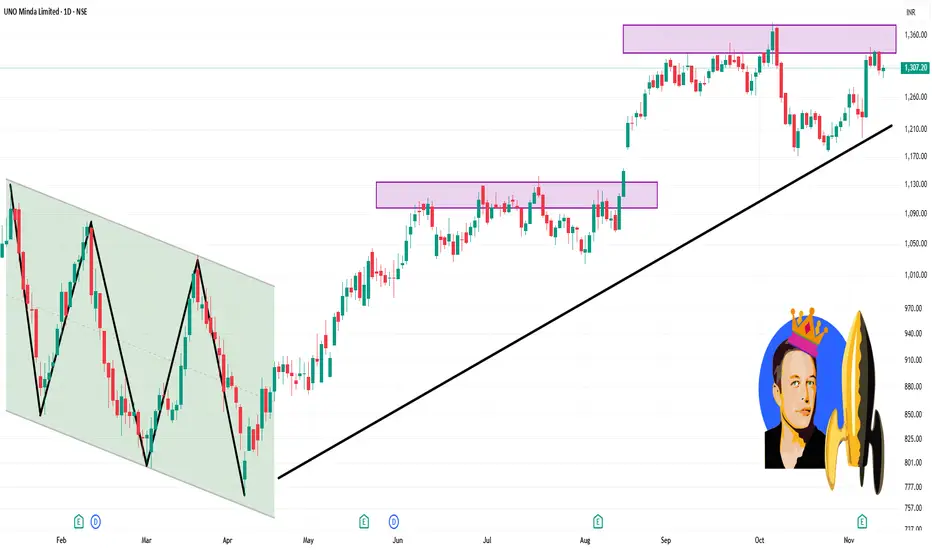
UNOMINDA 1 Day Time Frame 🔍 Current Price & Range
Last close: ~ ₹1,307.20.
Day range: ~ ₹1,290.05 (Low) → ₹1,311.05 (High).
VWAP: ~ ₹1,302.08.
✅ How to use these levels
If price holds above ₹1,290 and moves upward past ₹1,311 with volume, then a move toward ₹1,330-₹1,340 becomes plausible.
If price breaks below ₹1,290 on strong volume, watch for decline toward ~ ₹1,280 or worse.
Use stop-losses and manage risk, especially since the stock is trading near its 52-week high (~ ₹1,382) which may create stronger resistance.
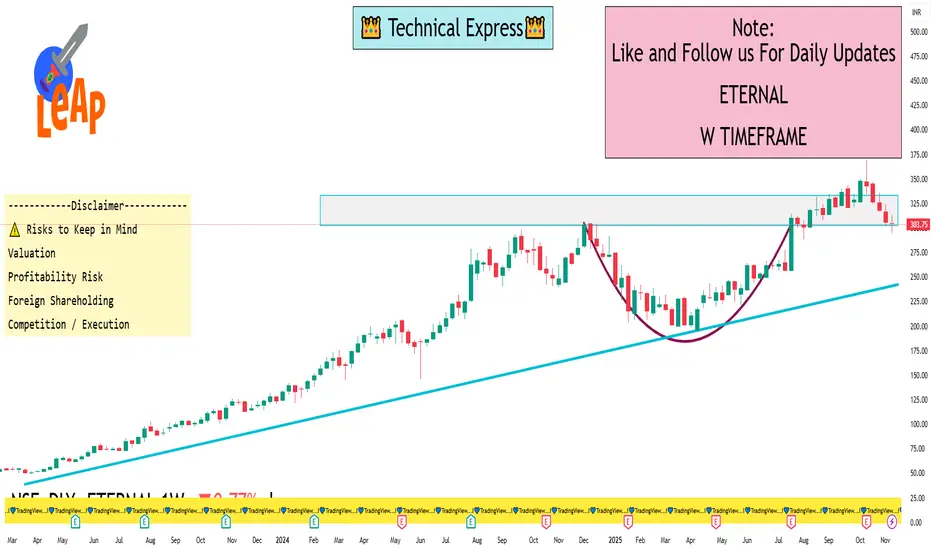
ETERNAL 1 Week View🔎 Weekly Timeframe Levels & Technical Picture
1. Current Price Context
a) Eternal is trading around ~₹303–306.
b) On 5paisa, support levels: ~₹297.3 (S1), then ~₹290.8 (S2).
c) Their 200-day SMA (on weekly or daily) is around ~₹280.2 (etMoney data).
2. Trend Structure & Key Zones
a) Major Support Zone: ~₹290–300 — this is a psychologically important zone, and there’s technical support around here.
b) Resistance / Key Level: ~₹320 — based on multiple trader viewpoints, breaking decisively above 320 could change short-term bias.
c) According to etMoney, RSI on weekly is not overly strong; momentum is somewhat neutral-to-down.
3. Chart Patterns / Candlestick Signal
a) Some traders point to a bearish engulfing pattern on the weekly.
b) If the weekly closes below ~₹320 with this pattern, the bearish case gains strength (according to those traders).
c) On the flip side, if 320 holds and price bounces, we might see a retracement or consolidation rather than a full breakdown.
4. Valuation Risk / Fundamental Pressure
a) Eternal’s valuation is very rich: its P/E is extremely high, which concerns some market participants.
b) On the fundamental side: strong revenue growth is being driven by Blinkit (quick commerce), but profit pressures remain.
c) According to a report, losses might have peaked, but execution risk remains.