Part 3 Learn Institutional Trading What is Option Trading?
Option trading is a type of financial trading where you buy and sell options contracts instead of directly trading stocks or assets. An option gives you the right, but not the obligation, to buy or sell an underlying asset (like a stock, index, or commodity) at a specific price before a certain date. Think of it as booking a deal for the future—you pay a small price now to lock in a potential opportunity. Traders use options for speculation (to make profits from price movements) or hedging (to protect against losses).
Trend Lines

Trading Forex and Currency in the Indian Market1. Introduction to Forex Trading
Forex trading involves speculating on the value of one currency relative to another. A currency pair, such as USD/INR, represents the exchange rate between two currencies. Traders make profits by predicting the rise or fall in the exchange rate between the base currency (first in the pair) and the quote currency (second in the pair).
Globally, forex trading occurs 24 hours a day across various financial centers. Unlike stock markets, forex is a decentralized over-the-counter (OTC) market, meaning there is no single exchange where trades are executed. Instead, trading happens electronically through brokers, banks, and other financial institutions.
2. Forex Trading Landscape in India
Unlike countries like the United States, the United Kingdom, or Japan, India has strict regulations governing forex trading. The Reserve Bank of India (RBI) and the Securities and Exchange Board of India (SEBI) oversee all currency trading activities to protect domestic financial stability and prevent speculative excesses.
2.1 Permitted Forex Trading Instruments in India
In India, retail forex trading is limited to currency pairs that include the Indian Rupee (INR). As per RBI guidelines, Indian residents are allowed to trade in the following currency pairs on recognized exchanges:
USD/INR – US Dollar vs Indian Rupee
EUR/INR – Euro vs Indian Rupee
GBP/INR – British Pound vs Indian Rupee
JPY/INR – Japanese Yen vs Indian Rupee
Trading in other exotic currency pairs, such as EUR/USD, GBP/JPY, or cryptocurrencies, is prohibited for Indian residents through domestic brokers. However, Indian corporates and authorized dealers may engage in certain cross-currency transactions for hedging purposes under strict compliance.
2.2 Recognized Exchanges for Forex Trading in India
Forex trading for retail traders is allowed only through recognized Indian exchanges, such as:
NSE (National Stock Exchange of India) – Offers trading in currency futures and options.
BSE (Bombay Stock Exchange) – Provides currency derivatives instruments.
MCX-SX (Metropolitan Stock Exchange of India) – Also facilitates currency derivatives trading.
Trading outside these exchanges, especially through foreign online brokers, is illegal for Indian residents and may lead to severe penalties.
3. Currency Derivatives in India
Direct forex trading as practiced in global markets (spot trading in USD/EUR, USD/JPY) is largely restricted for Indian retail traders. Instead, traders access currency markets through derivatives, which include futures and options contracts.
3.1 Currency Futures
Currency futures are standardized contracts traded on exchanges, allowing traders to buy or sell a currency at a predetermined price on a future date. Futures help traders hedge against currency fluctuations or speculate for profit. Key characteristics include:
Standardized Contract Size – Each contract specifies the amount of currency, e.g., USD 1000 per contract.
Settlement – Usually cash-settled in INR based on the exchange rate at expiry.
Leverage – Futures contracts allow traders to control a larger position with smaller capital, amplifying profits and risks.
3.2 Currency Options
Currency options give the buyer the right, but not the obligation, to buy or sell a currency at a pre-specified price on or before a certain date. Indian exchanges offer:
Call Options – Right to buy a currency.
Put Options – Right to sell a currency.
Options are particularly useful for hedging purposes, allowing businesses to protect themselves against adverse currency movements without the obligation to execute the trade.
4. Regulatory Framework
Forex trading in India is heavily regulated to prevent excessive speculation and ensure economic stability. Key regulatory aspects include:
RBI Guidelines: Regulates the types of currencies Indian residents can trade and restricts offshore forex trading.
SEBI Regulations: Oversees all derivatives contracts, including currency futures and options on recognized exchanges.
FEMA (Foreign Exchange Management Act, 1999): Prohibits unauthorized transactions in foreign currency and imposes compliance requirements for legal forex dealings.
Violation of these rules, such as trading with unregulated international brokers, can lead to penalties, freezing of accounts, and even imprisonment in severe cases.
5. Strategies for Forex Trading in India
While Indian forex trading is more regulated than global markets, traders can still employ a variety of strategies to generate profits. These include:
5.1 Technical Analysis
Technical analysis involves studying historical price data, chart patterns, and indicators to predict future price movements. Common tools include:
Moving Averages – Identify trends and reversals.
RSI (Relative Strength Index) – Measures overbought or oversold conditions.
Fibonacci Levels – Identify potential retracement levels.
5.2 Fundamental Analysis
Fundamental analysis involves evaluating economic indicators, government policies, and geopolitical events to forecast currency movements. Key factors impacting INR pairs include:
RBI interest rate decisions
Inflation and GDP data
Trade deficits and foreign investment flows
Global events like US Fed policy, oil prices, and geopolitical tensions
5.3 Hedging Strategies
Hedging is widely used by Indian corporates to mitigate foreign exchange risk. Businesses engaging in imports or exports often use currency futures and options to lock in rates, protecting profit margins from adverse currency movements.
5.4 Day Trading vs Positional Trading
Day Trading: Traders open and close positions within a day to exploit short-term price fluctuations.
Positional Trading: Traders hold positions for days or weeks, based on trend analysis and macroeconomic fundamentals.
Both approaches are feasible in the Indian currency derivatives market, though day trading requires stricter risk management due to high volatility.
6. Risk Management in Forex Trading
Forex trading, even within Indian regulations, carries significant risk due to leverage and currency volatility. Effective risk management is crucial:
Leverage Control: Avoid over-leveraging, as losses can exceed initial capital.
Stop Loss Orders: Automatically close losing positions to limit losses.
Position Sizing: Adjust trade size based on risk appetite and market conditions.
Diversification: Spread risk across multiple currency pairs instead of concentrating on one.
Understanding and managing risk is especially important in the Indian context, as sudden policy changes, RBI interventions, or global currency shocks can impact INR pairs significantly.
7. Advantages of Trading Forex in India
Despite regulatory restrictions, trading forex in India offers several advantages:
Access to Regulated Markets: Indian traders can trade currency derivatives legally, reducing the risk of fraud.
Hedging Opportunities: Indian businesses and traders can manage exposure to foreign exchange risk.
Transparency and Security: Trades conducted on recognized exchanges ensure settlement transparency.
Integration with Global Economy: With India’s growing foreign trade, understanding forex markets helps businesses and investors make informed decisions.
8. Challenges of Forex Trading in India
There are also notable challenges for Indian traders:
Limited Currency Pairs: Only INR-based pairs are allowed for retail traders.
Regulatory Restrictions: Offshore forex trading is prohibited, limiting exposure to global currency markets.
Liquidity Constraints: INR pairs may have lower liquidity compared to global pairs like EUR/USD or USD/JPY.
Volatility Risk: Sudden geopolitical events, policy changes, or RBI interventions can cause sharp price swings.
9. Future of Forex Trading in India
The Indian forex market is evolving. With increasing globalization, technological advancement, and digital trading platforms, the scope for currency trading is likely to expand. Possible trends include:
Introduction of More Currency Pairs: To increase market depth and trading options.
Enhanced Online Trading Platforms: Improved user experience and analytical tools for retail traders.
Greater Institutional Participation: Indian banks and corporates adopting sophisticated trading strategies.
Integration with Global Markets: Gradual liberalization may allow more interaction with global forex markets, although under strict compliance.
10. Conclusion
Trading forex and currencies in the Indian market is a regulated but potentially profitable avenue for traders and businesses. While direct retail trading in global currency pairs is restricted, Indian traders can access INR-based currency futures and options on recognized exchanges. Success in forex trading requires a strong understanding of market fundamentals, technical analysis, regulatory frameworks, and disciplined risk management.
India’s forex market strikes a balance between providing hedging opportunities, ensuring financial stability, and fostering investor participation. As the Indian economy grows and integrates further with global trade, forex trading will likely become more sophisticated, offering broader opportunities to both retail and institutional traders. However, adherence to legal frameworks and careful risk management remains critical to navigating this market effectively.

Blockchain and Tokenized Assets1. Introduction to Blockchain Technology
Blockchain is a decentralized digital ledger that records transactions across a network of computers in a secure, transparent, and immutable manner. Unlike traditional centralized systems, blockchain eliminates the need for intermediaries, enabling peer-to-peer transactions that are verified through consensus mechanisms.
1.1 Key Features of Blockchain
Decentralization: Data is not stored in a single location but distributed across a network of nodes, reducing vulnerability to attacks or system failures.
Transparency: Every transaction is recorded and visible to all participants in the network, fostering trust and accountability.
Immutability: Once a transaction is validated and added to the blockchain, it cannot be altered or deleted, ensuring integrity.
Security: Advanced cryptographic techniques protect transaction data from unauthorized access or tampering.
1.2 Types of Blockchains
Public Blockchain: Open to anyone (e.g., Bitcoin, Ethereum), promoting transparency but requiring energy-intensive consensus protocols like Proof of Work (PoW).
Private Blockchain: Restricted to selected participants, often used by enterprises to enhance efficiency and confidentiality.
Consortium Blockchain: Controlled by a group of organizations, offering a balance between decentralization and privacy.
2. Tokenized Assets: Definition and Concept
Tokenized assets represent real-world or digital assets in the form of digital tokens on a blockchain. Essentially, they are a digital representation of ownership or a claim on an underlying asset, such as real estate, equities, commodities, or even art.
2.1 How Tokenization Works
Tokenization involves converting the rights to an asset into a blockchain-based digital token. Each token is uniquely identifiable, can be traded on digital platforms, and carries ownership rights or benefits associated with the underlying asset.
For example:
A commercial property worth $1 million could be tokenized into 1 million tokens, each representing $1 of ownership.
These tokens can be bought, sold, or traded on digital marketplaces without the traditional friction of physical asset transfer.
2.2 Types of Tokenized Assets
Security Tokens: Represent ownership of real-world financial assets such as stocks, bonds, or revenue-sharing agreements. These are regulated under securities laws.
Utility Tokens: Grant access to a product or service within a blockchain ecosystem, like tokens used in decentralized applications (dApps).
Asset-Backed Tokens: Linked to tangible or intangible assets like gold, real estate, or intellectual property.
Non-Fungible Tokens (NFTs): Unique tokens representing ownership of digital or physical collectibles, art, or intellectual property.
3. Advantages of Blockchain and Tokenized Assets
Blockchain and tokenized assets provide several benefits over traditional financial systems:
3.1 Increased Liquidity
Traditionally, assets like real estate, fine art, or private equity have low liquidity due to complex legal processes and high transaction costs. Tokenization fractionalizes these assets, allowing smaller investors to participate and enabling easier, faster trading.
3.2 Transparency and Trust
Blockchain ensures that all transactions are recorded transparently and securely. Tokenized assets’ ownership can be traced with a clear chain of custody, reducing fraud and disputes.
3.3 Reduced Costs and Intermediaries
By eliminating middlemen such as brokers, clearinghouses, and custodians, blockchain lowers transaction fees and streamlines processes. Smart contracts—self-executing code on blockchain—automate asset transfers and payments efficiently.
3.4 Global Accessibility
Tokenized assets can be traded across borders without the need for traditional banking infrastructure. This opens investment opportunities to a global audience and democratizes access to high-value assets.
3.5 Programmable Assets
Smart contracts allow tokenized assets to carry automated rules, such as dividend payments, voting rights, or rental income distribution, enhancing efficiency and reducing human errors.
4. Applications of Tokenized Assets
Tokenized assets are being applied across multiple sectors, transforming traditional investment models.
4.1 Real Estate
Real estate is one of the most prominent use cases. Fractional ownership via tokenization enables investors to buy shares of high-value properties, participate in global real estate markets, and receive rental income through smart contracts.
4.2 Financial Securities
Tokenization of stocks, bonds, and ETFs allows instant settlement, 24/7 trading, and lower costs. Some platforms now offer tokenized equity, enabling investors to trade private company shares on secondary markets.
4.3 Commodities and Precious Metals
Gold, silver, oil, and other commodities can be tokenized for easier trading and storage. Investors can gain exposure without physically holding the asset.
4.4 Art and Collectibles
NFTs have revolutionized the art market, allowing digital and physical artworks to be tokenized and sold globally. Blockchain ensures provenance and authenticity.
4.5 Intellectual Property
Patents, trademarks, and licenses can be tokenized, allowing creators to sell or license rights while maintaining transparency of ownership.
5. Challenges and Risks
Despite their potential, blockchain and tokenized assets face certain challenges:
5.1 Regulatory Uncertainty
Tokenized assets, particularly security tokens, must comply with complex regulatory frameworks that differ across countries. Uncertainty around classification and legal enforcement can hinder adoption.
5.2 Market Volatility
Digital tokens, especially in cryptocurrency markets, can be highly volatile. This risk extends to tokenized assets linked to speculative markets.
5.3 Technology Risks
While blockchain is secure, vulnerabilities in smart contracts or poorly designed platforms can lead to hacks, fraud, or loss of funds.
5.4 Liquidity Concerns
While tokenization enhances liquidity, some tokenized markets may still lack sufficient participants, causing price inefficiencies or delays in trade execution.
5.5 Legal and Ownership Disputes
Although blockchain records transactions immutably, disputes over actual asset ownership or misrepresentation can arise, requiring legal arbitration outside the blockchain.
6. The Future of Blockchain and Tokenized Assets
The convergence of blockchain and tokenization has the potential to reshape financial markets fundamentally:
6.1 Integration with Traditional Finance
Financial institutions are increasingly exploring blockchain for asset management, cross-border payments, and securities trading. Tokenized assets could complement traditional investment vehicles, offering more efficient alternatives.
6.2 Democratization of Investment
By lowering investment thresholds and enabling fractional ownership, tokenization could make high-value assets accessible to retail investors, fostering inclusive growth.
6.3 Decentralized Finance (DeFi)
Tokenized assets are the backbone of DeFi, where financial products like lending, borrowing, and yield farming operate without intermediaries. This innovation promises to create an open, transparent financial ecosystem.
6.4 Cross-Border Asset Exchange
Global liquidity pools for tokenized assets can emerge, allowing seamless trading across borders and reducing reliance on local banking infrastructure.
6.5 Enhanced Automation and Efficiency
Smart contracts will continue to automate payments, dividend distribution, and compliance, reducing administrative overhead and human error.
7. Conclusion
Blockchain and tokenized assets represent a paradigm shift in the financial world. They provide unprecedented transparency, efficiency, and accessibility while enabling fractional ownership and global trading. Despite challenges in regulation, technology, and market adoption, the potential of these innovations is immense. As the ecosystem matures, tokenized assets could become a mainstream investment avenue, bridging the gap between traditional finance and the decentralized digital economy.
Investors, businesses, and regulators must navigate this space carefully, embracing its opportunities while mitigating risks. The next decade is likely to witness widespread adoption of tokenized assets, transforming the global financial landscape into a more inclusive, transparent, and efficient system.

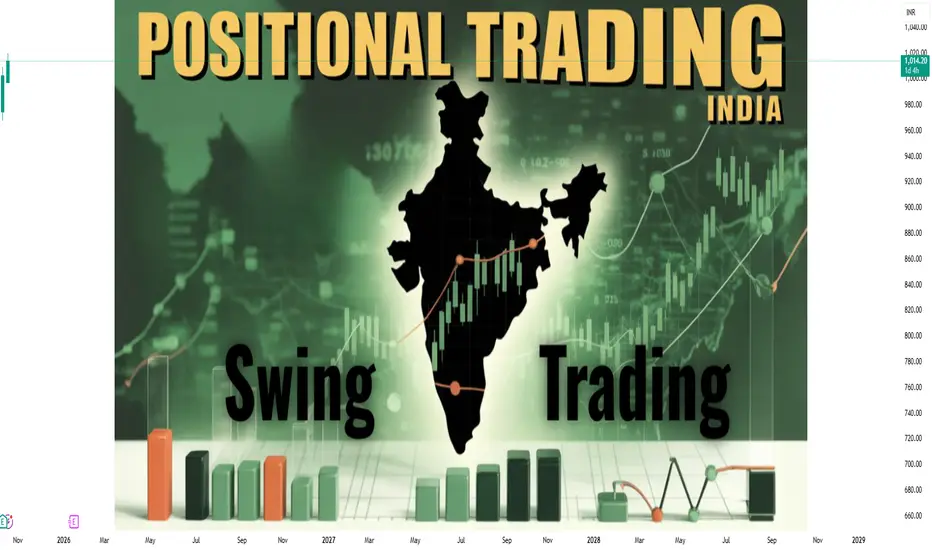
Positional Trading vs Swing Trading in India1. Definition and Core Concept
Positional Trading:
Positional trading, also known as position trading, is a medium-to-long-term trading strategy where traders hold securities for weeks, months, or even years. The core idea behind positional trading is to capitalize on major market trends rather than short-term price fluctuations. Traders analyze fundamental and technical aspects of a stock, commodity, or index to make decisions. Once a position is established, it is maintained until the market trend reverses or the target price is reached.
Swing Trading:
Swing trading, in contrast, is a short-to-medium-term strategy that focuses on capturing price “swings” within an overall trend. Swing traders typically hold positions for several days to a few weeks. The goal is to exploit market momentum and short-term price patterns using technical analysis, chart patterns, and indicators. Swing trading sits between intraday trading, which operates within a single day, and positional trading, offering a balance between time commitment and potential profitability.
2. Time Horizon
Time horizon is one of the defining differences between these two strategies.
Positional Trading: Positions are held for weeks, months, or even years. For example, a positional trader may buy shares of Reliance Industries based on its long-term growth prospects and hold until a significant price target is achieved or the fundamentals deteriorate.
Swing Trading: Positions are generally held from a few days to several weeks. For instance, a swing trader may capitalize on a bullish breakout in Tata Motors over the next 10–15 days and exit once the swing completes or momentum wanes.
In India, positional trading is ideal for investors who cannot monitor markets daily but want to benefit from long-term trends. Swing trading suits those who can check charts and news frequently but do not wish to engage in the daily grind of intraday trading.
3. Analytical Approach
The analytical methods used in these strategies differ significantly.
Positional Traders often rely on:
Fundamental Analysis: Evaluating financial statements, earnings growth, macroeconomic factors, and industry performance to determine long-term potential. For example, analyzing HDFC Bank’s balance sheet and loan portfolio to decide on a multi-month investment.
Technical Analysis: Using daily, weekly, and monthly charts to identify long-term trends, support/resistance levels, and moving averages. Indicators like MACD, RSI, and trendlines help in deciding entry and exit points.
Economic Indicators: Considering inflation, GDP growth, RBI monetary policies, and global factors influencing Indian markets.
Swing Traders primarily focus on:
Technical Patterns: Identifying chart formations like flags, triangles, head-and-shoulders, and double tops/bottoms that indicate potential price swings.
Momentum Indicators: Using RSI, stochastic oscillators, and MACD to time entries and exits.
Volume Analysis: Recognizing breakout points or reversals by tracking trading volumes.
News Catalysts: Reacting to quarterly earnings, policy announcements, or corporate developments that can trigger short-term price movements.
4. Risk and Reward Profile
Risk management varies with timeframes.
Positional Trading:
Pros: Reduced impact of daily volatility; focus on long-term trends often aligns with fundamental growth; lower trading costs due to fewer transactions.
Cons: Requires patience; positions can be exposed to overnight or gap-up/down risk; capital may be locked for extended periods.
Risk Management: Stop-loss levels are usually wider, placed beyond typical market noise, to avoid premature exits. Risk-reward ratios are typically 1:3 or higher, emphasizing substantial profit potential.
Swing Trading:
Pros: Potentially higher returns in shorter periods; more flexibility to adjust positions based on market movement; capital turnover is faster.
Cons: More frequent monitoring is required; exposure to short-term volatility and false breakouts; trading costs can accumulate due to frequent transactions.
Risk Management: Tighter stop-loss orders are essential; traders often employ risk-reward ratios of 1:2 or 1:3. Trailing stops are frequently used to lock in profits during upward swings.
5. Capital and Margin Requirements
Positional Trading: Typically requires higher capital per trade due to holding larger positions for extended periods. Brokers may allow delivery-based buying on margin, reducing the need for full upfront capital.
Swing Trading: Requires moderate capital since trades are shorter and can be leveraged via intraday or short-term derivative positions in Nifty, Bank Nifty, or stock futures. This can amplify both profits and losses.
In India, retail traders often use equity delivery for positional trades and equity derivatives or cash segments for swing trades to optimize returns.
6. Trading Frequency and Transaction Costs
Transaction costs influence net profitability in both strategies:
Positional Trading: Lower trading frequency reduces brokerage and taxes. Long-term capital gains (LTCG) tax in India applies if shares are held over a year, currently at 10% on gains exceeding ₹1 lakh, making it tax-efficient.
Swing Trading: Frequent trading attracts higher brokerage and short-term capital gains (STCG) tax at 15%, increasing the need for disciplined risk management to maintain net profitability.
7. Tools and Platforms
Both strategies benefit from advanced trading platforms and research tools:
Positional Trading: Traders rely on fundamental research portals like Moneycontrol, Screener.in, or brokerage research reports for stock selection. Charting platforms like TradingView, Zerodha Kite, or Upstox Pro assist with technical analysis.
Swing Trading: Swing traders focus heavily on real-time charts, pattern recognition tools, and intraday momentum indicators. Brokers providing robust charting, market scanners, and alerts, like Zerodha, Angel One, and Sharekhan, are preferred.
Automation through alerts and conditional orders can also benefit swing traders in executing trades at precise levels without constant screen monitoring.
8. Psychological and Emotional Considerations
Positional Trading: Requires patience and discipline to withstand short-term volatility. Traders must trust their analysis and avoid reacting impulsively to market noise. Psychological stress is lower due to longer decision intervals.
Swing Trading: Demands quicker decision-making, adaptability, and the ability to handle frequent market fluctuations. Emotional control is critical to prevent losses from panic exits or impulsive trades.
9. Market Conditions Favoring Each Strategy
Positional Trading: Works well in trending markets where the overall direction aligns with fundamental or technical signals. In India, sectors like IT, FMCG, and Banking often present long-term opportunities.
Swing Trading: Performs best in volatile or range-bound markets where short-term price swings are prominent. Momentum-driven stocks, commodities like crude oil, and indices such as Nifty or Bank Nifty are popular for swing trades.
10. Examples in Indian Markets
Positional Trade Example:
Buying Infosys shares in anticipation of long-term IT sector growth post-digitalization trends. Holding over 6–12 months allows traders to capture earnings-driven appreciation.
Swing Trade Example:
A trader identifies a bullish breakout in Tata Steel over 5–10 trading sessions based on volume surge and MACD crossover, aiming for quick gains before short-term resistance levels are hit.
These examples highlight how the strategies adapt to different risk profiles and investment horizons.
11. Combining Both Strategies
Many Indian traders combine positional and swing trading to diversify strategies:
Core-Portfolio (Positional): Long-term holdings in fundamentally strong companies for steady wealth creation.
Satellite-Portfolio (Swing): Short-term trades in volatile stocks or derivatives to boost overall returns.
This approach balances the stability of long-term investing with the agility of short-term opportunities.
12. Conclusion
In India, both positional and swing trading have unique advantages and challenges. Positional trading suits investors seeking long-term wealth creation, less daily stress, and reliance on fundamentals. Swing trading appeals to active traders aiming to capitalize on short-term price movements and market momentum.
Key differences can be summarized as follows:
Feature Positional Trading Swing Trading
Time Horizon Weeks to years Days to weeks
Analysis Fundamental + Technical Primarily Technical
Risk Exposure Moderate, long-term trends Higher, short-term volatility
Capital Requirement Higher, larger positions Moderate, frequent turnover
Transaction Costs Lower Higher
Emotional Stress Lower Higher
Ideal Market Trending markets Volatile/range-bound markets
Successful traders in India often tailor strategies to their risk tolerance, time availability, and market conditions. Positional trading provides stability and capital growth, while swing trading offers flexibility and rapid returns. Understanding both strategies allows traders to navigate the dynamic Indian market effectively, optimize profits, and manage risk efficiently.
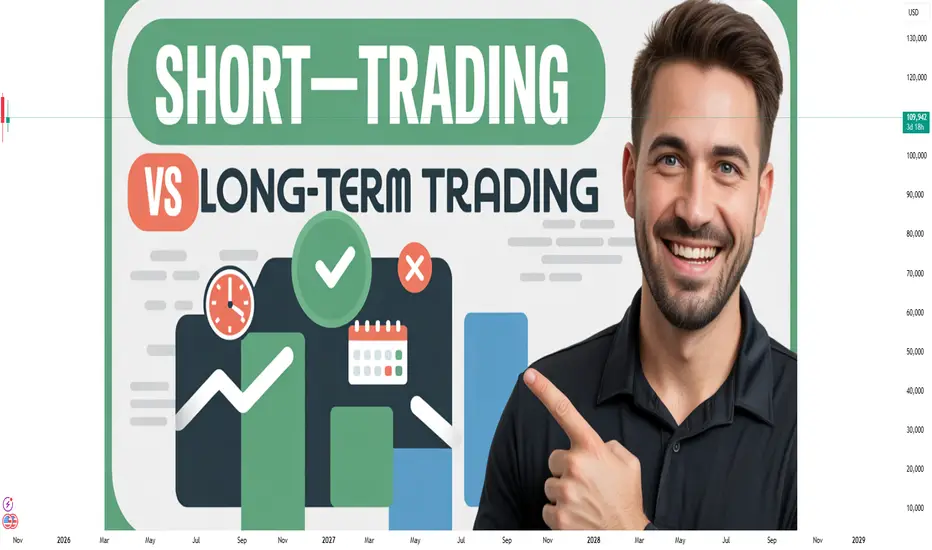
Short-Term vs Long-Term Trading: Which Is Better?1. Understanding Short-Term Trading
Short-term trading refers to buying and selling financial instruments within a relatively brief period—ranging from seconds and minutes (scalping), hours (intraday trading), or a few days (swing trading). The primary goal is to capitalize on price fluctuations in the short run. Traders often use technical analysis, charts, patterns, and market indicators to predict price movements.
1.1 Types of Short-Term Trading
Scalping: This is the fastest form of trading, where traders take advantage of very small price changes, often multiple times in a day. Trades last seconds to minutes.
Intraday Trading: Positions are opened and closed within the same trading day to avoid overnight risks. Traders focus on volatility and liquidity.
Swing Trading: Positions are held for a few days or weeks to capture short- to medium-term trends. Swing traders rely on both technical and fundamental analysis.
1.2 Advantages of Short-Term Trading
Quick Returns: Traders can make profits faster since trades are closed within a short time.
Flexibility: Traders can enter and exit positions based on market opportunities without long-term commitment.
Leverage Opportunities: Short-term traders often use margin trading to increase exposure, potentially magnifying gains.
Avoid Long-Term Market Risk: Short-term trading avoids the uncertainty of long-term market cycles, such as recessions or geopolitical events.
1.3 Challenges of Short-Term Trading
High Stress: Frequent decision-making can be psychologically taxing, requiring discipline and emotional control.
Transaction Costs: High trading frequency leads to higher commissions, spreads, and slippage, which can reduce profitability.
Need for Constant Monitoring: Short-term traders must monitor markets continuously, often requiring advanced tools and software.
Market Noise: Short-term price movements can be erratic and influenced by speculation, rumors, or temporary trends, increasing the risk of losses.
1.4 Skills Required
Short-term trading demands a strong grasp of technical analysis, understanding of market sentiment, and the ability to act quickly on signals. Traders must have risk management strategies, such as stop-loss orders, to protect capital.
2. Understanding Long-Term Trading
Long-term trading, also referred to as investing, involves holding positions for months, years, or even decades. The focus is on the fundamental value of assets rather than short-term price movements. Investors aim to benefit from capital appreciation, dividends, and compounding returns over time.
2.1 Types of Long-Term Trading
Position Trading: Investors hold assets for months to years based on macroeconomic trends and company performance.
Value Investing: Investors analyze financial statements, management quality, and intrinsic value to identify undervalued assets.
Growth Investing: Focuses on companies with high potential for revenue and earnings growth, even if current valuations are high.
2.2 Advantages of Long-Term Trading
Reduced Stress: Long-term investors are less affected by daily market fluctuations.
Lower Transaction Costs: Fewer trades mean reduced brokerage fees and taxes.
Potential for Compounding: Reinvested profits and dividends can grow significantly over time.
Less Time-Consuming: Investors don’t need to monitor markets constantly.
Alignment with Economic Growth: Over long periods, markets generally trend upward, benefiting patient investors.
2.3 Challenges of Long-Term Trading
Capital Commitment: Long-term trading requires locking funds for extended periods, which may reduce liquidity.
Market Cycles: Investments may face downturns due to recessions, policy changes, or global crises.
Slower Returns: Compared to short-term trading, profits accumulate gradually.
Emotional Discipline: Staying invested during market volatility demands patience and confidence in one’s analysis.
2.4 Skills Required
Long-term trading requires fundamental analysis, understanding of macroeconomic trends, and the ability to evaluate a company’s financial health and competitive position. Emotional discipline is also crucial to resist panic selling during downturns.
3. Factors Determining Which Approach is Better
3.1 Risk Tolerance
Short-term trading suits those with a higher risk appetite and ability to handle volatility.
Long-term trading is preferable for conservative investors who prioritize stability and compounding.
3.2 Time Availability
Short-term trading demands active monitoring, sometimes for hours each day.
Long-term trading allows investors to spend minimal time, focusing on periodic analysis.
3.3 Capital Requirements
Short-term trading may require higher capital if leverage is used but also exposes traders to potential margin calls.
Long-term trading can start with moderate capital and gradually grow through compounding.
3.4 Market Knowledge
Technical skills are critical for short-term trading, as decisions depend on patterns and signals.
Understanding macroeconomics, industry trends, and company fundamentals is key for long-term trading.
3.5 Psychological Factors
Short-term trading requires mental toughness to cope with losses and avoid impulsive decisions.
Long-term trading requires patience and confidence to stick to an investment thesis despite market fluctuations.
4. Practical Examples
Short-Term Trading Example
A swing trader spots a stock in a strong uptrend due to positive earnings announcements. They buy at $100, set a stop-loss at $95, and target $110. Within a week, the stock hits $110, generating a 10% gain. The trader exits quickly, avoiding potential market reversals. This demonstrates the speed and tactical nature of short-term trading.
Long-Term Trading Example
An investor purchases shares of a stable technology company at $50, believing in its long-term growth. Over five years, the stock grows to $150, and dividends compound annually. Despite short-term market drops, the investor earns a 200% gain, illustrating the power of patience and compounding in long-term trading.
5. Integrating Both Approaches
Many experienced traders and investors combine short-term and long-term strategies to balance risk and returns:
Core-Satellite Approach: Maintaining a long-term portfolio (core) while taking short-term trades (satellite) to capture market opportunities.
Hedging: Short-term trades can hedge risks in a long-term portfolio during periods of volatility.
Diversification: Allocating capital to both strategies allows exposure to quick profits and long-term growth.
6. Conclusion: Which is Better?
There is no one-size-fits-all answer. The choice between short-term and long-term trading depends on individual goals, personality, capital, time availability, and risk appetite:
Short-term trading is suitable for active individuals seeking quick profits, with the skill and discipline to manage risk.
Long-term trading is ideal for investors seeking stability, compounding growth, and minimal daily stress.
Ultimately, combining elements of both approaches often yields the most balanced and effective strategy. The key is understanding personal priorities and aligning trading decisions accordingly. Short-term trading may offer excitement and rapid returns, but long-term trading delivers stability, growth, and peace of mind over time.
Narrative Drives MarketThe Concept of Narrative in Markets
A narrative in the financial context is essentially a story that explains why an asset’s price should move in a certain direction. It provides a framework through which investors interpret information and make decisions. Narratives can be explicit, such as corporate press releases or analyst reports, or implicit, emerging from social sentiment, media coverage, or word-of-mouth speculation. These narratives simplify complex economic realities, creating mental shortcuts that help investors process vast amounts of information.
For example, during the dot-com boom of the late 1990s, the narrative was simple: "The Internet is the future, and every company online will grow exponentially." This narrative became a self-fulfilling prophecy, as investors poured money into internet-related stocks, driving prices to unsustainable levels, regardless of underlying earnings or cash flow.
How Narratives Influence Market Behavior
Narratives influence markets through several interconnected mechanisms:
1. Shaping Expectations
Expectations are central to financial markets. Prices are, at any moment, a reflection of what market participants collectively expect for the future. Narratives guide these expectations by framing potential outcomes. For instance, the narrative of “green energy revolution” has driven investment into electric vehicle companies, renewable energy firms, and battery technology innovators. Even in the absence of immediate profitability, the story of a sustainable future has created enormous investor enthusiasm and inflated valuations.
2. Creating Momentum
Markets often trend in the direction of prevailing narratives. When a compelling story gains traction, it attracts attention, capital, and media coverage, which in turn reinforces the narrative. This self-reinforcing loop—sometimes described as a feedback loop—can lead to momentum trading. Social media and online forums have amplified this effect, as seen in phenomena like the GameStop short squeeze, where a narrative spread across Reddit forums drove massive buying, independent of fundamental valuation.
3. Driving Herd Behavior
Narratives appeal to cognitive biases, such as confirmation bias and social proof. People are more likely to invest in assets when they perceive that “everyone else is buying” because the prevailing story validates their decision. Herd behavior can escalate price movements far beyond what fundamentals justify, creating bubbles. The housing market bubble of 2006, fueled by the narrative that "housing prices always go up," exemplifies how widespread belief can drive speculative frenzies.
4. Explaining Complexity
Financial markets are complex systems influenced by innumerable variables, many of which are impossible for any single investor to track. Narratives reduce this complexity into understandable stories. For example, macroeconomic developments, such as central bank interventions, are often simplified into narratives like "the Fed is keeping rates low to support growth," which guides investor behavior even if the underlying mechanics are more nuanced.
Historical Examples of Narrative-Driven Markets
Examining financial history reveals multiple instances where narratives have driven market movements, sometimes with dramatic consequences.
Dot-Com Bubble (1995–2000)
The dot-com era is one of the clearest examples of narrative-driven market exuberance. Investors believed that any company with a ".com" in its name would experience explosive growth. The narrative of “Internet as a new economy” created an investment frenzy. Companies with little to no revenue saw astronomical valuations. Between 1995 and 2000, the NASDAQ Composite index rose nearly 400%, driven largely by the collective belief in the transformative power of the Internet. When the narrative collapsed, so did the market, wiping out trillions in value.
Housing Market Bubble (2000–2007)
The narrative during the early 2000s was that housing prices were a safe, appreciating investment. Financial institutions propagated the story through mortgage-backed securities, rating agencies reinforced it with favorable ratings, and media outlets highlighted the prosperity of rising real estate prices. Investors, homeowners, and banks alike were guided more by this story than by fundamental risks, culminating in the 2008 financial crisis when the narrative unravelled.
Cryptocurrency Mania (2017–2021)
Bitcoin and other cryptocurrencies illustrate how narratives can influence modern markets. The stories vary—from “digital gold” to “the currency of the future”—and have fueled rapid adoption and price surges. In 2017, Bitcoin surged from $1,000 to nearly $20,000 on narratives of decentralized finance and borderless currency. While technical and regulatory factors also played a role, the central driver was collective belief in a transformative story.
Psychological Foundations of Narrative Influence
Behavioral finance and cognitive psychology offer insights into why narratives wield such influence over markets:
1. Cognitive Biases
Humans are wired to favor stories over raw data. Narratives make complex phenomena relatable and memorable. Confirmation bias ensures that investors favor information supporting the prevailing story, ignoring contradictory evidence. This selective perception reinforces market trends and amplifies momentum.
2. Emotional Engagement
Stories evoke emotion, which plays a critical role in decision-making. Fear, greed, optimism, and hope are often triggered by narratives rather than numbers. For example, a compelling story about a small tech startup’s revolutionary product can generate enthusiasm, leading to aggressive investment even when financial statements suggest caution.
3. Social Proof and Collective Belief
Humans are social creatures, influenced by the behavior and opinions of others. In financial markets, the perception that a narrative is widely accepted increases confidence in it, further driving adoption. Social media has magnified this effect, allowing stories to reach millions instantly and create coordinated market action.
Modern Implications of Narrative-Driven Markets
In today’s interconnected and fast-paced financial environment, narratives play an even more powerful role. Several factors have heightened their influence:
1. Social Media Amplification
Platforms like Twitter, Reddit, and LinkedIn enable rapid dissemination of stories and opinions. Narratives can go viral within hours, influencing millions of investors globally. Meme stocks, cryptocurrency pumps, and ESG investing trends are examples of narratives amplified through social media.
2. Algorithmic and Retail Participation
Retail investors, increasingly organized and informed by narratives circulating online, participate in markets at unprecedented scales. Simultaneously, algorithmic trading systems can detect and amplify trends based on sentiment analysis, further linking narratives to price movements.
3. Short-Term Market Volatility
Narratives can create significant short-term volatility. News stories, rumors, and corporate announcements can spark dramatic price swings as the market reacts to perceived stories rather than fundamentals. Companies with strong narrative appeal, such as Tesla under Elon Musk, often experience volatile price movements tied to evolving stories rather than earnings reports alone.
4. Investment and Risk Strategies
Understanding that narratives drive markets has profound implications for risk management and investment strategy. Investors who can identify emerging narratives early may profit from the ensuing market movements. Conversely, awareness of narrative-driven bubbles can help avoid overexposure to overhyped assets.
Case Study: Tesla
Tesla Inc. provides a modern example of narrative-driven valuation. While Tesla produces electric vehicles and solar products, much of its stock price movement has been influenced by the story of Elon Musk as a visionary entrepreneur and the narrative of a sustainable, electric future. Investors often buy into Tesla not merely for present earnings but for the story of technological leadership, market disruption, and environmental transformation. This narrative has propelled Tesla to valuation levels that far exceed traditional automotive companies, reflecting the market’s appetite for compelling stories.
Critiques and Limitations
While narratives are powerful, relying solely on them can be dangerous. Stories can be misleading, incomplete, or deliberately manipulated. Market participants driven exclusively by narratives may overlook fundamentals, leading to bubbles and crashes. Therefore, discerning investors balance narrative awareness with rigorous analysis, using stories to inform intuition rather than dictate decisions.
Conclusion
Financial markets are shaped by more than spreadsheets and economic indicators—they are profoundly influenced by narratives, the stories that investors tell themselves and each other. Narratives simplify complexity, shape expectations, create momentum, and drive collective behavior. From the dot-com bubble to modern cryptocurrency markets, history repeatedly demonstrates that compelling stories can move prices, attract capital, and even create entire market cycles.
In the contemporary environment, where social media accelerates the spread of ideas and retail investors actively participate in markets, understanding narratives is not optional—it is essential. Recognizing the power of stories allows investors to anticipate trends, avoid traps, and harness the collective psychology that drives market movements. Ultimately, markets are human systems, and human systems are shaped by stories. The most successful market participants are those who understand that while numbers inform, narratives inspire.

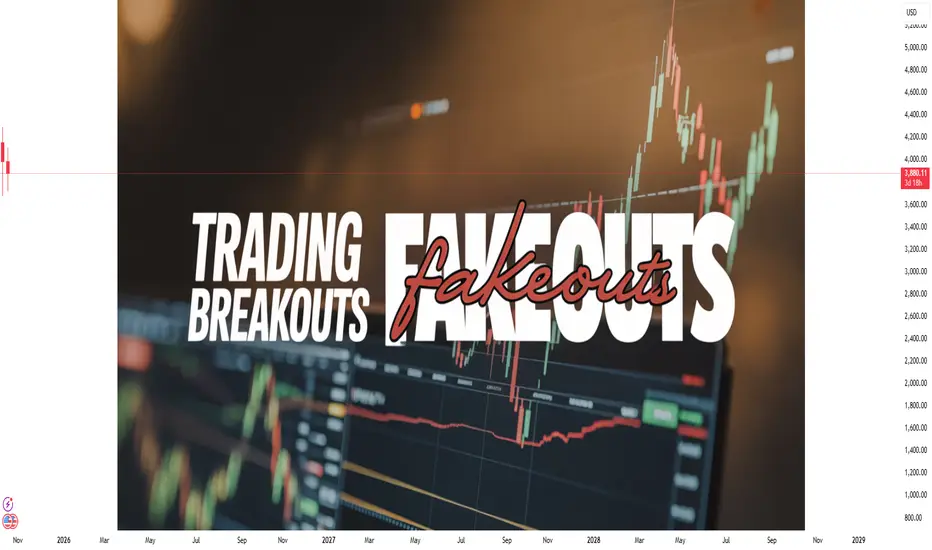
Trading Breakouts and Fakeouts: An In-Depth Analysis1. Understanding Breakouts
A breakout occurs when the price of an asset moves beyond a defined support or resistance level with increased volume. These levels act as psychological barriers where buyers or sellers have historically exerted control. A breakout signals a potential new trend and can present a lucrative trading opportunity.
Support Level: A price level where buying interest is strong enough to prevent further decline.
Resistance Level: A price level where selling pressure exceeds buying interest, preventing further ascent.
Breakouts indicate that the equilibrium between supply and demand has shifted, creating a momentum-driven price movement. Traders look for these opportunities as the market often continues moving in the breakout direction, at least in the short term.
Types of Breakouts
Upside Breakout: Occurs when the price moves above a resistance level. Often seen as a bullish signal indicating further upward movement.
Downside Breakout: Happens when the price falls below a support level. This is a bearish signal suggesting continued downward pressure.
Volatility Breakout: Happens when price moves beyond a consolidation range, indicating increased volatility.
Pattern-Based Breakout: Triggered by the completion of chart patterns such as triangles, head-and-shoulders, flags, or rectangles.
2. Factors Driving Breakouts
Breakouts are not random; several market factors contribute to their formation:
Fundamental Drivers: News releases, earnings reports, economic data, geopolitical events, or monetary policy announcements can trigger a breakout.
Technical Triggers: Long-term resistance or support levels, trendlines, and chart patterns attract attention from technical traders, amplifying price movements.
Volume Confirmation: A genuine breakout is usually accompanied by a significant increase in trading volume, signaling strong market interest and conviction.
Market Sentiment: Collective trader psychology plays a role. Fear and greed can accelerate breakouts as traders rush to capitalize on perceived opportunities.
3. Breakout Trading Strategies
Effective breakout trading relies on proper timing, risk management, and confirmation. Below are widely used strategies:
A. Entry Techniques
Wait for Close Beyond Level: Traders often wait for the price to close beyond the support/resistance level rather than reacting to intraday spikes.
Volume Confirmation: Look for above-average trading volume to confirm the breakout's strength.
Breakout Pullback: Sometimes, prices retest the breakout level. Entering after a successful retest can reduce false signals.
B. Risk Management
Stop Loss Placement: Place stop-loss orders slightly below the breakout point for long positions and above for short positions.
Position Sizing: Limit exposure to reduce the impact of sudden reversals.
Target Projection: Measure the height of the previous consolidation range to project price targets post-breakout.
C. Timeframe Consideration
Breakout signals vary across timeframes. Higher timeframes (daily, weekly) tend to offer more reliable breakouts, whereas intraday breakouts (5-min, 15-min charts) are more prone to fakeouts.
4. Understanding Fakeouts
A fakeout is a false breakout where the price moves beyond a key level but quickly reverses direction. Fakeouts can trap traders who enter positions prematurely, leading to losses. Recognizing fakeouts is essential to avoid falling into “breakout traps.”
Why Fakeouts Happen
Liquidity Hunting: Large institutional players may push prices beyond levels temporarily to trigger stop-loss orders of retail traders, then reverse.
Market Manipulation: In illiquid markets, price can be deliberately pushed to create misleading breakouts.
Psychological Reactions: Traders’ overconfidence can lead to impulsive entries, resulting in fakeout scenarios.
Lack of Volume: Breakouts without sufficient volume often fail to sustain, reverting to previous levels.
Common Fakeout Patterns
False Break Above Resistance: Price breaches resistance, but selling pressure soon overwhelms buyers.
False Break Below Support: Price dips below support, only to rebound as buying interest returns.
Wicks or Shadows: Candlestick charts often show long upper or lower shadows indicating rejection at breakout levels.
5. Identifying Fakeouts vs Genuine Breakouts
Differentiating between fakeouts and genuine breakouts requires careful observation:
Volume Analysis: Genuine breakouts are typically supported by strong volume. Low volume breakouts are more likely fakeouts.
Price Action Confirmation: Wait for consecutive closes beyond the level to confirm strength.
Market Context: Analyze broader trends and sentiment. Breakouts in alignment with trends are more reliable.
Indicators: Technical indicators such as RSI, MACD, and Bollinger Bands can provide clues. Divergence or overbought/oversold conditions may hint at potential fakeouts.
Timeframe Cross-Check: Confirm breakouts across multiple timeframes to ensure authenticity.
6. Psychological Aspects of Breakouts and Fakeouts
Trader psychology plays a pivotal role in breakouts and fakeouts:
Herd Mentality: Traders tend to follow momentum blindly, contributing to breakout acceleration or fakeout formation.
Fear and Greed: Overreaction to news or technical signals can trigger impulsive trades.
Confirmation Bias: Traders may convince themselves a breakout is genuine despite contrary signals, increasing susceptibility to fakeouts.
Patience and Discipline: Waiting for confirmation rather than entering prematurely is critical to successful breakout trading.
7. Risk Management Techniques for Breakout Trading
Breakout trading carries inherent risk. Effective strategies include:
Stop Loss Discipline: Placing stop-loss orders near the breakout point prevents large losses.
Diversification: Avoid overexposure to a single asset or breakout signal.
Trailing Stops: Protect profits by moving stops in the breakout direction.
Scaling In and Out: Gradually increase position size as the breakout proves itself, and consider partial exits at price targets.
8. Practical Examples
Example 1: Upside Breakout
Suppose a stock repeatedly tests resistance at $50. One day, it closes at $52 with high volume. Traders who enter the trade expect a continued upward trend. If the breakout is genuine, the price may climb to $60, with stop-losses placed just below $50.
Example 2: Fakeout
The same stock tests $50, briefly spikes to $52, but then falls back below $50 within hours. Traders who entered during the spike are trapped. Observing low volume and short-lived candlestick patterns could have prevented this loss.
9. Tools to Enhance Breakout Trading
Volume Indicators: On-Balance Volume (OBV), Volume Oscillator.
Trend Indicators: Moving Averages, MACD.
Volatility Indicators: Bollinger Bands, ATR (Average True Range).
Chart Patterns: Triangles, Flags, Pennants, Rectangles.
Candlestick Patterns: Engulfing patterns, Pin Bars, Doji formations.
10. Combining Breakout Trading with Other Strategies
Momentum Trading: Breakouts often align with momentum strategies. Combining them can enhance success rates.
Trend Following: Breakouts within strong trends are more likely genuine, offering high-probability trades.
Swing Trading: Breakout and fakeout analysis helps swing traders identify optimal entry and exit points.
Scalping: Intraday traders can exploit small breakout movements but must remain vigilant for fakeouts.
11. Common Mistakes in Breakout Trading
Entering Too Early: Jumping in before confirmation increases exposure to fakeouts.
Ignoring Volume: Trading breakouts without volume analysis often leads to losses.
Overleveraging: Using high leverage on breakouts can amplify losses during reversals.
Failure to Adjust Stops: Not trailing stop-losses or adjusting targets can erode profits.
Neglecting Market Context: Breakouts against the trend are riskier and more likely to fail.
12. Conclusion
Breakout and fakeout trading are fundamental concepts in technical analysis that offer lucrative opportunities when approached strategically. Breakouts signal market shifts and potential trend formations, while fakeouts remind traders of the risks associated with premature or misinformed entries. Successful trading requires a combination of:
Technical skills (chart analysis, pattern recognition, volume study)
Psychological discipline (patience, fear management, avoiding herd behavior)
Risk management (stop-loss placement, position sizing, diversification)
By understanding market mechanics, observing price and volume behavior, and integrating breakout and fakeout strategies with other trading techniques, traders can navigate financial markets more confidently and minimize the pitfalls of false signals. Ultimately, mastering breakouts and fakeouts equips traders with a sharper lens through which to interpret market movements and maximize returns.
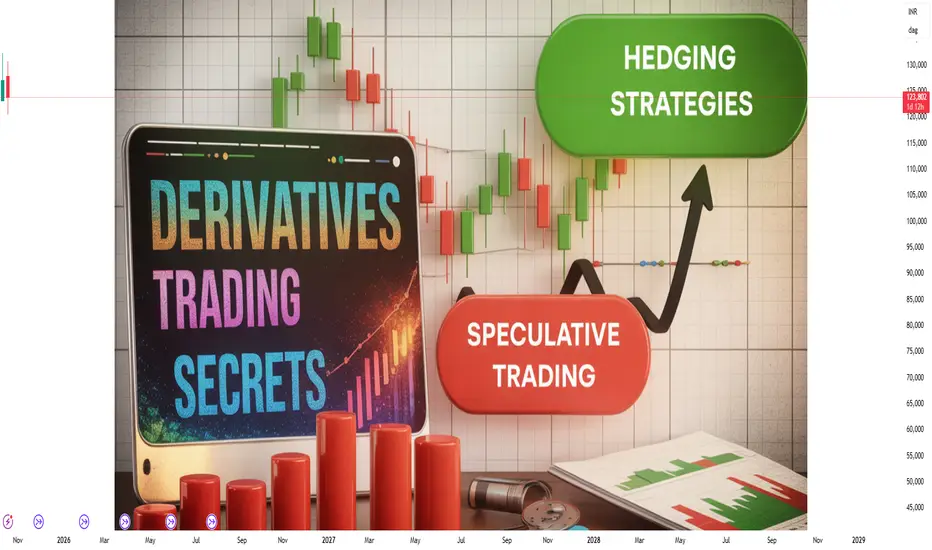
Derivative Trading Secrets: The Power of Financial Instruments1. Understanding Derivatives: The Foundation of Trading
At its core, a derivative is a financial instrument whose value depends on the price of an underlying asset. This underlying asset could be a stock, commodity, currency, interest rate, or even another derivative. Derivatives allow traders to speculate on price movements, hedge existing positions, and optimize portfolios.
The most common types of derivatives include:
Futures Contracts: Agreements to buy or sell an asset at a predetermined price at a specific future date. Futures are standardized and traded on exchanges.
Options Contracts: Contracts that give the buyer the right, but not the obligation, to buy (call option) or sell (put option) an underlying asset at a specified price before or on a specific date.
Swaps: Agreements to exchange cash flows or other financial instruments between parties, often used for interest rates or currencies.
Forwards: Similar to futures but are customized contracts traded over-the-counter (OTC) instead of on an exchange.
Secret Insight #1: The true power of derivatives lies not in the instruments themselves but in understanding their relationship with the underlying asset. Every option or futures contract is essentially a tool to manage risk or leverage opportunity—but misuse can magnify losses.
2. Leverage: A Double-Edged Sword
One of the most enticing aspects of derivatives is leverage. By putting down a fraction of the asset’s value, traders can control large positions. For instance, with a futures contract, you might control $100,000 worth of stock by investing just $10,000 as margin.
However, leverage is a double-edged sword. While profits can multiply, losses do too. Understanding the margin requirements, initial margin, and maintenance margin is critical. Secretly successful derivative traders treat leverage as a tool for precision, not speculation.
Secret Insight #2: The best traders use leverage conservatively and adjust it dynamically based on market volatility, rather than maximizing exposure blindly.
3. Hedging: Risk Management is the Hidden Key
While derivatives are often associated with speculation, professional traders primarily use them to hedge risk. Hedging involves taking a position in a derivative to offset potential losses in the underlying asset.
Example: A portfolio manager holding a large number of tech stocks may buy put options to protect against a market downturn. If stocks fall, the profit from the put options offsets the loss.
Cross-Hedging: Traders sometimes hedge using derivatives of a correlated asset when a direct hedge is unavailable.
Secret Insight #3: The most powerful secret in derivative trading is that you don’t always need to predict market direction to profit. Proper hedging ensures survival, which is the real foundation of consistent trading success.
4. Options: The Playground of Strategic Trading
Options offer unmatched flexibility, and understanding advanced options strategies separates amateurs from pros. Some commonly used strategies include:
Covered Call: Holding the underlying stock and selling call options to earn premiums while slightly limiting upside.
Protective Put: Buying a put option to protect an existing long position.
Straddles and Strangles: Betting on volatility rather than direction, buying calls and puts simultaneously to profit from big price swings.
Spreads: Using multiple options with different strike prices or expirations to limit risk while maintaining potential profit.
Secret Insight #4: Options are not just instruments for speculation; they are precision tools to tailor your risk-reward profile. Successful traders often combine multiple strategies to create synthetic positions that mimic market exposure while controlling risk.
5. Timing and Volatility: The Invisible Forces
A critical, often underappreciated, aspect of derivative trading is timing. Unlike stocks, the value of options and futures is heavily influenced by time decay (theta) and implied volatility (IV).
Time Decay: Options lose value as expiration approaches, a phenomenon most novice traders underestimate.
Implied Volatility: Options pricing depends on expected future volatility. Traders who anticipate shifts in IV can profit even if the underlying price remains steady.
Secret Insight #5: Mastering derivatives is largely about mastering the clock and the market’s emotional state. High volatility periods are opportunities for premium collection, while calm markets favor directional bets.
6. Arbitrage and Mispricing: The Professional Edge
Arbitrage opportunities arise when derivatives are mispriced relative to their underlying assets. For instance, a futures contract trading below its theoretical fair value creates a cash-and-carry arbitrage opportunity. Similarly, options mispricing can be exploited via synthetic positions.
Secret Insight #6: Most retail traders compete to predict price direction, while professionals often profit from inefficiencies and mispricings. Knowing when the market is wrong can be more profitable than knowing when it is right.
7. The Psychology of Derivative Trading
A secret often hidden in textbooks is that derivative trading is as much psychological as technical. The leverage and speed of derivatives amplify emotions—fear and greed can lead to catastrophic losses. Successful traders exhibit:
Discipline: Strict adherence to trading plans and risk limits.
Patience: Waiting for high-probability setups rather than chasing the market.
Adaptability: Adjusting positions dynamically based on market conditions rather than stubbornly sticking to predictions.
Secret Insight #7: Emotional intelligence is a derivative trader’s secret weapon. The market always offers opportunities, but controlling yourself ensures survival and long-term profitability.
8. Risk Management: Protect First, Profit Later
Perhaps the most critical secret in derivative trading is risk management. Traders often focus on potential profit while neglecting potential losses. Key principles include:
Position Sizing: Never risk more than a small percentage of total capital on a single trade.
Stop Losses: Automated or mental exit points prevent small losses from becoming catastrophic.
Portfolio Hedging: Diversifying exposure across different assets, sectors, or derivative types.
Margin Monitoring: Avoid over-leverage, which can trigger margin calls in volatile markets.
Secret Insight #8: The goal is not to win every trade but to avoid ruin. Derivative trading secrets favor survival and compounding small wins over chasing high-risk “big wins.”
9. Insider Tools and Data: The Market Edge
Advanced traders gain an edge by leveraging tools that provide insight into market positioning:
Open Interest and Volume Analysis: Tracking changes in futures and options can reveal market sentiment.
Implied Volatility Surfaces: Understanding IV across strikes and expirations helps spot mispricing.
Correlation and Greeks Analysis: Delta, gamma, theta, vega, and rho metrics allow traders to quantify sensitivity to market changes.
Secret Insight #9: Successful derivative traders treat data as fuel. Knowing how the market is positioned can help anticipate moves before they happen.
10. Continuous Learning: The Lifelong Secret
Derivatives are dynamic; markets evolve, instruments get more complex, and strategies shift with regulatory and economic changes. Traders who stay ahead are lifelong students, constantly refining:
Market models
Pricing techniques
Strategy combinations
Risk management rules
Secret Insight #10: The single most reliable secret of derivative trading is humility. Accepting that the market can always surprise you ensures you remain flexible and avoid catastrophic losses.
11. Practical Takeaways for Aspiring Traders
Start Small: Begin with simulated or small-size trades to master instruments.
Focus on One Market: Specialize in one type of derivative—options, futures, or swaps—before diversifying.
Document Every Trade: Learn from successes and failures to refine strategies.
Avoid Over-Leverage: Leverage magnifies losses as much as gains; control it carefully.
Master Volatility: Understand how time decay and implied volatility impact pricing.
Hedge Thoughtfully: Protecting capital is more important than chasing profits.
Conclusion
Derivative trading is not just about predicting market direction. It is about mastering risk, timing, leverage, and psychology. Professionals profit by understanding mispricings, managing exposure, and exploiting volatility intelligently. The secrets of derivatives lie in subtlety—small edges, disciplined risk management, and continuous learning compound over time into substantial returns.
Success in derivative trading is less about luck and more about precision, patience, and protection. Those who master these principles can unlock the true potential of derivatives—an opportunity to control risk, amplify gains, and thrive in even the most volatile markets.
Option Trading StrategiesIntroduction
Option trading is one of the most dynamic and flexible segments of the financial markets. Unlike traditional stock trading, which involves buying or selling shares outright, options provide traders the right but not the obligation to buy or sell an asset at a predetermined price on or before a specified date. This flexibility makes options powerful tools for hedging, speculation, and income generation. However, they require a deep understanding of pricing, volatility, and market behavior. In this essay, we’ll explore the foundations of option trading, key strategies for different market conditions, risk management principles, and how professional traders use options to optimize returns.
Understanding Options: The Basics
Options are derivatives—financial instruments that derive their value from an underlying asset such as stocks, indices, commodities, or currencies. There are two primary types of options:
Call Options:
A call option gives the holder the right to buy the underlying asset at a specific price (called the strike price) before or on the expiration date.
Put Options:
A put option gives the holder the right to sell the underlying asset at the strike price before or on the expiration date.
When traders buy options, they pay a premium—the cost of acquiring the option. Sellers (also called writers) receive this premium and take on the obligation to fulfill the contract if exercised.
Key Concepts in Option Trading
Before diving into strategies, it’s essential to understand the factors influencing option prices and risk:
Intrinsic Value: The actual value if exercised immediately. For a call, it’s the difference between the current price and the strike price (if positive).
Time Value: Reflects the potential for the option to gain value before expiration. Longer expiries usually mean higher time value.
Volatility: Measures how much the underlying asset’s price fluctuates. Higher volatility typically increases option premiums.
The Greeks: Metrics that quantify risk and sensitivity.
Delta: Measures how much the option price moves per unit change in the underlying asset.
Gamma: Tracks the rate of change of delta.
Theta: Represents time decay—how much value an option loses daily as expiration nears.
Vega: Sensitivity to changes in volatility.
Rho: Measures sensitivity to interest rate changes.
Understanding these metrics helps traders manage positions strategically rather than speculatively.
Option Trading Strategies
Option trading strategies can be broadly categorized into bullish, bearish, neutral, and volatility-based approaches. Below is a breakdown of the most commonly used strategies for each scenario.
1. Bullish Strategies
When traders expect prices to rise, they can use bullish strategies to profit while managing risk.
a. Long Call
Objective: Profit from a significant upward move.
Structure: Buy one call option.
Risk: Limited to the premium paid.
Reward: Theoretically unlimited as the price rises.
This is a simple directional play where the trader benefits if the underlying asset moves well above the strike price before expiration.
b. Bull Call Spread
Objective: Moderate bullish view with reduced cost.
Structure: Buy a call at a lower strike and sell a call at a higher strike (same expiration).
Risk: Limited to the net premium paid.
Reward: Capped at the difference between strikes minus cost.
This strategy reduces the upfront premium compared to a long call while capping the maximum gain.
c. Cash-Secured Put
Objective: Acquire stock at a discount or earn income.
Structure: Sell a put while holding enough cash to buy the stock if assigned.
Risk: Potential loss if the stock falls sharply.
Reward: Premium received.
Traders use this to generate steady income while positioning to buy quality stocks at lower prices.
2. Bearish Strategies
When the outlook is negative, traders adopt bearish strategies to profit from falling prices.
a. Long Put
Objective: Profit from a significant downward move.
Structure: Buy one put option.
Risk: Limited to the premium paid.
Reward: Substantial, as the underlying approaches zero.
A long put acts like shorting a stock but with defined risk.
b. Bear Put Spread
Objective: Moderate bearish expectation with cost efficiency.
Structure: Buy a put at a higher strike and sell another at a lower strike.
Risk: Limited to the net cost.
Reward: Limited to the difference between strikes minus cost.
This strategy benefits from moderate price declines and reduces premium outlay.
c. Covered Call (Bearish to Neutral Adjustment)
Objective: Generate income when holding a stock expected to stay flat or slightly decline.
Structure: Own the stock and sell a call option.
Risk: Downside exposure from stock ownership.
Reward: Premium plus any stock appreciation up to strike.
3. Neutral Strategies
When traders expect little price movement, they can capitalize on time decay or stable prices.
a. Iron Condor
Objective: Profit from low volatility.
Structure: Combine a bull put spread and a bear call spread.
Risk: Limited to the difference between strikes minus total premium received.
Reward: Limited to the net premium received.
Iron condors work best when the underlying trades within a defined range, allowing both sides to expire worthless.
b. Butterfly Spread
Objective: Profit from a stable underlying price.
Structure: Buy one call (or put) at a lower strike, sell two at a middle strike, and buy one at a higher strike.
Risk: Limited to cost.
Reward: Maximum at the middle strike at expiration.
This is a precision strategy ideal for range-bound markets.
c. Calendar Spread
Objective: Benefit from time decay differences.
Structure: Sell a near-term option and buy a longer-term option at the same strike.
Risk: Limited to initial cost.
Reward: Profit from slower time decay of the long option.
Calendar spreads exploit differing decay rates between short-term and long-term options.
4. Volatility-Based Strategies
These strategies focus on changes in volatility rather than price direction.
a. Straddle
Objective: Profit from large movements either up or down.
Structure: Buy one call and one put at the same strike and expiration.
Risk: Combined premium paid.
Reward: Unlimited potential on one side.
Straddles are useful before major news events or earnings announcements.
b. Strangle
Objective: Similar to straddle but cheaper.
Structure: Buy a call and put with different strike prices.
Risk: Lower premium cost.
Reward: Unlimited upside or significant downside.
This strategy works when a trader expects major volatility but is unsure of direction.
c. Vega Trading (Volatility Arbitrage)
Objective: Trade volatility itself.
Structure: Long or short volatility via options, regardless of direction.
Risk/Reward: Based on volatility change rather than price.
Professional traders often hedge such positions using futures or underlying shares.
Advanced and Professional Option Strategies
Experienced traders and institutions often employ complex, multi-leg strategies:
Ratio Spreads: Involves buying one option and selling multiple of another to benefit from small directional moves with volatility decay.
Box Spread (Arbitrage): A risk-free structure exploiting mispriced options to lock in small profits.
Protective Collar: Own stock, buy a put, and sell a call to limit downside while capping upside.
Delta-Neutral Trading: Balancing positions so overall delta equals zero, allowing profits from volatility and time decay rather than direction.
These advanced methods require constant adjustment (known as dynamic hedging) and deep knowledge of the Greeks.
Risk Management in Option Trading
Options can magnify both profit and loss. Effective traders prioritize risk management over speculation:
Position Sizing: Never risk more than a small percentage of capital per trade.
Stop-Loss and Adjustment: Closing or adjusting losing trades early prevents large drawdowns.
Volatility Awareness: Avoid selling naked options in highly volatile environments.
Diversification: Spread exposure across sectors, strikes, and expiration dates.
Greeks Monitoring: Keeping delta, gamma, and theta balanced helps maintain controlled exposure.
Psychology of Option Trading
Emotional discipline is as important as technical skill. Traders must avoid:
Overleveraging based on short-term profits.
Chasing volatile trades without understanding volatility pricing.
Ignoring the impact of time decay (theta burn).
Successful option traders approach the market with a probabilistic mindset—thinking in terms of risk-reward ratios, probability of profit, and expected value rather than absolute certainty.
Option Trading in the Global and Indian Markets
Globally, option markets such as the CBOE (Chicago Board Options Exchange) and Eurex dominate institutional trading volumes. In India, the NSE (National Stock Exchange) has become one of the largest options markets, with the NIFTY and BANKNIFTY options leading in liquidity.
Indian retail participation has surged due to low capital requirements and technological ease. However, many traders misunderstand the risks of selling naked options or holding positions till expiry, where time decay accelerates.
Regulators like SEBI have emphasized investor education, margin discipline, and transparency to ensure sustainable participation.
Advantages of Option Trading
Flexibility: Profit in any market condition—up, down, or sideways.
Leverage: Control large positions with small capital.
Defined Risk: Losses are predetermined in most strategies.
Hedging Tool: Protect portfolios against adverse movements.
Income Generation: Through premium collection in neutral markets.
Disadvantages and Challenges
Complexity: Requires deep knowledge of pricing models and Greeks.
Time Decay: Erodes option value quickly near expiry.
Volatility Risk: Sudden volatility drops can cause losses.
Liquidity Issues: Some strikes have wide bid-ask spreads.
Psychological Pressure: High leverage can lead to emotional trading.
Conclusion
Option trading is a sophisticated and versatile component of modern financial markets. It empowers traders and investors to customize risk, hedge portfolios, and generate income across all market conditions. However, it demands education, discipline, and a structured approach. Successful traders master both the art and science of options—balancing technical analysis, volatility insights, and emotional control.
In essence, options are not just speculative instruments—they are strategic tools. Whether one uses them to hedge against uncertainty, generate consistent income, or speculate on directional moves, mastering option trading strategies opens doors to deeper understanding, higher efficiency, and sustainable profitability in the financial markets.

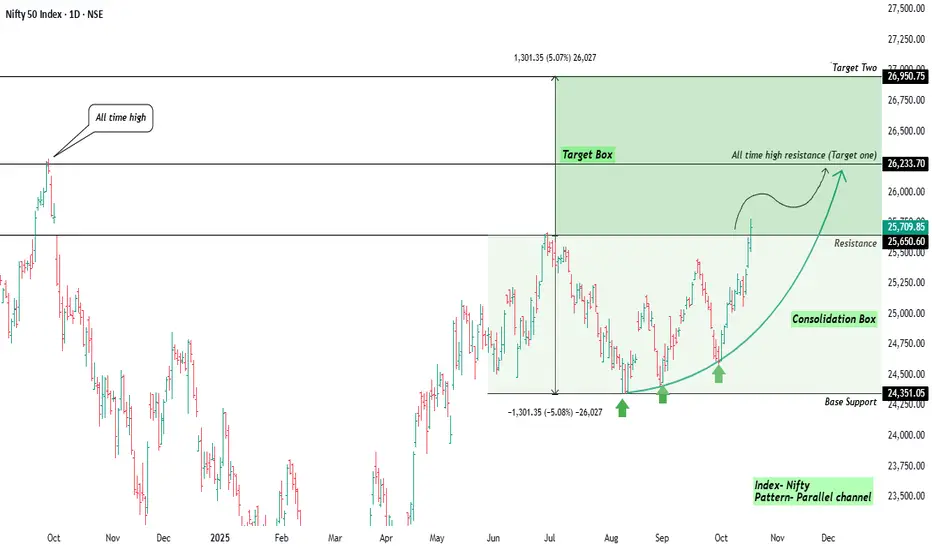
Nifty From Consolidation to Momentum🪔Wishing everyone in the TradingView community a prosperous and bright Diwali 🎇
May this festival bring you clarity like a clean chart, and profits that trend higher with discipline and peace of mind.
Description / Post Body (Technical Analysis View)-:
After a few months of sideways movement, Nifty has finally shaped up into a strong parallel channel pattern.
The index built a solid base near 24,350, where price found repeated buying interest forming the foundation of the current up-leg.
The latest breakout above the 25,650 resistance zone now opens a clean path toward the All Time High resistance (around 26,233) which is marked as Target One.
If momentum sustains, the measured move symmetry projects a possible extension toward 26,950 shown as Target Two / Target Box.
The price structure is supported by higher lows, showing renewed strength and confidence from buyers. The curved projection hints that the market might pause slightly near the previous top before any decisive breakout.
This view focuses on chart behaviour and structure, not short-term trading signals — it’s more about understanding how market psychology unfolds through patterns.
Key Observations-:
Pattern: Parallel Channel Breakout
Base Support: ~24,350
Immediate Resistance (Broken): ~25,650
All-Time High / Target 1: ~26,233
Target 2 Zone: 26,950 ±50
Bias: Positive while above 25,000
Regards Amit, Happy Diwali!
GOLD SHOWING A GOOD UP MOVE WITH 1:10 RISK REWARD GOLD SHOWING A GOOD UP MOVE WITH 1:10 RISK REWARD
DUE TO THESE REASON
A. its following a rectangle pattern that stocked the market
which preventing the market to move any one direction now it trying to break the strong resistant lable
B. after the break of this rectangle it will boost the market potential for break
C. also its resisting from a strong neckline the neckline also got weeker ald the price is ready to break in the outer region
all of these reason are indicating the same thing its ready for breakout BREAKOUT trading are follws good risk reward
please dont use more than one percentage of your capitalfollow risk reward and tradeing rules
that will help you to to become a bettertrader
thank you

Senores pharma breakout possibleUS fda approved facility which prevents them from any risk of tariff, very good guidance and growth projections. breakout possible very soon

Part 2 Ride The Big Moves American vs. European Options
Options can be American-style or European-style. American options can be exercised any time before expiry, while European options can be exercised only on the expiry date. In India, stock options are American, while index options are European.
In-the-Money, At-the-Money, and Out-of-the-Money
These terms describe an option’s relationship to the current market price:
In-the-Money (ITM): Option has intrinsic value.
At-the-Money (ATM): Strike price equals the current price.
Out-of-the-Money (OTM): Option has no intrinsic value yet.

MOTILALOFS 1 Month Time Frame 📊 Monthly Pivot Levels
Based on monthly pivot calculations, the key levels are:
Resistance (R1): ₹1,013.47
Pivot Point (PP): ₹953.53
Support (S1): ₹906.57
These levels are derived from the price range of the previous trading month and can serve as potential indicators for future price movements.
📈 Recent Price Performance (1-Month)
Highest Price: ₹1,030.00
Lowest Price: ₹877.70
Average Price: ₹958.50
Price Change: +₹152.30 (8.63% increase)
Over the past month, the stock has shown a positive trend, reaching its highest point at ₹1,030.00.
BTC 1 Week Time Frame 📊 1-Week Timeframe: Key Support & Resistance Levels
🔼 Resistance Levels
1st Resistance: $114,106
2nd Resistance: $117,201
3rd Resistance: $120,485
🔽 Support Levels
1st Support: $107,728
2nd Support: $104,445
3rd Support: $101,349
These levels are derived from Barchart's technical analysis.
M&M 1 Month Time Frame 📊 Monthly Technical Overview
Current Price: ₹3,621.20
52-Week Range: ₹2,425.00 – ₹3,723.80
Recent High: ₹3,723.00 (September 9, 2025)
📈 Market Sentiment
The recent GST tax cut on SUVs with engines over 1500 cc has positively impacted Mahindra's sales, particularly for models like the Scorpio and XUV700. September 2025 saw a 10% year-on-year increase in SUV sales to dealers, and the first nine days of the Navratri festival recorded a more than 60% year-on-year sales increase.
LAURUSLABS 1 Day Time Frame 📈 Intraday Price Overview
Current Price: ₹923.90
Day’s Range: ₹921.15 – ₹929.80
Opening Price: ₹925.85
Previous Close: ₹920.65
Volume: 522,764 shares
VWAP: ₹925.80
Market Cap: ₹49,874 crore
52-Week Range: ₹440.45 – ₹944.00
Beta: 1.29 (indicating higher volatility compared to the market)
P/E Ratio (TTM): 97.97
Book Value: ₹82.85 per share
Dividend Yield: 0.13%
Earnings Report: Expected on October 23, 2025
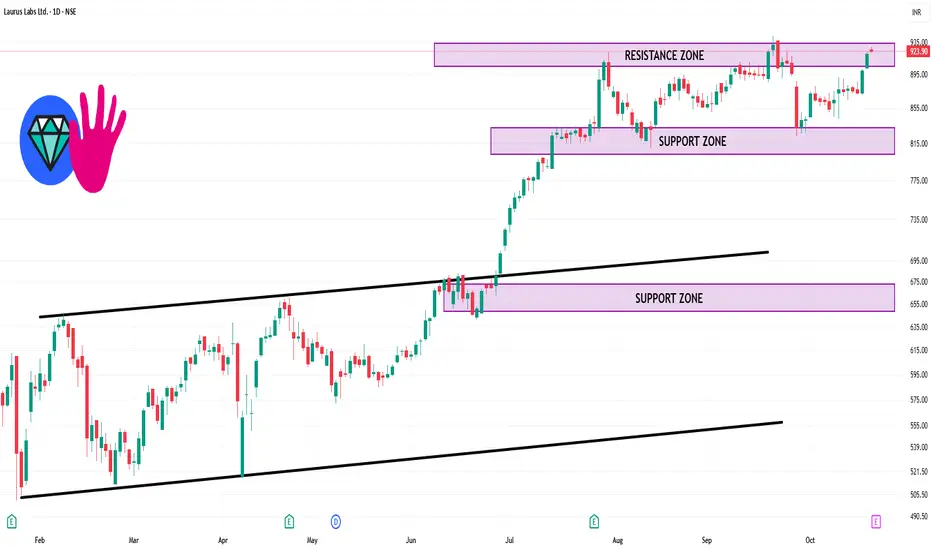
NIFTY1! 1 Hour Time Frame 🔄 Key Levels to Watch
Support Levels: Approximately ₹25,600. A bounce from this area could indicate a potential upward movement.
Resistance Levels: Around ₹25,900. A breakout above this level may signal a continuation of the upward trend.
📌 Pivot Points for Reference
Based on daily and weekly pivot calculations, key levels include:
Daily Pivot: ₹25,709.67
Weekly Pivot: ₹25,974.00
These levels can serve as potential support or resistance zones.
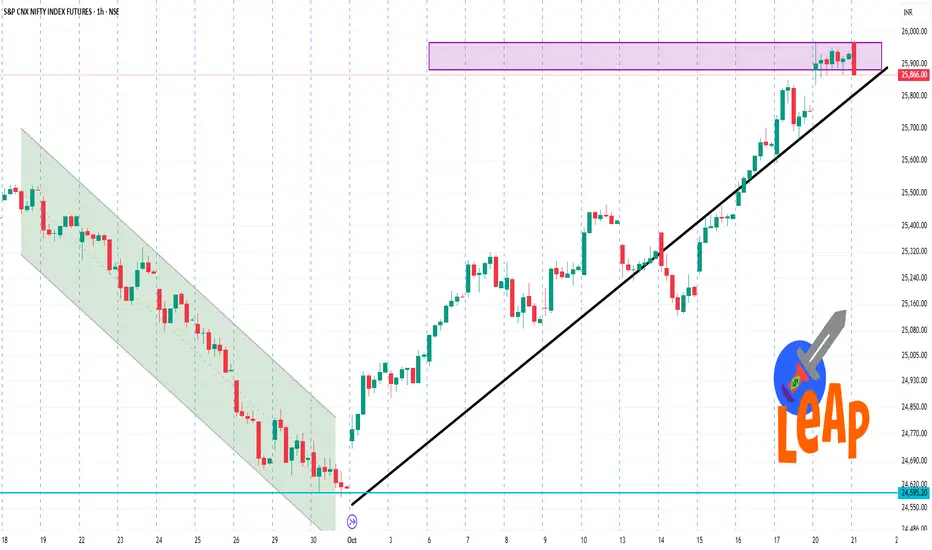
INDHOTEL 1 Month Time Frame 📊 1-Month Stock Performance
Current Price: ₹744.25
1-Month Change: Approximately -3.43% decline
52-Week Range: ₹649.00 – ₹894.90
🔍 Key Insights
Recent High: ₹748.00 on October 21, 2025
Recent Low: ₹741.00 on October 21, 2025
Analyst Sentiment: Analysts have recommended shares of companies with strong fundamentals and long-term growth potential, advising investors to hold these stocks till next Diwali for bumper returns
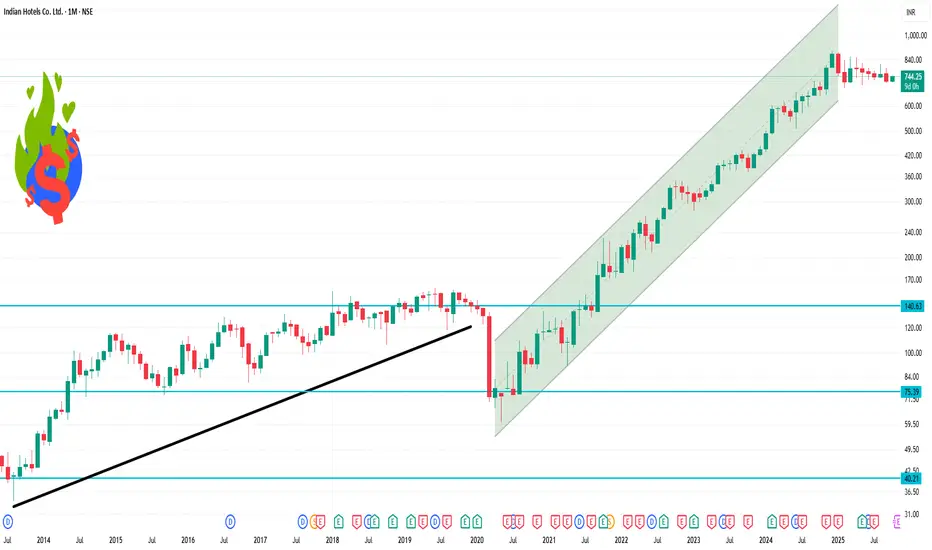
SUPRIYA 1 Week Time Frame 📈 1-Week Performance (October 14–21, 2025)
Opening Price (Oct 14, 2025): ₹710.60
Closing Price (Oct 21, 2025): ₹754.15
Weekly Gain: +6.14%
📊 Key Technical Levels
1-Week High: ₹764.65 (Oct 20, 2025)
1-Week Low: ₹749.85 (Oct 21, 2025)
Current Price (Oct 22, 2025): ₹754.15
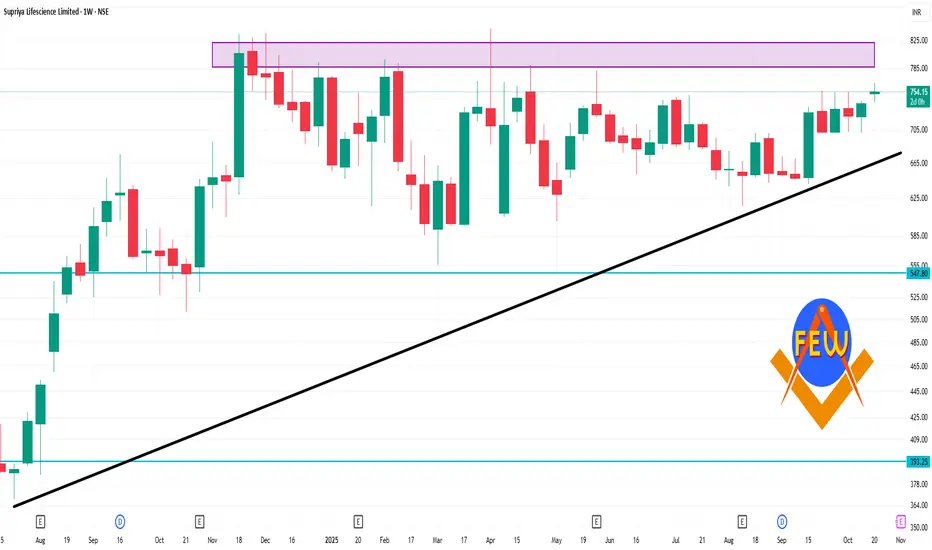
HFCL 1 Month Time Frame 📊 Monthly Technical Indicators
RSI (14-day): 57.91 — Neutral
Stochastic RSI: 72.52 — Neutral
MACD: 0.64 — Slightly bullish
ADX (14): 18.80 — Weak trend strength
Commodity Channel Index (CCI): 26.28 — Neutral
Rate of Change (ROC): 4.63% — Positive momentum
Williams %R: -51.95 — Neutral
Ultimate Oscillator: 48.33 — Neutral
Average True Range (ATR): ₹2.67 — Moderate volatility
📈 Moving Averages
Short-Term (5, 10, 20-day): Bullish
Medium-Term (50-day): Bullish
Long-Term (100, 200-day): Bearish
🧭 Key Support & Resistance Levels
Support Levels: ₹76.43 (S1), ₹75.73 (S2), ₹74.86 (S3)
Resistance Levels: ₹78.12 (R1), ₹79.06 (R2), ₹80.00 (R3)
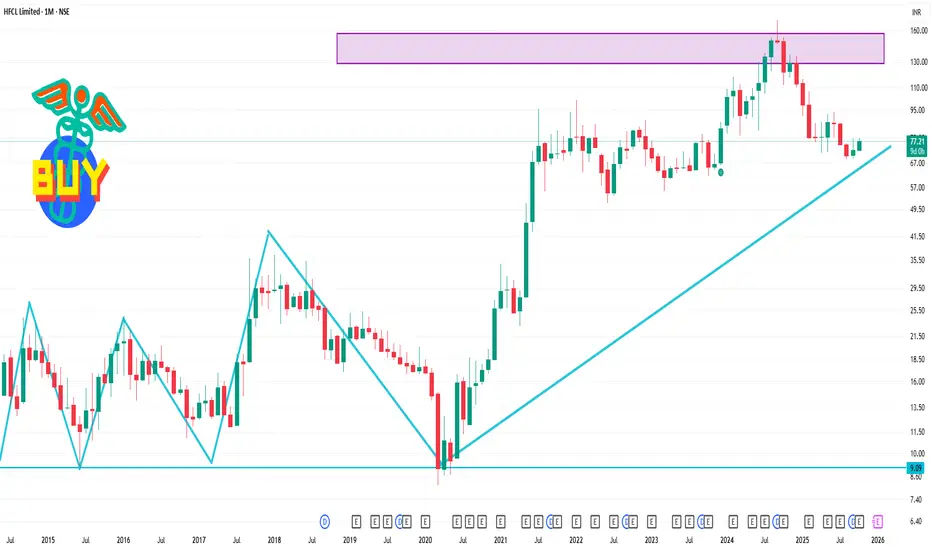
Part 1 Ride The Big Moves American vs. European Options
Options can be American-style or European-style. American options can be exercised any time before expiry, while European options can be exercised only on the expiry date. In India, stock options are American, while index options are European.
In-the-Money, At-the-Money, and Out-of-the-Money
These terms describe an option’s relationship to the current market price:
In-the-Money (ITM): Option has intrinsic value.
At-the-Money (ATM): Strike price equals the current price.
Out-of-the-Money (OTM): Option has no intrinsic value yet.

PCR Trading Strategies Option Greeks – Risk Indicators
“Greeks” like Delta, Gamma, Theta, Vega, and Rho measure how sensitive an option’s price is to factors such as the underlying asset’s price, volatility, time decay, and interest rates. They help traders assess risk precisely.
Strategies and Combinations
Traders combine calls and puts to create option strategies such as straddles, strangles, spreads, and iron condors. These allow profit from different market conditions—rising, falling, or even sideways trends.
