Premium Chart PatternTips for Successful Trading
Always trade with a clear risk management plan.
Use stop-loss and position sizing.
Understand implied volatility before trading.
Avoid holding options till expiry unless necessary.
Start with simple strategies and move to advanced ones gradually.
Trend Lines

Part 2 Identifying Support and ResistanceRisks in Option Trading
While options offer flexibility, they also come with inherent risks:
Time Decay: Option value erodes as expiry nears, especially for buyers.
High Volatility: Sudden volatility spikes can cause unpredictable price swings.
Leverage Risk: Small movements in the underlying can lead to large gains or losses.
Unlimited Loss Potential for Sellers: Option writers face potentially large losses, especially with uncovered (naked) positions.
Liquidity Risk: Some stock options may have wide bid-ask spreads, making entry and exit difficult.
Proper risk management, position sizing, and stop-loss mechanisms are essential for long-term success.

Part 1 Identifying Support and ResistanceWhy Trade Options?
Options serve multiple purposes in modern finance:
Hedging:
Investors use options to protect their portfolios from adverse price movements. For example, a stockholder may buy a put option to guard against a potential price fall.
Speculation:
Traders can speculate on short-term market movements with limited risk and potentially high returns. Buying calls or puts allows traders to profit from expected price directions without owning the underlying asset.
Income Generation:
Selling options (writing covered calls or cash-secured puts) generates regular income through premiums. Many institutional investors use this strategy to enhance portfolio returns.

PCR-basedTradingOption Pricing
Option prices are influenced by several factors, known collectively as the “Greeks.” These variables determine how an option’s value changes with respect to different market conditions.
Delta (Δ): Measures how much an option’s price changes for a ₹1 change in the underlying asset.
Gamma (Γ): Measures the rate of change of Delta.
Theta (Θ): Represents time decay — how much an option loses value as it nears expiry.
Vega (ν): Sensitivity to changes in volatility.
Rho (ρ): Sensitivity to changes in interest rates.
The Black-Scholes model is commonly used to estimate theoretical option prices by combining these factors.

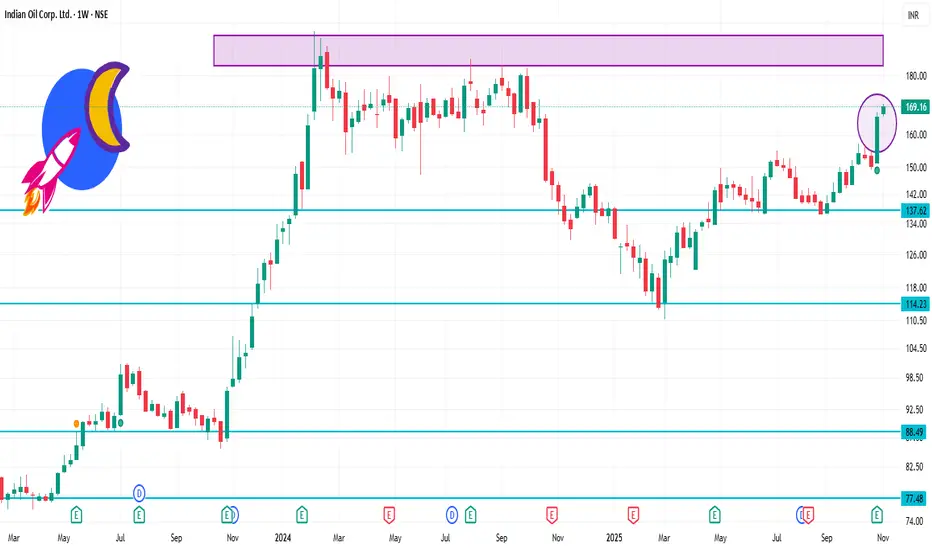
IOC 1 Week Time Frame 📌 Current Price Snapshot
The stock is trading around ₹ 167.97 on the NSE.
One technical commentary shows support in the ₹ 164-166 range, resistance in the ₹ 170-172 range.
✅ My Base-Case for This Week
Given the current price around ₹ 168 and the above levels:
a) The stock may oscillate between ₹ 164 (support) and ₹ 172 (resistance) this week.
b) If it holds above ₹ 166 and crosses above ~₹ 170 with strength, then the ~₹ 172 level is the immediate target.
c) If it fails to hold ~₹ 164, then a pull-back toward ~₹ 160-162 is possible.
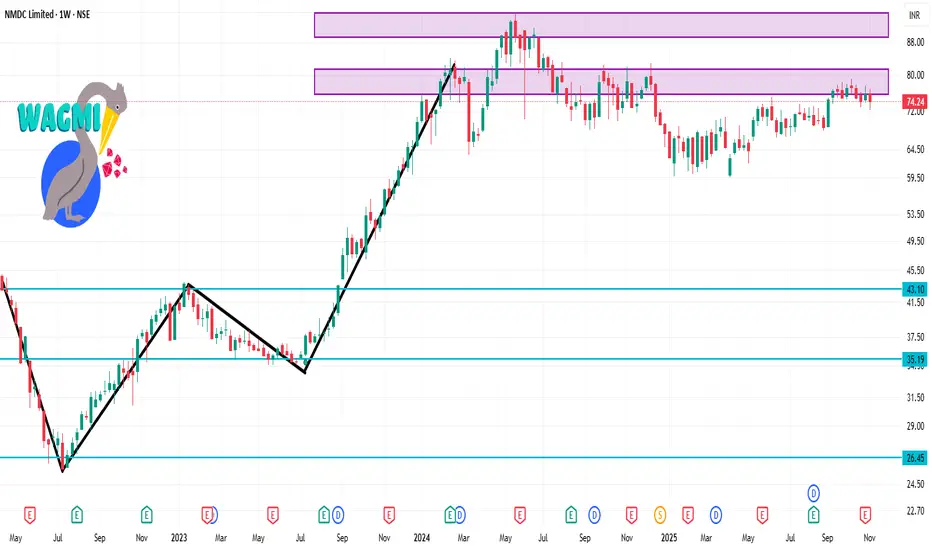
NMDC 1 Week Time Frame 📝 Key levels to watch
Support: ~₹74 region (short term) → if broken → ~₹69.
Resistance: ~₹78-₹79.
Price of interest: Current trading around ~₹74-₹76 (depending on the source)
✅ What the technicals are saying
a) According to one source, NMDC has a “Strong Buy” rating on daily indicators: RSI ~55, MACD positive, 5-day MA above price, 50-day MA above price — all suggesting bullish bias.
b) Another set of technicals (via Moving Averages & Oscillators) shows a Bearish bias: MACD negative, RSI ~38, SMA(20/50/200) all above current price indicating downward pressure.
c) Support / resistance levels from Charts: Short-term support around ₹74.19, intermediate support near ₹69.44, major support around ₹61.87. Resistance around ₹78.80 to ~₹79.58.
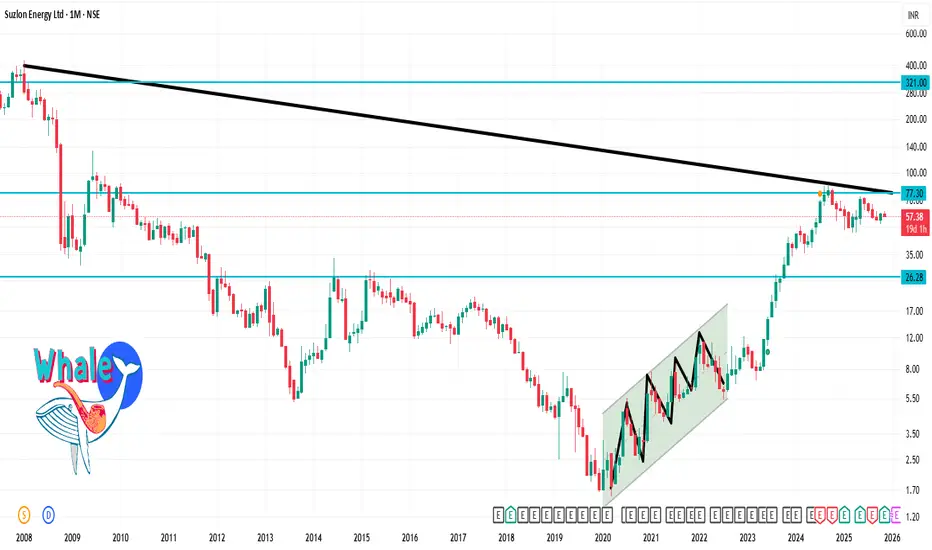
SUZLON 1 Month Time Frame ✅ Current Price & Context
The stock is trading around ₹ 57.38 on the NSE.
Technical indicators give a mixed but mildly positive bias: Many moving averages show “Buy” signals aside from some longer-term averages.
On a charting site, for short term the support is about ₹ 52.67 and resistance about ₹ 60.40.
🔍 One-Month Timeframe Levels
Here are suggested levels to watch for the next ~4-5 weeks:
Support level: around ₹ 52-53
Resistance level: around ₹ 60-61 (or slightly above)
Intermediate pivot / near‐term area: around ₹ 56-58
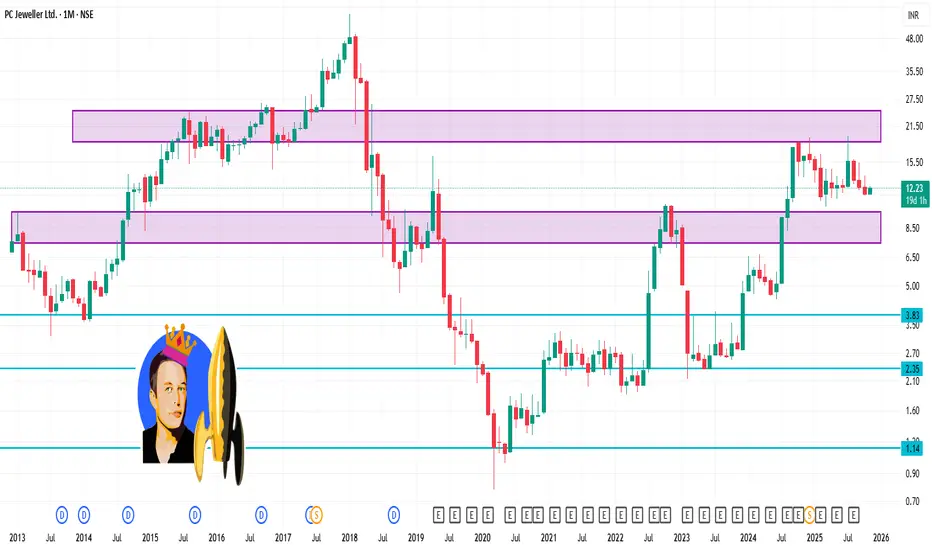
PCJEWELLER 1 Month Time Frame 📊 Current snapshot
Last quoted price: ~ ₹12.23 on 7 Nov 2025.
52-week high / low: ~ ₹19.65 / ₹10.28.
Key moving averages (approx):
20-day MA ~ ₹12.13
50-day MA ~ ₹12.68
100-day MA ~ ₹13.12
200-day MA ~ ₹13.06
Part 2 Understanding the Structure of a CandlestickKey Terminologies
To understand options deeply, it’s essential to know the following terms:
Strike Price: The fixed price at which the option holder can buy (call) or sell (put) the underlying.
Premium: The price paid by the option buyer to the seller.
Expiry Date: The date on which the option contract expires.
In-the-Money (ITM): A call option is ITM if the underlying price is above the strike price; a put option is ITM if the price is below the strike.
Out-of-the-Money (OTM): The opposite of ITM; when exercising the option would not be profitable.
At-the-Money (ATM): When the underlying price is equal (or close) to the strike price.
Intrinsic Value: The amount by which an option is in the money.
Time Value: The portion of the option’s premium that reflects the time left until expiry and market volatility.

Part 1 Understanding the Structure of a CandlestickHow Option Trading Works
Option trading involves two parties:
Buyer (Holder): Pays a premium to acquire the right to exercise the option.
Seller (Writer): Receives the premium and is obligated to fulfill the contract if the buyer exercises the option.
Unlike stock trading, where the ownership of shares is exchanged, options trading revolves around rights and obligations. The buyer’s risk is limited to the premium paid, while the seller’s risk can be unlimited (especially in naked option writing).

Basic Concepts of Options TradingWhat Are Options?
An option is a financial derivative contract that gives the buyer the right, but not the obligation, to buy or sell an underlying asset—such as a stock, index, or commodity—at a predetermined price (called the strike price) on or before a specified date (the expiry date).
Options are of two main types:
Call Option: Gives the holder the right to buy the underlying asset at the strike price.
Put Option: Gives the holder the right to sell the underlying asset at the strike price.
Each option contract typically represents 100 shares of the underlying stock in many markets (such as the U.S.), but in the Indian derivatives market (NSE/BSE), the lot size varies for different stocks and indices.

Focus on Market Key Earnings1. What Are Earnings and Why They Matter
Earnings, also known as net income or profit, reflect the money a company makes after subtracting all expenses from its total revenue. It is the bottom line of a company’s income statement and one of the most closely watched indicators of financial success. Investors monitor earnings to evaluate a company’s financial health and growth potential. When earnings rise consistently, it suggests a strong business model, effective cost management, and growing demand for the company’s products or services. Conversely, declining earnings can signal potential trouble, inefficiency, or changing market conditions.
Earnings are reported in various forms, including:
Earnings per share (EPS): Net income divided by the number of outstanding shares. EPS is a key metric for comparing profitability across companies.
Revenue: The total income generated before expenses. Strong revenue growth indicates robust sales momentum.
Operating income: Profit generated from core business activities, excluding taxes and interest.
Net margin: The percentage of revenue left as profit after all costs.
Together, these metrics provide a comprehensive view of how efficiently a company operates and how much profit it generates from its resources.
2. The Role of Earnings Season
Earnings season occurs four times a year, following the end of each fiscal quarter. During this period, companies listed on major stock exchanges—such as the NSE, BSE, NYSE, or NASDAQ—announce their results. Investors closely analyze these reports because they often trigger significant price movements in stocks and indexes.
For example:
If a company beats expectations, meaning it reports earnings higher than analysts’ forecasts, its stock price often rises.
If it misses expectations, the stock might drop sharply as investors lose confidence.
Because earnings season reflects the performance of various sectors, it also influences broader market sentiment. Strong results from major companies like Reliance Industries, Infosys, or HDFC Bank in India—or Apple, Microsoft, and Amazon globally—can lift entire indices such as the Nifty 50 or S&P 500. Conversely, widespread earnings misses can signal a slowdown in corporate profitability and drag markets lower.
3. Key Components of an Earnings Report
Each company’s earnings report typically includes:
Income Statement: Shows revenues, expenses, and profits.
Balance Sheet: Lists assets, liabilities, and shareholders’ equity.
Cash Flow Statement: Details cash inflows and outflows from operations, investments, and financing.
Management Discussion and Analysis (MD&A): Offers management’s perspective on financial results, market conditions, and future outlook.
Investors should focus not just on the numbers but also on guidance—the company’s forecast for future earnings and revenue. Often, a stock’s reaction depends more on the outlook than the past quarter’s performance.
4. Analyst Expectations and Market Reactions
Before companies release earnings, analysts issue forecasts based on their research. These forecasts include:
Consensus EPS estimates
Revenue projections
Profit margins
Future growth guidance
When the actual results are released, investors compare them to these estimates. The difference between actual and expected numbers—called an earnings surprise—can lead to sharp market reactions.
For example:
Positive Surprise: Company reports higher EPS or revenue than expected → stock may rally.
Negative Surprise: Company reports lower-than-expected results → stock may decline.
In-line Results: When results match expectations, the stock may remain stable or react mildly depending on market mood.
However, sometimes even a positive surprise doesn’t lead to gains if investors believe the stock was overvalued or if the company’s guidance disappoints.
5. Sector-Wise Earnings Focus
Different sectors react differently to earnings:
Technology: Focuses on user growth, product innovation, and profit margins. Companies like Infosys or TCS are judged by deal wins and revenue growth in digital services.
Banking and Finance: Analysts track net interest margin (NIM), non-performing assets (NPAs), and credit growth. For instance, HDFC Bank’s quarterly results are seen as a benchmark for the Indian banking sector.
FMCG (Fast-Moving Consumer Goods): Earnings are influenced by consumer demand, input cost inflation, and pricing power.
Energy and Metals: Global commodity prices play a major role in determining profitability for companies like ONGC or Tata Steel.
Automobile: Investors look at sales volume, production costs, and export growth.
Monitoring sector earnings helps investors identify which industries are thriving or struggling, providing clues for portfolio rotation or sectoral allocation.
6. Earnings and Broader Economic Indicators
Corporate earnings don’t exist in isolation. They often mirror broader economic conditions such as:
Interest rates: Rising rates can increase borrowing costs, reducing corporate profits.
Inflation: High inflation affects consumer spending and input costs.
Currency fluctuations: Export-driven firms benefit from a weaker domestic currency.
Economic growth: GDP expansion often translates into stronger corporate revenues.
Thus, during earnings season, analysts not only evaluate individual company reports but also gauge the overall economic direction. For example, widespread earnings growth across industries may suggest a healthy economy, while declining profits can signal an economic slowdown.
7. How Investors Use Earnings Data
Investors and traders use earnings data for different purposes:
Long-term investors assess whether a company’s earnings growth is sustainable and aligns with their investment horizon.
Short-term traders use earnings announcements as catalysts for price movements, often engaging in earnings trades.
Institutional investors evaluate earnings quality and consistency before making large-scale portfolio decisions.
Key metrics such as Price-to-Earnings (P/E) ratio, Earnings Yield, and PEG ratio (Price/Earnings to Growth) help investors assess whether a stock is overvalued or undervalued relative to its earnings potential.
8. Earnings Surprises and Market Volatility
Earnings announcements often lead to heightened volatility. Even small surprises can lead to double-digit price swings within minutes. Traders prepare by adjusting positions or using derivatives like options to hedge risk. For example:
Options traders use strategies such as straddles or strangles to profit from volatility.
Portfolio managers may rebalance holdings to reduce exposure to uncertain earnings outcomes.
Because of this volatility, the earnings season is sometimes referred to as the “trader’s season,” as it offers numerous short-term opportunities.
9. Global Earnings and Market Correlation
In a globally connected market, major companies’ earnings reports can influence not just domestic indices but also global sentiment. For example:
Strong results from U.S. tech giants like Apple or Microsoft can boost global technology stocks, including Indian IT firms.
Weak earnings in Chinese manufacturing can signal slowing demand, affecting commodity and energy stocks worldwide.
Therefore, investors track not only local earnings but also international reports to anticipate sector-wide or cross-market movements.
10. Conclusion: The Broader Picture
Focusing on key earnings provides invaluable insight into the health of both companies and the overall economy. Earnings season is more than just a reporting period—it’s a reflection of corporate resilience, consumer demand, and market confidence. Successful investors don’t merely react to earnings but interpret them within the larger context of economic trends, sectoral shifts, and market expectations.
By analyzing revenue growth, profit margins, and forward guidance, one can identify both opportunities and risks early. In essence, earnings reports are the heartbeat of the stock market—each one revealing the rhythm of corporate success and the pulse of the economy. For those who understand and anticipate these movements, earnings season can be one of the most rewarding times in the financial year.

Technical Analysis vs. Fundamental Analysis1. Fundamental Analysis: Understanding the Core Value
Fundamental analysis involves examining the underlying economic and financial factors that determine a company’s real worth. The idea is simple: every stock has an intrinsic value, which may differ from its market price. If the market price is below intrinsic value, the stock is undervalued (a potential buy). If it’s above, the stock is overvalued (a potential sell).
1.1 Components of Fundamental Analysis
Fundamental analysis can be divided into two main parts — qualitative and quantitative analysis.
Qualitative Factors include aspects such as the company’s management, competitive advantages, business model, industry position, brand value, and corporate governance. These factors determine how well the company can maintain profitability over time.
Quantitative Factors involve analyzing financial data — income statements, balance sheets, and cash flow statements — to assess profitability, liquidity, and solvency.
1.2 Key Ratios and Metrics
Analysts use several ratios to evaluate a company’s performance:
Earnings Per Share (EPS) – Measures profit allocated to each outstanding share.
Price-to-Earnings (P/E) Ratio – Compares market price to earnings; helps identify overvaluation or undervaluation.
Return on Equity (ROE) – Indicates profitability relative to shareholders’ equity.
Debt-to-Equity Ratio (D/E) – Shows the company’s financial leverage.
Price-to-Book (P/B) Ratio – Compares market value to book value.
These ratios provide insight into how efficiently a company uses its resources and how it compares to its competitors.
1.3 Top-Down and Bottom-Up Approaches
Top-Down Approach: Begins by analyzing macroeconomic factors — GDP growth, interest rates, inflation, fiscal policies — and then narrows down to industries and companies likely to benefit.
Bottom-Up Approach: Starts at the company level, focusing on specific fundamentals, regardless of broader economic conditions.
1.4 Objective of Fundamental Analysis
The main objective is long-term investment. Investors like Warren Buffett use fundamental analysis to find value stocks — those that trade for less than their intrinsic worth. This approach is ideal for investors looking to build wealth steadily over time.
2. Technical Analysis: Reading the Market’s Psychology
Technical analysis, on the other hand, is based on the premise that market prices already reflect all available information, and that price movements tend to follow identifiable patterns over time. Instead of analyzing a company’s financials, technical analysts (or “chartists”) study charts, trends, and indicators to predict future price action.
2.1 Core Principles of Technical Analysis
Market Action Discounts Everything: All factors — economic, political, or psychological — are already reflected in the price.
Prices Move in Trends: Markets tend to move in recognizable trends — upward (bullish), downward (bearish), or sideways (range-bound).
History Repeats Itself: Price patterns recur because human emotions — fear and greed — remain constant over time.
2.2 Tools and Techniques
Technical analysis employs a variety of tools to interpret market data:
Price Charts: The foundation of technical analysis, including line charts, bar charts, and candlestick charts.
Trends and Trendlines: Help identify the general direction of the market.
Support and Resistance Levels: Indicate price levels where buying or selling pressure historically prevents further movement.
Volume Analysis: Confirms the strength of a trend; higher volume often supports the validity of a move.
Indicators and Oscillators: Mathematical calculations applied to price and volume, such as:
Moving Averages (SMA, EMA)
Relative Strength Index (RSI)
Moving Average Convergence Divergence (MACD)
Bollinger Bands
Fibonacci Retracement Levels
2.3 Technical Patterns
Chartists look for patterns that signal potential market reversals or continuations:
Reversal Patterns: Head and shoulders, double tops/bottoms.
Continuation Patterns: Flags, pennants, triangles.
Candlestick Patterns: Doji, hammer, engulfing, and shooting star patterns that reveal market sentiment.
2.4 Objective of Technical Analysis
The goal is to time the market — to identify the best entry and exit points. Technical analysis is particularly useful for short-term traders, such as day traders and swing traders, who rely on momentum and price action rather than intrinsic value.
3. Comparison Between Fundamental and Technical Analysis
Aspect Fundamental Analysis Technical Analysis
Focus Company’s intrinsic value, earnings, growth, and economic factors Price movements, patterns, and market trends
Data Used Financial statements, economic data, industry trends Price, volume, and historical charts
Time Horizon Long-term (months to years) Short-term (minutes to weeks)
Approach Analytical and valuation-based Statistical and pattern-based
Objective Identify undervalued/overvalued assets Identify buy/sell opportunities
Investor Type Value investors, long-term holders Traders, speculators
Market Assumption Market may misprice assets in the short term Market reflects all information instantly
Tools Used P/E, EPS, ROE, D/E, financial models RSI, MACD, moving averages, candlestick patterns
Decision Basis Intrinsic value gap Price trend and momentum
Example Buying a stock after analyzing strong earnings growth Buying a stock after a breakout from resistance
4. Integration of Both Approaches
Many successful investors combine fundamental and technical analysis for better decision-making. For example:
Fundamentals identify what to buy (quality stock or undervalued asset).
Technical analysis identifies when to buy or sell (best timing and trend confirmation).
This blended approach helps reduce risk. A trader may use fundamentals to find fundamentally strong companies and then apply technical tools to decide when to enter or exit positions.
For instance, an investor might identify a fundamentally strong company like Infosys Ltd. based on solid earnings and low debt, but wait for a bullish chart pattern (like a breakout above resistance) before investing.
5. Advantages and Limitations
Fundamental Analysis Advantages
Provides deep insights into a company’s true worth.
Suitable for long-term investing and wealth creation.
Helps avoid market speculation and emotional trading.
Limitations
Time-consuming and data-heavy.
Ineffective for short-term trades where price action dominates.
Market prices can remain irrational longer than expected.
Technical Analysis Advantages
Ideal for short-term trading.
Provides clear entry and exit signals.
Works across any market — stocks, forex, or commodities.
Limitations
Based on probabilities, not certainties.
May produce false signals in volatile or low-volume markets.
Ignores underlying business fundamentals.
6. Which One is Better?
There is no universal answer — the choice depends on an investor’s objective, timeframe, and personality.
A long-term investor who focuses on value creation and dividend growth should prefer fundamental analysis.
A short-term trader who thrives on volatility and quick gains should rely more on technical analysis.
Many professionals use a hybrid strategy, integrating both methods to capitalize on strengths and offset weaknesses.
7. Conclusion
Both technical and fundamental analysis are powerful tools that serve different purposes in the financial markets. Fundamental analysis emphasizes value, seeking to identify opportunities based on real-world data, company performance, and economic strength. Technical analysis emphasizes timing, focusing on trends, price patterns, and market psychology to make faster decisions.
Ultimately, success in investing or trading depends not merely on choosing one method over the other but on understanding how and when to apply each. A well-informed investor blends both — using fundamentals to find good companies and technicals to identify the right moment to act — thus achieving a balance between knowledge and timing, value and opportunity, analysis and action.

Managing Losses and Drawdowns1. Understanding Losses and Drawdowns
Before discussing management strategies, it’s essential to understand what losses and drawdowns mean in trading and investing.
Losses refer to the decline in the value of a trade or investment. A loss occurs when the market moves against your position and the value of your holdings decreases below the entry point.
Drawdown represents the peak-to-trough decline in a trader’s capital over a given period. It is expressed as a percentage of the account balance and measures how much equity has fallen from its highest point before a recovery.
2. Importance of Managing Losses and Drawdowns
Effective loss and drawdown management ensures:
Capital Preservation: Without capital, trading cannot continue. The primary goal of every trader should be survival.
Psychological Stability: Large losses can cause emotional distress, leading to revenge trading and poor decisions.
Consistency: Controlling losses allows consistent performance and long-term profitability.
Compounding Potential: Small losses are easier to recover from, allowing traders to benefit from the power of compounding.
For example, a 10% loss requires an 11% gain to recover, but a 50% loss requires a 100% gain. Therefore, controlling drawdowns is essential to prevent deep equity declines that are hard to reverse.
3. Setting Stop-Losses and Risk Limits
A stop-loss is a pre-determined price level where a trader exits a losing position to prevent further loss. It is one of the most effective tools for managing risk.
Fixed Stop-Loss: A specific rupee or percentage-based limit (e.g., 2% of capital per trade).
Volatility-Based Stop-Loss: Set according to market volatility, using indicators like ATR (Average True Range).
Trailing Stop-Loss: Adjusts automatically as the trade moves in favor of the trader, locking in profits while limiting downside.
Most professional traders follow the 1–2% rule, meaning they never risk more than 1–2% of total trading capital on a single trade. This prevents any single loss from significantly impacting their portfolio.
4. Position Sizing and Diversification
Position sizing determines how much capital to allocate to each trade. Incorrect position sizing is one of the primary reasons for major drawdowns.
Small Positions Reduce Risk: Smaller position sizes help absorb losses without damaging overall equity.
Diversification: Spreading capital across uncorrelated assets or strategies reduces portfolio volatility. For example, investing in stocks, bonds, and commodities ensures that a loss in one market might be offset by gains in another.
Portfolio managers often use the Kelly Criterion or Value at Risk (VaR) models to optimize position sizes without exceeding risk tolerance.
5. Risk-Reward Ratio and Trade Selection
Before entering a trade, a trader must assess the risk-to-reward ratio (RRR)—the potential profit compared to the potential loss.
A common guideline is to maintain a minimum 1:2 ratio, meaning the expected profit should be at least twice the potential loss.
Selecting trades with favorable risk-reward setups ensures that even with a lower win rate, a trader can remain profitable over time.
For example, if a trader wins 4 out of 10 trades but each winning trade earns ₹2,000 and each losing trade loses ₹1,000, the net result is still positive.
6. Emotional and Psychological Control
Managing losses is not purely a mathematical exercise; it’s also psychological. Emotional discipline plays a crucial role in how traders handle drawdowns.
Avoid Revenge Trading: Trying to recover losses quickly often leads to larger losses.
Accepting Losses as Normal: Every trading strategy has losing trades. Accepting this helps maintain rational thinking.
Sticking to a Trading Plan: Following predefined entry, exit, and risk rules prevents impulsive behavior.
Regular Breaks: During losing streaks, stepping away from markets helps regain focus and prevent emotional trading.
Professional traders often use journals to record trades, emotions, and outcomes to improve self-awareness and consistency.
7. Using Hedging and Defensive Strategies
Hedging is a technique used to reduce risk exposure by taking offsetting positions.
Options Hedging: Traders can use put options to protect long stock positions or call options to hedge short positions.
Pair Trading: Taking opposite positions in correlated assets (e.g., long Reliance Industries and short ONGC) can reduce overall risk.
Stop-Loss Hedging: Some traders use inverse ETFs or futures contracts to hedge market downturns.
These techniques help reduce drawdowns during periods of market volatility or uncertainty.
8. Monitoring Performance and Adjusting Strategy
Continuous performance monitoring helps detect when a strategy is underperforming.
Max Drawdown Analysis: Comparing current drawdowns to historical averages reveals whether current losses are within expected limits.
Equity Curve Tracking: Observing the slope and volatility of the equity curve helps identify when to scale up or down.
Periodic Review: Adjusting strategy parameters based on changing market conditions ensures ongoing effectiveness.
When drawdowns exceed acceptable levels, it may be time to pause trading, reassess strategy, or backtest modifications.
9. Capital Allocation and Recovery Planning
Recovery from losses requires strategic capital allocation.
Traders should:
Preserve Core Capital: Keep a portion of funds untouched for future trading after a drawdown.
Reduce Position Sizes: During recovery, use smaller trade sizes to rebuild confidence and equity.
Reinvest Gradually: As performance improves, gradually scale back to normal risk levels.
Avoid Over-Leverage: Excessive leverage accelerates losses; maintaining moderate leverage ensures sustainability.
Remember, the goal during recovery is consistency, not speed. Small, steady gains rebuild equity more safely than aggressive trading.
10. Practical Example of Drawdown Management
Suppose a trader with ₹10,00,000 faces a 20% drawdown, bringing the balance to ₹8,00,000. To recover, they need a 25% return. Instead of doubling risk to chase recovery, the trader should:
Analyze the causes of the drawdown (market conditions, poor discipline, or strategy flaw).
Cut trade size by 50% and resume trading with lower risk.
Apply stricter stop-loss and higher-quality setups.
Monitor progress weekly and avoid trading out of frustration.
Over time, disciplined management helps restore both capital and confidence.
11. The Role of Technology and Automation
Modern trading platforms and algorithms enhance risk control through:
Automated Stop-Loss Orders: Prevent emotional override.
Risk Dashboards: Display real-time exposure and drawdowns.
Algorithmic Execution: Reduces human error and enforces rules-based trading.
These tools make it easier to implement consistent risk management practices.
12. Conclusion
Managing losses and drawdowns is a vital component of long-term success in trading and investing. Every market participant will experience losses—what matters is how those losses are handled. By setting proper stop-losses, controlling position sizes, diversifying portfolios, maintaining emotional discipline, and using technological tools, traders can limit damage during downturns and position themselves for future growth.
The most successful traders are not those who never lose but those who survive and thrive despite losses. Effective drawdown management transforms temporary setbacks into valuable learning experiences, ensuring steady progress toward consistent profitability and financial resilience.
Interest Rates Explained: Definition, Types and DeterminantsDefinition of Interest Rates
An interest rate is the cost of borrowing money or the reward for saving it, expressed as a percentage of the principal amount per period, typically per year. When you borrow money, you pay interest; when you lend or deposit money, you earn interest. Essentially, it represents the “price” of money — how much it costs to use someone else’s funds for a specific time.
For example, if you borrow ₹100,000 at an annual interest rate of 10%, you owe ₹10,000 as interest after one year. Conversely, if you deposit ₹100,000 in a bank account offering 6% interest, you earn ₹6,000 in a year.
Types of Interest Rates
Interest rates can be classified into several types depending on the context and application.
1. Nominal and Real Interest Rates
Nominal interest rate is the rate stated on financial instruments or loans without adjusting for inflation.
Real interest rate is the nominal rate minus the inflation rate.
Real Interest Rate = Nominal Rate − Inflation Rate
For example, if a bank offers 8% nominal interest and inflation is 5%, the real interest rate is 3%. Real rates reflect the true earning or cost of money in terms of purchasing power.
2. Fixed and Floating (Variable) Interest Rates
Fixed rate remains constant throughout the loan or investment term. This offers stability and predictability.
Floating or variable rate changes over time, often linked to a benchmark such as the repo rate or LIBOR (London Interbank Offered Rate). These rates fluctuate with market conditions.
3. Simple and Compound Interest
Simple interest is calculated only on the principal amount.
Simple Interest
=
𝑃
×
𝑅
×
𝑇
/
100
Simple Interest=P×R×T/100
Compound interest is calculated on both the principal and accumulated interest. It grows faster because of the compounding effect — interest on interest.
4. Short-term and Long-term Interest Rates
Short-term rates apply to loans or deposits with a maturity of less than a year.
Long-term rates apply to financial instruments with longer maturities, such as bonds or mortgages.
Determinants of Interest Rates
Interest rates are influenced by a combination of macroeconomic factors, government policies, and market dynamics. The key determinants include:
1. Central Bank Policy
The central bank (e.g., the Reserve Bank of India, or RBI) plays a crucial role in setting benchmark rates. In India, the repo rate — the rate at which banks borrow from the RBI — serves as the primary policy rate. When the repo rate rises, borrowing becomes more expensive, reducing liquidity and controlling inflation. Conversely, a lower repo rate stimulates borrowing and investment.
2. Inflation
Inflation has a direct relationship with interest rates. Higher inflation erodes the purchasing power of money, prompting central banks to raise rates to curb excessive spending. On the other hand, when inflation is low, rates are reduced to encourage consumption and investment.
3. Demand and Supply of Credit
When businesses and consumers demand more loans, the demand for credit rises, pushing interest rates up. If the supply of funds in the banking system is high, interest rates tend to fall.
4. Economic Growth
In a growing economy, investment opportunities expand, and demand for capital increases, often leading to higher rates. During recessions, central banks lower rates to revive growth.
5. Government Borrowing
When a government borrows heavily through bonds, it can increase the overall demand for credit, leading to higher interest rates, especially if private savings are limited.
6. Global Factors
Global interest rate trends, especially in major economies like the United States, influence domestic rates. For instance, if U.S. rates rise, investors might shift funds from emerging markets, prompting those countries to raise rates to retain capital.
Role of Interest Rates in the Economy
Interest rates act as a powerful lever of economic control, influencing spending, investment, inflation, and exchange rates. Their effects can be seen in several areas:
1. Consumption and Savings
High interest rates encourage people to save more and borrow less because the cost of loans increases and returns on savings rise. Low rates have the opposite effect — borrowing becomes cheaper, boosting consumption.
2. Business Investment
Companies often finance expansion through borrowed funds. When rates are low, borrowing costs decrease, encouraging investment in new projects, machinery, or technology. Higher rates discourage borrowing and can slow corporate growth.
3. Inflation Control
Central banks use interest rates to manage inflation. Raising rates helps reduce money circulation, cooling demand and lowering inflationary pressure. Lowering rates increases liquidity, stimulating spending when inflation is low.
4. Employment and Growth
When interest rates are low, investment rises, production expands, and employment increases. Conversely, high interest rates can slow down business activities, leading to reduced hiring and slower economic growth.
5. Exchange Rates and Foreign Investment
Higher interest rates attract foreign capital as investors seek better returns, strengthening the domestic currency. Lower rates can lead to currency depreciation but may boost exports by making goods cheaper abroad.
Interest Rates and Financial Markets
Interest rates have a profound impact on stock, bond, and real estate markets.
1. Bond Market
Bond prices and interest rates move inversely. When interest rates rise, existing bonds with lower yields become less attractive, causing their prices to fall. Conversely, when rates fall, bond prices rise.
2. Stock Market
Low interest rates usually lead to higher stock prices as companies benefit from cheaper financing and investors shift funds from low-yield savings to equities. High rates can depress stock prices due to higher borrowing costs and reduced profit margins.
3. Real Estate
Interest rates directly affect mortgage rates. Lower rates make housing loans cheaper, boosting demand for property. Rising rates, however, reduce affordability and slow down real estate growth.
Interest Rates and Personal Finance
For individuals, interest rates influence nearly every financial decision:
Loans and EMIs: Higher rates mean larger monthly payments for home, car, or education loans.
Savings and Investments: When rates are high, fixed deposits and bonds become more rewarding.
Credit Cards: Variable interest rates on credit cards can increase financial burden when rates rise.
Understanding interest rates helps individuals plan better, manage debt effectively, and optimize investment returns.
Recent Trends in Interest Rates
In recent years, global interest rates have fluctuated sharply due to economic disruptions like the COVID-19 pandemic, inflationary pressures, and central bank interventions. Many central banks, including the U.S. Federal Reserve and the RBI, initially cut rates to stimulate growth but later increased them to control rising inflation. The balancing act between growth and price stability continues to define interest rate trends worldwide.
Conclusion
Interest rates are much more than a number quoted by banks — they are a critical economic signal that affects every aspect of financial life. They determine the cost of credit, influence investment behavior, and serve as a tool for managing inflation and growth. Understanding how interest rates work enables individuals, businesses, and policymakers to make informed financial and economic decisions. In essence, interest rates reflect the heartbeat of an economy — when they change, the entire economic system responds.
Institutional Option Writing Strategies1. Understanding Option Writing
In simple terms, option writing involves selling call or put options to another party.
A call option writer agrees to sell an asset at a specified strike price if the buyer exercises the option.
A put option writer agrees to buy the asset at the strike price if exercised.
The writer receives the option premium upfront. If the option expires worthless, the writer keeps the entire premium as profit. Institutions, with their deep capital bases and risk management tools, leverage this structure to earn steady income streams while controlling exposure to extreme price moves.
2. Institutional Objectives Behind Option Writing
Institutions pursue option writing strategies for several key reasons:
Income Generation: Writing options generates regular cash inflows through premiums, especially during low-volatility market phases.
Portfolio Enhancement: Option writing can supplement portfolio returns without requiring additional capital allocation.
Hedging and Risk Management: Institutions may write options to hedge against downside or upside risks in their existing equity or fixed-income portfolios.
Volatility Harvesting: Many institutional traders exploit the difference between implied volatility (reflected in option prices) and realized volatility (actual market movement). When implied volatility is higher, writing options becomes more profitable.
3. Core Institutional Writing Strategies
Institutions employ a range of structured option writing techniques. Below are some of the most common and powerful institutional approaches:
A. Covered Call Writing
Description:
This is one of the most widely used strategies by institutional investors holding long positions in equities or indices. A call option is written against an existing holding.
Example:
If a fund owns 1 million shares of Reliance Industries and expects the price to remain stable or rise moderately, it might sell call options at a higher strike price.
Objective:
Earn option premiums while retaining upside potential (limited to the strike price).
Improve portfolio yield in sideways markets.
Institutional Use Case:
Large mutual funds, ETFs, and pension funds employ systematic covered call writing programs (e.g., the CBOE BuyWrite Index) to generate incremental yield.
B. Cash-Secured Put Writing
Description:
Here, an institution writes put options on securities it is willing to buy at lower prices.
Example:
If an institutional investor wants to purchase Infosys at ₹1,400 while the current market price is ₹1,500, it may sell a ₹1,400 put option. If the price drops, the institution buys the shares effectively at a discounted rate (strike price minus premium).
Objective:
Acquire desired stocks at a lower effective price.
Earn premiums if the option expires worthless.
Institutional Use Case:
Hedge funds and asset managers use this as a buy-entry strategy to accumulate equities in a disciplined manner.
C. Short Straddles and Strangles
Description:
These are non-directional premium harvesting strategies.
A short straddle involves selling both a call and a put at the same strike price.
A short strangle involves selling out-of-the-money (OTM) calls and puts at different strike prices.
Objective:
Profit from time decay and low realized volatility, as the position benefits when the underlying remains range-bound.
Institutional Use Case:
Market-making firms and volatility funds often employ delta-neutral short volatility trades, dynamically hedging exposure with futures or underlying assets to capture theta (time decay).
D. Covered Put Writing (or Reverse Conversion)
Description:
Institutions short the underlying asset and sell a put option simultaneously. This is effectively a synthetic short call position.
Objective:
Generate income from premium while holding a bearish outlook.
Institutional Use Case:
Used by proprietary desks to benefit from short-term bearish sentiment in overvalued stocks or indices.
E. Iron Condors and Iron Butterflies
Description:
These are advanced multi-leg strategies combining short straddles/strangles with long options for limited risk exposure.
Example:
An iron condor involves selling a short strangle and buying further OTM options as protection.
Objective:
Collect premium in range-bound markets while capping potential losses.
Institutional Use Case:
Quantitative hedge funds and volatility arbitrage desks often implement automated iron condor portfolios to capture small, consistent returns.
4. Risk Management in Institutional Option Writing
Unlike retail traders who often underestimate risk, institutions deploy rigorous frameworks to manage exposure. Some key practices include:
Delta Hedging: Institutions continuously adjust their underlying asset positions to maintain a neutral delta, reducing directional risk.
Value-at-Risk (VaR) Modeling: Quantitative models assess potential losses from adverse market movements.
Portfolio Diversification: Writing options across multiple securities, expirations, and strikes reduces concentration risk.
Volatility Analysis: Institutions track implied vs. realized volatility spreads to identify favorable conditions for selling options.
Position Limits: Regulatory and internal risk limits prevent overexposure to specific assets or strikes.
Dynamic Adjustments: Algorithms monitor changing market conditions to rebalance or exit positions.
5. Quantitative and Algorithmic Enhancements
Modern institutions integrate machine learning, data analytics, and algorithmic trading into their option writing programs. Some methods include:
Statistical Arbitrage Models: Exploit mispricing between options and underlying securities.
Volatility Forecasting: AI-driven models predict short-term volatility to optimize strike and expiration selection.
Automated Execution: Algorithms manage large-scale multi-leg option portfolios efficiently.
Gamma Scalping: Automated hedging against volatility swings ensures steady theta profits.
These advanced systems allow institutions to operate with precision and scalability impossible for manual traders.
6. Market Conditions Favorable for Option Writing
Institutional writers thrive under certain market conditions:
Stable or Sideways Markets: Time decay (theta) works in favor of sellers.
High Implied Volatility: Premiums are inflated, offering better reward-to-risk ratios.
Interest Rate Stability: Predictable macroeconomic conditions help maintain market equilibrium.
However, during periods of high market uncertainty—such as financial crises or unexpected geopolitical shocks—institutions may reduce or hedge their short volatility exposure aggressively.
7. Regulatory and Compliance Considerations
Institutions are subject to stringent SEBI, CFTC, and exchange-level regulations when engaging in derivatives trading. They must maintain adequate margin requirements, adhere to risk disclosure norms, and report large open positions. Compliance systems automatically monitor exposure to ensure adherence to capital adequacy and position limits.
8. Advantages of Institutional Option Writing
Consistent Income Generation through premium collection.
Portfolio Stability by offsetting volatility.
Improved Capital Efficiency through margin optimization.
Systematic and Scalable execution via automation.
Enhanced Long-Term Returns through disciplined risk-managed exposure.
9. Risks and Challenges
Despite its appeal, option writing carries notable risks:
Unlimited Loss Potential: Particularly in uncovered call writing.
Volatility Spikes: Sudden market swings can cause large mark-to-market losses.
Liquidity Risk: Difficulties in adjusting large positions in fast-moving markets.
Margin Pressure: Rising volatility increases margin requirements, straining liquidity.
Execution Complexity: Requires sophisticated systems and continuous monitoring.
Institutions mitigate these risks through diversified, hedged, and dynamically managed portfolios.
10. Conclusion
Institutional option writing strategies represent a disciplined, risk-controlled approach to generating consistent returns in both bullish and neutral markets. Unlike speculative option buyers, institutional writers rely on probability, volatility analysis, and quantitative precision to achieve a long-term edge.
Through methods like covered calls, put writing, iron condors, and straddles, institutions systematically capture time decay and volatility premiums. Supported by advanced risk models and algorithmic execution, these strategies transform options from speculative instruments into powerful tools for income generation and portfolio optimization.
When executed with prudence and robust risk management, institutional option writing can serve as a cornerstone of stable, repeatable performance in modern financial markets.
Risk in Option Trading: Segments of Financial Markets1. Introduction to Options and Risk
Options are derivative instruments that give traders the right but not the obligation to buy (call option) or sell (put option) an underlying asset at a specified price (strike price) within a set time frame. While this flexibility can amplify profits, it can also magnify losses if the market moves unfavorably.
Unlike simple stock trading where risk is typically limited to the capital invested, option trading can expose traders to theoretically unlimited losses, depending on the strategy used. This complexity makes understanding option-related risks critical for both retail and institutional investors.
2. Types of Risks in Option Trading
Option trading involves several interconnected types of risk. The major categories include market risk, volatility risk, time decay (theta) risk, liquidity risk, and operational risk. Let’s explore each in detail.
A. Market Risk (Directional Risk)
Market risk, also known as directional risk, refers to the possibility of losing money due to adverse price movements in the underlying asset.
For Call Options: The risk arises if the price of the underlying asset fails to rise above the strike price before expiry. In this case, the option expires worthless, and the premium paid is lost.
For Put Options: The risk occurs if the price of the underlying fails to fall below the strike price, leading to a total loss of the premium.
For Option Sellers: The market risk is even higher. A call writer (seller) faces theoretically unlimited losses if the underlying price keeps rising, while a put writer can suffer heavy losses if the price falls drastically.
For example, if a trader sells a naked call on a stock trading at ₹1,000 with a strike price of ₹1,050 and the stock rallies to ₹1,200, the seller faces huge losses as they may have to deliver shares at ₹1,050 while buying them at ₹1,200 in the market.
B. Volatility Risk (Vega Risk)
Volatility is one of the most important factors influencing option prices. It reflects how much the underlying asset’s price fluctuates. Vega measures the sensitivity of an option’s price to changes in implied volatility.
High Volatility: Increases the premium of both call and put options because the probability of large price swings rises.
Low Volatility: Decreases option premiums as the likelihood of significant price movement reduces.
Traders holding long options (buyers) benefit from rising volatility since it inflates option prices. Conversely, sellers (writers) are hurt when volatility rises, as they may need to buy back the options at a higher premium.
The challenge arises when volatility changes unexpectedly. Even if the direction of the underlying asset moves favorably, a fall in volatility can reduce the option’s value — leading to losses despite being "right" about the price movement.
C. Time Decay Risk (Theta Risk)
Time decay (Theta) is a silent killer for option buyers. Options lose value as they approach expiration because the probability of a significant price move declines with time.
For Buyers: Each passing day erodes the option’s extrinsic value, even if the market doesn’t move. If the underlying asset doesn’t move as expected within a limited time, the option can expire worthless.
For Sellers: Time decay works in their favor. They benefit as the option’s value decreases over time, allowing them to buy it back at a lower price or let it expire worthless.
For instance, if an investor buys a call option for ₹100 with one week to expiry and the underlying asset stays flat, the option may fall to ₹40 simply due to time decay, even though the price hasn’t changed.
D. Liquidity Risk
Liquidity risk refers to the difficulty of entering or exiting a position without significantly affecting the market price. In illiquid options (those with low trading volumes and wide bid-ask spreads), traders may have to buy at a higher price and sell at a lower one, reducing profitability.
A wide bid-ask spread can erode returns and make stop-loss strategies ineffective. For example, an option quoted at ₹10 (bid) and ₹15 (ask) has a ₹5 spread — meaning a trader buying at ₹15 might only be able to sell at ₹10 immediately, losing ₹5 instantly.
This is particularly common in options of less popular stocks or far out-of-the-money strikes.
E. Leverage Risk
Options provide built-in leverage. With a small investment, traders can control a large notional value of the underlying asset. While this magnifies potential gains, it also amplifies losses.
For example, if a ₹50 premium option controls 100 shares, the total exposure is ₹5,000. A 50% move in the option’s value results in a ₹2,500 change, equating to a 50% gain or loss on the entire investment. Such leverage can be disastrous without proper risk management.
F. Assignment and Exercise Risk
For option sellers, there is always the risk of assignment, meaning they might be forced to deliver (in the case of calls) or buy (in the case of puts) the underlying asset before expiration if the buyer chooses to exercise early.
In American-style options, early exercise can happen anytime before expiration, catching the seller off guard. This can lead to unexpected margin requirements or losses, especially around dividend dates or earnings announcements.
G. Margin and Leverage Risk for Sellers
Selling options requires maintaining a margin deposit. If the market moves against the position, brokers can issue a margin call demanding additional funds. Failure to meet it can result in forced liquidation at unfavorable prices.
Because potential losses for naked option writers are theoretically unlimited, many traders face catastrophic losses when they fail to manage margin requirements properly.
H. Event and Gap Risk
Market-moving events such as earnings announcements, policy changes, or geopolitical developments can lead to sudden price gaps. These gaps can cause significant losses, especially for short-term traders or option sellers.
For example, if a company reports poor earnings overnight and its stock opens 20% lower the next day, all short put sellers will face massive losses instantly, often before they can react.
I. Psychological and Behavioral Risks
Option trading requires discipline, emotional control, and quick decision-making. Greed, fear, and overconfidence can lead traders to take excessive risks or hold losing positions too long. The complexity of options also tempts traders to overtrade, increasing transaction costs and exposure.
3. Managing Risks in Option Trading
While risks are inherent, they can be managed effectively with proper strategies and discipline:
Position Sizing: Never risk more than a small percentage of total capital on a single trade.
Stop-Loss Orders: Use stop-loss mechanisms to limit downside risk.
Hedging: Combine long and short options to reduce exposure (e.g., spreads or straddles).
Diversification: Avoid concentrating positions in one stock or sector.
Monitor Greeks: Regularly track Delta, Theta, Vega, and Gamma to understand sensitivity to market factors.
Avoid Naked Positions: Prefer covered calls or cash-secured puts over naked options.
Stay Informed: Be aware of corporate events, macroeconomic announcements, and volatility trends.
Paper Trade First: Beginners should practice with virtual trades before using real money.
4. Conclusion
Option trading offers immense profit potential but carries significant risk due to leverage, volatility, and time sensitivity. The same features that make options powerful tools for speculation or hedging can also make them dangerous for uninformed traders.
Successful option traders understand that managing risk is more important than chasing returns. By combining knowledge of market dynamics, disciplined strategies, and proper risk management, traders can navigate the complex world of options effectively and sustainably.
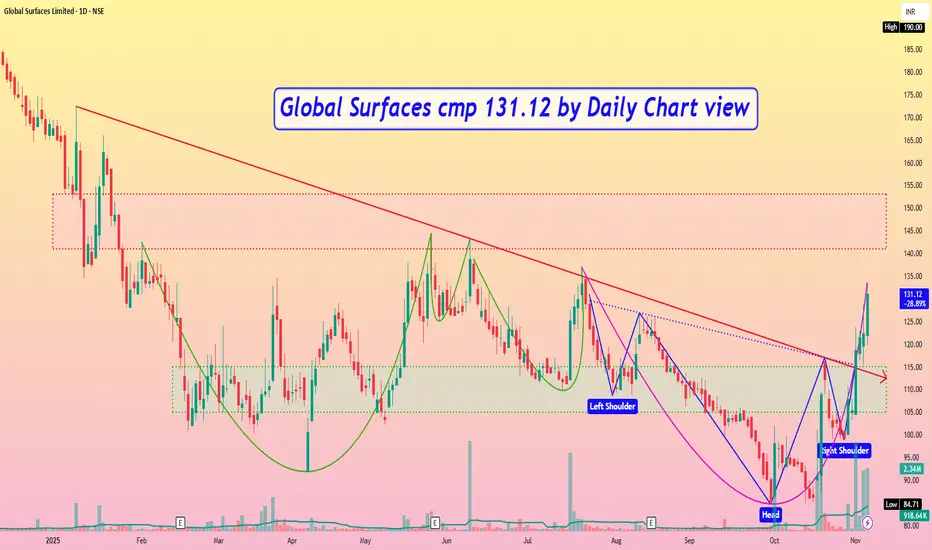
Global Surfaces cmp 131.12 by Daily Chart viewGlobal Surfaces cmp 131.12 by Daily Chart view
- Support Zone 105 to 115 Price Band
- Resistance Zone 141 to 153 Price Band
- Multiple Bullish Technical Chart patterns done
- Falling Resistance Trendline Breakout well sustained
- Majority of Technical Indicators seen trending positively
Knowledge of Candle Pattern What a candlestick shows (quick)
Body = open → close (filled/green = close>open bullish, filled/red = close

Premium Charts Tips for Successful Option Trading
Master the basics before applying advanced strategies.
Analyze market trends, OI data, and IV regularly.
Use proper risk management—never risk more than 1–2% of capital per trade.
Avoid trading near major events (earnings, RBI policy) unless experienced.
Keep learning through backtesting and continuous strategy refinement.

Part 11 Trading Masster ClassRole of Implied Volatility (IV) and Open Interest (OI)
Implied Volatility (IV): Indicates expected market volatility. Rising IV increases option premiums. Traders buy options during low IV and sell during high IV.
Open Interest (OI): Reflects the number of outstanding option contracts. Rising OI with price indicates strong trend confirmation, while divergence signals reversals.
These metrics help traders assess market sentiment and build informed positions.

Part 10 Trade Like InstitutionsOption Buying vs. Option Selling
Option Buyers have limited risk (premium paid) and unlimited potential profit. However, time decay works against them as Theta reduces the option’s value daily.
Option Sellers (Writers) have limited profit (premium received) but potentially unlimited risk. Sellers benefit from time decay and stable markets.
In the Indian market, most professional traders and institutions prefer option selling due to the high success rate when markets remain range-bound.

Pat 9 Tradig Master ClassThe Greeks in Options
The Greeks measure the sensitivity of an option’s price to various factors:
Delta: Measures how much the option’s price changes for a ₹1 move in the underlying asset.
Gamma: Measures the rate of change of delta; it helps traders understand how delta will change as the market moves.
Theta: Measures time decay—how much the option loses value each day as expiration approaches.
Vega: Measures sensitivity to volatility changes.
Rho: Measures sensitivity to interest rate changes.
Understanding these helps traders manage risk and create balanced strategies.
