Gravita Triangle Breakout 1DGravita is attempting to breakout after forming a triangle pattern on 1D timeframe with high volumes. The stock is also trading above 200ema. Enter after bullish confirmation.
Trend Lines

Part 8 Trading Master Class With Experts Role of Volume & Open Interest
These indicators help understand market participation:
Volume shows activity
Open Interest shows fresh positions
Rising OI + rising price → strong trend
Rising OI + falling price → trend strength in opposite direction
Falling OI → position unwinding
Options with high OI often influence intraday support/resistance.

Part 7 Trading Master Class With Experts Risks in Option Trading
1. For Option Buyers
High time decay
Need sharp moves
Volatility drop can cause losses
2. For Option Sellers
Large potential loss
Requires strict stop-loss
High volatility can spike premiums unpredictably

Nifty Intraday Analysis for 26th November 2025NSE:NIFTY
Index has resistance near 26075 – 26125 range and if index crosses and sustains above this level then may reach near 26275 – 26325 range.
Nifty has immediate support near 25725 – 25675 range and if this support is broken then index may tank near 25525 – 25475 range.

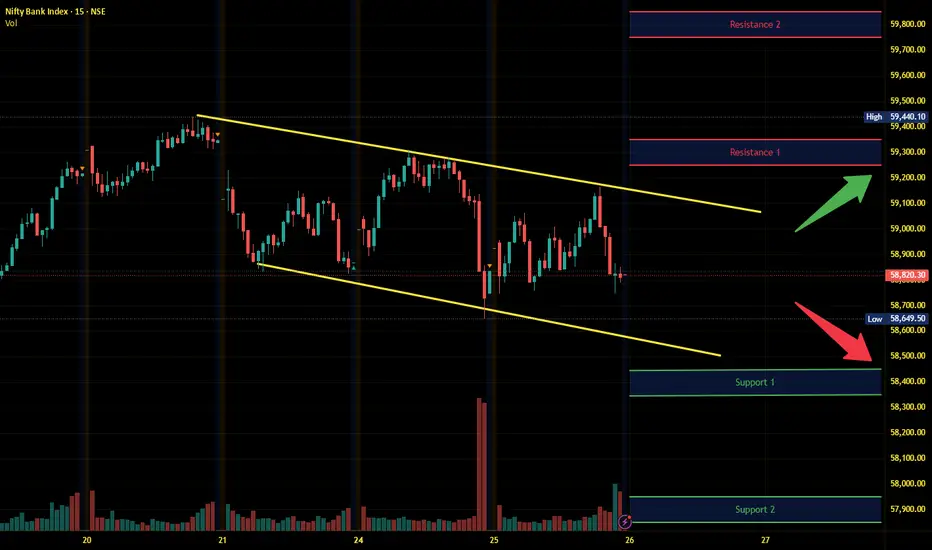
Banknifty Intraday Analysis for 26th November 2025NSE:BANKNIFTY
Index has resistance near 59250 – 59350 range and if index crosses and sustains above this level then may reach near 59750 – 59850 range.
Banknifty has immediate support near 58450 - 58350 range and if this support is broken then index may tank near 57950 - 57850 range.
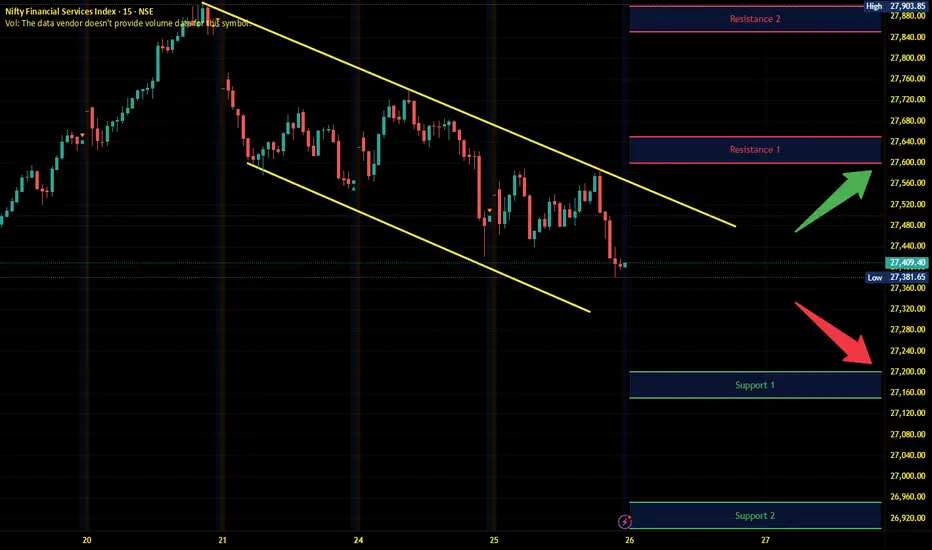
Finnifty Intraday Analysis for 26th November 2025 NSE:CNXFINANCE
Index has resistance near 27600 - 27650 range and if index crosses and sustains above this level then may reach near 27850 - 27900 range.
Finnifty has immediate support near 27200 – 27150 range and if this support is broken then index may tank near 26950 – 26900 range.
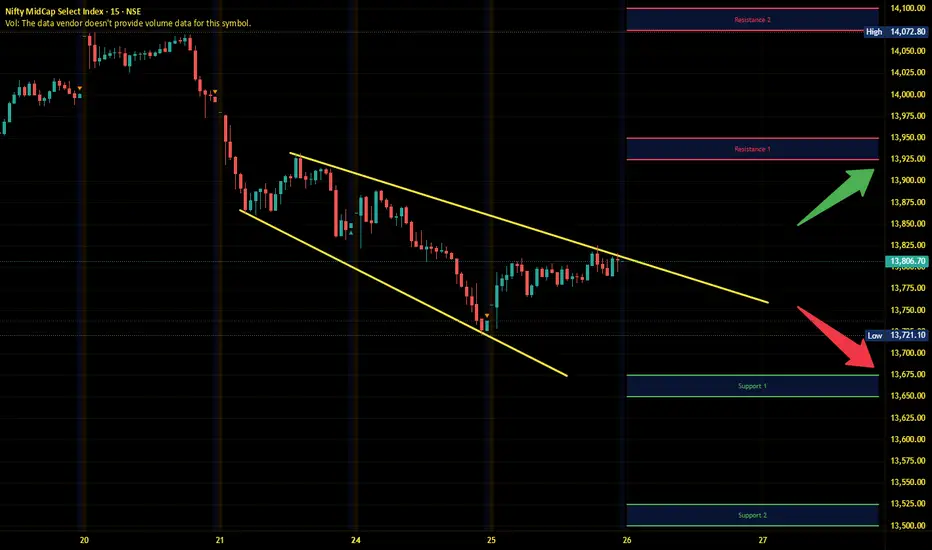
Midnifty Intraday Analysis for 26th November 2025NSE:NIFTY_MID_SELECT
Index has immediate resistance near 13925 – 13950 range and if index crosses and sustains above this level then may reach 14075 – 14100 range.
Midnifty has immediate support near 13675 – 13650 range and if this support is broken then index may tank near 13525 – 13500 range.
Part 6 Learn Institutional TradingWhat Is Premium?
Premium is the cost of buying an option.
It depends on multiple factors:
Underlying price
Strike price
Time to expiry
Volatility (IV)
Interest rates
Market demand and supply
If implied volatility is high, premium rises.
If expiry date is near, premium decays faster.

Part 4 Learn Institutional Trading Option Buyer vs. Option Seller
There are two sides to every option trade:
Option Buyer (Holder)
Pays premium
Limited loss
Unlimited profit potential
Needs strong directional movement
Time decay works against them
Option Seller (Writer)
Receives premium
Limited profit (premium only)
Large potential risk
Benefits from sideways/slow markets
Time decay works in favor

Part 3 Learn Institutional Trading Put Option Simplified
A put option is useful when you expect the market to go down.
When you buy a put, you are paying a premium for the right to sell.
If the underlying falls below your strike, your put gains value.
Example:
BANK NIFTY at 48,000. You buy a 48,000 PE.
If it falls to 47,500, your put becomes profitable.
Again, your maximum loss is limited to the premium.

Part 2 Ride The Big Moves Call Option Simplified
A call option is useful when you expect the market to go up.
If you buy a call option, you are paying a premium to the seller.
If the price rises above your strike price before expiry, your call option gains value.
Example:
NIFTY trading at 22,000. You buy a 22,000 CE.
If NIFTY goes to 22,300, your call becomes profitable because you have the right to buy at 22,000.
If the market falls instead, you lose only the premium you paid.

Options TradingIntroduction to Options Trading
Options trading is one of the most powerful yet misunderstood segments of the financial markets. Unlike stocks, which represent ownership in a company, options are financial contracts that give the holder the right, but not the obligation, to buy or sell an underlying asset at a predetermined price within a specific timeframe. Options are part of the derivatives family, meaning their value derives from the price movements of another asset, such as stocks, indices, commodities, or currencies.
Options trading allows investors to hedge risks, generate income, and speculate on market movements with comparatively smaller capital. They are versatile instruments, suitable for conservative hedging strategies as well as aggressive speculative plays. In India, options are actively traded on exchanges like NSE (National Stock Exchange) and are available on equities, indices (like Nifty 50), and commodities.
At its core, options trading is about flexibility and strategy. Unlike buying a stock outright, options let traders create positions that profit in bullish, bearish, or neutral market conditions. This flexibility is why professional traders and institutions frequently use options to manage risk, leverage capital, and optimize returns.
What Are Options?
An option is a contract between two parties: the buyer and the seller (writer). The buyer pays a price called a premium for the right to buy or sell the underlying asset at a specific price, known as the strike price, before the option expires. The seller, in turn, is obligated to fulfill the contract if the buyer exercises it.
Options are categorized into two main types:
Call Options – Give the holder the right to buy the underlying asset at the strike price.
Put Options – Give the holder the right to sell the underlying asset at the strike price.
The price of an option (premium) depends on multiple factors, such as:
The current price of the underlying asset.
The strike price relative to the current price.
Time until expiration (time decay).
Volatility of the underlying asset.
Interest rates and dividends (for equities).
Because options are derivative instruments, they allow traders to control a larger position with smaller capital. For instance, buying one Nifty 50 call option might give exposure equivalent to 50 shares of the index, but at a fraction of the capital required to buy the shares directly.
Options come with an expiration date, after which they become worthless if not exercised or closed. This characteristic introduces an important concept called time decay (Theta), which significantly influences option pricing and strategy.
Calls vs Puts: The Basics
Options are essentially bets on market direction, and the two main instruments—calls and puts—represent opposite positions.
1. Call Options
Definition: A call option gives the buyer the right, but not the obligation, to buy the underlying asset at a predetermined strike price before or on the expiration date.
When to Buy: Traders buy call options when they expect the price of the underlying asset to rise.
Profit Potential: The potential profit is theoretically unlimited, as the asset price can rise indefinitely above the strike price.
Risk: The maximum risk for the call option buyer is the premium paid, which is the cost of acquiring the option.
Example: Suppose Reliance Industries is trading at ₹2,500. A trader buys a call option with a strike price of ₹2,600, paying a premium of ₹50. If the stock rises to ₹2,700, the intrinsic value is ₹100, resulting in a profit of ₹50 per share after deducting the premium.
2. Put Options
Definition: A put option gives the buyer the right, but not the obligation, to sell the underlying asset at a predetermined strike price before or on expiration.
When to Buy: Traders buy put options when they expect the price of the underlying asset to fall.
Profit Potential: The potential profit increases as the price of the underlying asset declines. In theory, the maximum gain occurs if the asset price drops to zero.
Risk: Like calls, the maximum risk is limited to the premium paid.
Example: Suppose Infosys is trading at ₹1,500. A trader buys a put option with a strike price of ₹1,450 for a premium of ₹30. If Infosys falls to ₹1,400, the intrinsic value of the put is ₹50, resulting in a profit of ₹20 per share after deducting the premium.
Comparison Table: Calls vs Puts
Feature Call Option Put Option
Right To buy underlying asset To sell underlying asset
Market Expectation Bullish (price rise) Bearish (price fall)
Maximum Loss Premium paid Premium paid
Maximum Gain Unlimited Strike price minus premium (asset cannot
go below zero)
Used for Speculation, hedging long Speculation, hedging short positions
positions
Importance of Understanding Option Mechanics
Understanding the mechanics of options is crucial for traders to make informed decisions and manage risk effectively. Options are not standalone investments—they interact with market dynamics, time decay, volatility, and pricing models. Misunderstanding these mechanics can lead to significant losses, even in seemingly simple trades.
1. Pricing Factors
The pricing of options depends on variables like the underlying asset’s price, strike price, time to expiration, volatility, and interest rates. Using models like Black-Scholes (for European options) or Binomial models (for American options) helps traders understand fair value and identify mispriced options.
2. Risk Management
Options can limit risk for buyers because the maximum loss is the premium paid, while sellers face theoretically unlimited risk (especially naked call sellers). Understanding the payoff structure allows traders to balance reward vs. risk and design hedging strategies.
3. Strategic Flexibility
Options mechanics allow for sophisticated strategies beyond just buying calls and puts. Traders can combine calls, puts, and underlying assets to create strategies like:
Covered Calls – Generating income on existing holdings.
Protective Puts – Hedging against downside risk.
Spreads and Straddles – Leveraging volatility for profit.
Without a solid grasp of how options work, implementing these strategies can become confusing and risky.
4. Timing and Volatility
Time decay (Theta) erodes option value as expiration approaches. Traders must understand how timing affects profitability. Similarly, volatility (Vega) impacts premiums: higher volatility increases option prices, offering potential for greater profit but also higher cost. Ignoring these factors can lead to unexpected losses even if the market moves in the anticipated direction.
5. Hedging and Speculation
Options are invaluable for hedging. For example, an investor holding a long stock position can buy puts as insurance against market decline. Conversely, options can be used for speculation with leverage, allowing traders to control large positions with limited capital. Understanding mechanics ensures these strategies are applied effectively.
Conclusion
Options trading is a dynamic and versatile arena within financial markets. Understanding what options are, the distinction between calls and puts, and the mechanics behind option pricing is essential for anyone looking to trade wisely. Calls allow traders to profit from rising markets, while puts benefit from falling prices. Both offer defined risk for buyers and strategic opportunities when used correctly.
Mastering option mechanics is not just about predicting market direction—it’s about timing, volatility, premium management, and strategic deployment. Traders who understand these nuances can leverage options for hedging, income generation, and speculation, making them one of the most powerful tools in modern finance.

Technical Indicators Used in Momentum Trading1. Relative Strength Index (RSI)
The Relative Strength Index (RSI) is one of the most popular momentum indicators used by traders. Developed by J. Welles Wilder, the RSI measures the speed and magnitude of price movements over a specified period, typically 14 days. The indicator oscillates between 0 and 100 and helps identify overbought and oversold conditions in the market.
Overbought Condition: RSI above 70 suggests that the asset might be overbought, indicating potential for a price correction or trend reversal.
Oversold Condition: RSI below 30 suggests the asset may be oversold, providing potential buying opportunities.
RSI is particularly effective in momentum trading because it reflects the strength of price trends and highlights potential entry and exit points. Traders often combine RSI with other indicators to confirm momentum.
2. Moving Average Convergence Divergence (MACD)
The MACD is another essential tool in momentum trading. It measures the relationship between two moving averages, typically the 12-day and 26-day exponential moving averages (EMA), and produces a MACD line. A 9-day EMA of the MACD, known as the signal line, helps identify buy or sell signals.
Bullish Signal: When the MACD line crosses above the signal line, it suggests upward momentum.
Bearish Signal: When the MACD line crosses below the signal line, it indicates downward momentum.
MACD is valuable for momentum traders because it captures trend strength and potential reversals, allowing traders to time entries and exits more effectively.
3. Stochastic Oscillator
The Stochastic Oscillator is a momentum indicator that compares the closing price of an asset to its price range over a specific period, usually 14 periods. It consists of two lines: %K (fast line) and %D (slow line).
Overbought Condition: Readings above 80 suggest that the asset may be overbought.
Oversold Condition: Readings below 20 indicate that the asset may be oversold.
The Stochastic Oscillator is particularly effective in identifying short-term momentum shifts and spotting potential reversals in both trending and range-bound markets. Traders often use stochastic divergences, where price moves contrary to the oscillator, to detect weakening trends.
4. Average Directional Index (ADX)
The Average Directional Index (ADX) measures the strength of a trend rather than its direction. It is derived from the +DI and −DI lines, which indicate upward and downward directional movement. ADX values range from 0 to 100:
Strong Trend: ADX above 25 indicates a strong trend.
Weak or No Trend: ADX below 20 suggests a weak or sideways market.
Momentum traders rely on ADX to identify when a trend is gaining strength, which is essential for confirming momentum-driven trades. Unlike oscillators, ADX does not provide overbought or oversold signals but instead signals trend strength.
5. Bollinger Bands
While Bollinger Bands are primarily used to measure volatility, they also help identify momentum changes. Bollinger Bands consist of a moving average (usually 20-period SMA) and two standard deviation lines above and below it.
Price Breakout: When the price moves outside the bands, it indicates strong momentum.
Squeeze: Narrow bands indicate low volatility and potential for a momentum breakout.
Momentum traders use Bollinger Bands to spot explosive moves and gauge the strength of trends. When prices ride the upper or lower band, it often signifies strong trend momentum.
6. Commodity Channel Index (CCI)
The Commodity Channel Index (CCI) measures the deviation of the asset's price from its moving average. Typically, a 20-period CCI is used, oscillating between +100 and −100.
Overbought: CCI above +100.
Oversold: CCI below −100.
CCI is particularly useful in momentum trading for identifying cyclical trends and potential reversals. It is often combined with trend-following indicators to improve accuracy.
7. On-Balance Volume (OBV)
The On-Balance Volume (OBV) is a volume-based momentum indicator. It accumulates volume based on whether the price closes higher or lower than the previous period.
Rising OBV: Confirms upward price momentum.
Falling OBV: Confirms downward price momentum.
OBV is valuable for traders to confirm price trends with volume support. Momentum traders often rely on OBV divergences to spot potential reversals before they occur.
8. Ichimoku Cloud
The Ichimoku Cloud is a comprehensive indicator that combines trend, momentum, and support/resistance in a single view. Key components include the Tenkan-sen, Kijun-sen, Senkou Span A, and Senkou Span B.
Bullish Momentum: Price above the cloud.
Bearish Momentum: Price below the cloud.
Ichimoku Cloud helps momentum traders identify trend direction and potential entry/exit points while also providing a sense of trend strength.
9. Practical Tips for Using Momentum Indicators
Combine Indicators: No single indicator provides perfect signals. Traders often combine RSI, MACD, and ADX for better confirmation.
Confirm Trend Direction: Use trend-following indicators alongside oscillators to avoid false signals in sideways markets.
Time Frame Selection: Short-term traders may prefer 5–15 minute charts, while swing traders use daily or weekly charts.
Watch for Divergence: Momentum divergence, where price moves contrary to an indicator, often signals weakening momentum.
Risk Management: Momentum trading can be fast-moving; always use stop-loss orders and position sizing.
10. Conclusion
Momentum trading relies heavily on technical indicators to make informed decisions. Indicators such as RSI, MACD, Stochastic Oscillator, ADX, ROC, Bollinger Bands, CCI, OBV, and Ichimoku Cloud provide traders with quantitative insights into trend strength, potential reversals, and overbought or oversold conditions. By understanding the strengths and limitations of each indicator, momentum traders can optimize their strategies, identify high-probability trade setups, and manage risk effectively.
While technical indicators are powerful tools, successful momentum trading also requires discipline, market awareness, and a solid risk management plan. Using indicators in conjunction with proper trading psychology and market knowledge increases the likelihood of consistent profitability in dynamic markets.
Introduction to Futures HedgingUnderstanding Futures Contracts
A futures contract is a standardized legal agreement to buy or sell an asset at a predetermined price at a specified future date. These contracts are traded on organized exchanges, ensuring liquidity, transparency, and regulatory oversight. The underlying asset in a futures contract could be a physical commodity such as crude oil, wheat, or gold, or a financial instrument like an index, bond, or currency.
Futures contracts have key characteristics:
Standardization: The contract specifies the quantity, quality, and delivery date of the underlying asset.
Margin Requirements: Traders must maintain a margin—a fraction of the contract value—to enter into futures positions.
Mark-to-Market: Gains and losses are settled daily based on the contract’s market value.
Leverage: Futures allow traders to control large positions with relatively small capital, magnifying both potential gains and losses.
These features make futures contracts ideal tools for hedging because they provide predictability and protection against price volatility.
The Concept of Hedging
Hedging is the practice of taking an investment position in one market to offset potential losses in another. In essence, it acts like insurance: while it may limit potential profits, it also minimizes exposure to losses. There are two main types of hedging:
Long Hedge: Used when a business anticipates purchasing an asset in the future and wants to lock in the current price to avoid rising costs.
Example: An airline expects to buy jet fuel in six months. To protect against rising fuel prices, it can buy futures contracts now at the current price. If fuel prices rise, the gain on the futures contract offsets the higher cost of purchasing fuel in the future.
Short Hedge: Used when a business holds an asset and wants to protect against falling prices.
Example: A wheat farmer expects to harvest in three months. To avoid losses if wheat prices fall, the farmer can sell wheat futures contracts now. If the price drops, the profit on the futures contract compensates for the lower market price of the physical wheat.
By employing hedging strategies, both buyers and sellers can stabilize cash flows and plan their operations with more certainty.
Importance of Futures Hedging
Risk Management: The primary objective of futures hedging is to manage price risk. Businesses in agriculture, energy, metals, and finance frequently use futures to minimize the impact of adverse price movements.
Price Discovery: Futures markets facilitate price discovery, reflecting expectations of supply and demand. Hedgers benefit by gaining insight into future price trends.
Financial Stability: Hedging provides stability to earnings and costs. For companies with significant exposure to commodity or currency fluctuations, this stability supports strategic planning, investment, and growth.
Speculation Reduction: By hedging, companies avoid excessive exposure to speculation-driven market movements, focusing instead on their core business operations.
Enhanced Creditworthiness: Companies with effective hedging programs are viewed as financially prudent by lenders and investors, improving access to capital.
Mechanics of Futures Hedging
Hedging with futures involves several steps:
Identify the Exposure: Determine which assets, commodities, or financial instruments are exposed to price risk.
Select the Appropriate Futures Contract: Choose a futures contract that closely matches the underlying asset in terms of quantity, quality, and timing.
Decide the Hedge Ratio: The hedge ratio determines the number of futures contracts needed to offset the risk. Perfect hedges are rare; often, partial hedges are employed to balance risk reduction and cost.
Enter the Futures Position: Buy or sell futures contracts depending on whether a long or short hedge is appropriate.
Monitor and Adjust: As market conditions change, hedgers must monitor their positions and adjust contracts to maintain effective risk coverage.
Close or Offset the Hedge: Futures contracts can be offset before expiration by taking an opposite position or allowed to expire if physical delivery aligns with the hedger’s requirements.
Examples of Futures Hedging
1. Agricultural Hedging:
A corn farmer expects to harvest 10,000 bushels in four months. Concerned about falling prices, the farmer sells corn futures contracts now. When harvest time arrives, even if the market price has dropped, the farmer’s futures gains compensate for the lower sale price, ensuring financial stability.
2. Corporate Hedging:
A multinational company expects to receive €5 million in payments in six months but operates primarily in USD. To protect against EUR/USD exchange rate fluctuations, the company sells euro futures contracts. If the euro depreciates, gains on the futures offset the reduced dollar value of the payment.
3. Commodity Hedging:
An airline hedges against rising fuel costs by buying crude oil futures. If oil prices increase, the gain on the futures contracts compensates for higher fuel costs, helping maintain profitability.
Advantages of Futures Hedging
Predictable Cash Flows: Hedging reduces uncertainty in revenue and costs.
Flexibility: Futures can be tailored to different commodities, currencies, or indices.
Liquidity: Exchange-traded futures offer easy entry and exit.
Leverage: Efficient capital use allows risk management without tying up large amounts of money.
Transparency: Prices are visible and regulated, reducing counterparty risk.
Limitations of Futures Hedging
Basis Risk: The futures price may not move perfectly in line with the underlying asset, resulting in imperfect hedges.
Cost: Margins and transaction fees add to the cost of hedging.
Limited Profit Potential: Hedging locks in prices, reducing the opportunity to benefit from favorable market movements.
Complexity: Understanding contract specifications, hedge ratios, and market dynamics requires expertise.
Over-hedging Risk: Using excessive futures positions can create unintended exposure and losses.
Conclusion
Futures hedging is a vital risk management tool in modern financial and commodity markets. It allows businesses and investors to stabilize cash flows, plan effectively, and mitigate losses arising from adverse price movements. By understanding the mechanics, advantages, and limitations of futures contracts, market participants can use hedging strategies to navigate volatile markets with confidence. While futures hedging does not eliminate risk entirely, it transforms unpredictable market movements into manageable financial outcomes, fostering greater stability and strategic decision-making.
In an increasingly globalized and interconnected economy, the role of futures hedging has expanded beyond traditional commodities to include financial instruments, currencies, and indices. Companies, investors, and financial institutions that employ well-structured hedging strategies are better positioned to withstand market shocks, protect their profitability, and achieve long-term growth.
Introduction to the AI-Driven Trading EraThe Evolution of Trading Technology
To understand the AI-driven era, it is important to look back at how trading technology has evolved. Markets moved from the open-outcry system to electronic trading, and from electronic trading to algorithmic models. Algorithmic trading introduced systematic rule-based execution, but these systems still relied heavily on predefined human logic. AI changes that framework by enabling trading systems to learn, adapt, and optimize themselves using vast amounts of data.
This evolution happened because markets became too fast, too complex, and too data-driven for human traders to handle manually. AI emerged as the natural solution for processing huge datasets, identifying hidden patterns, and executing trades in microseconds.
What Makes AI a Game Changer in Trading?
AI’s advantage lies in its ability to detect nonlinear patterns, its speed, and its capacity to learn autonomously. Unlike conventional formulas that follow static rules, AI models adjust themselves based on new market behavior, making them exceptionally powerful during volatility, regime shifts, or unexpected market events.
Some key strengths of AI-driven trading systems include:
1. Big Data Processing
Financial markets produce enormous amounts of data: price ticks, news, economic indicators, global sentiments, social media activity, institutional flows, and alternative datasets like satellite images or credit card spending. AI models can process all of these simultaneously, generating insights far beyond the reach of human analysis.
2. Predictive Modeling
Machine learning models learn from historical price data and trading patterns to predict potential future outcomes. While no model is perfect, AI significantly improves the probabilities and timing of accurate predictions.
3. Automation and Emotion-Free Decision Making
Human traders often suffer from fear, greed, overconfidence, and biases. AI systems remove emotional interference entirely, sticking to mathematical probabilities and risk-adjusted models.
4. Multi-Factor Integration
AI can combine dozens—or even hundreds—of variables to evaluate a trading opportunity, something impossible for a human trader. These include:
Technical indicators
Market microstructure signals
Volume patterns
Macroeconomic trends
Order book depth
Options flow
Global market correlations
5. Speed and Precision
AI-powered high-speed execution ensures minimal slippage, instant order routing, and accurate position sizing. This is crucial in markets where milliseconds can mean the difference between profit and loss.
The Rise of Machine Learning Models in Trading
Three major categories of ML models dominate AI trading today:
1. Supervised Learning
Models learn from labeled historical data to predict future price movements. Examples include:
Linear regression
Random forests
Gradient boosting models
Neural networks
These models are excellent at forecasting price direction, volatility, and risk.
2. Unsupervised Learning
Used for clustering, anomaly detection, and market regime identification. These models identify hidden structures in the market such as:
Patterns preceding trend reversals
Unusual behavior indicating manipulation
Shifts in market sentiment
3. Reinforcement Learning (RL)
One of the most exciting developments in AI trading, RL models learn by trial and error. They self-optimize by interacting with market environments, much like how AlphaGo learned to play Go. RL trading systems continuously adjust strategies based on reward maximization, making them extremely adaptive.
AI in High-Frequency Trading (HFT)
High-frequency trading firms were among the earliest adopters of AI. Their algorithms operate at lightning speed, executing thousands of trades per second. AI enhances HFT through:
Ultra-fast pattern recognition
Statistical arbitrage
Market-making
Latency arbitrage
Liquidity prediction
HFT remains one of the most profitable yet highly competitive areas of AI-powered markets.
AI for Retail Traders
The democratization of AI has brought powerful tools to retail traders in India and around the world. Cloud computing, open-source ML libraries, and broker APIs allow individuals to build and deploy their own AI models. Many retail traders now use:
AI-based scanners
Sentiment analysis bots
Automated trading systems
Options flow predictors
Reinforcement learning strategies
Platforms like Zerodha, Upstox, and Interactive Brokers support API-driven execution, enabling retail participants to operate like mini-quant firms.
AI and Market Microstructure
Advanced AI tools analyze market microstructure to exploit tiny inefficiencies. They evaluate:
Bid-ask spreads
Order book imbalances
Liquidity pockets
Iceberg orders
Hidden institutional flows
For traders, this means precise entries, better exit timing, and improved risk management.
Sentiment Analysis: The New Frontier
In the AI era, price is no longer the only source of truth. Sentiment is equally powerful. AI models scan:
News
Financial reports
Twitter
Reddit
Analyst commentary
CEO statements
Global events
Natural Language Processing (NLP) converts all this into actionable trading signals. For example, a sudden surge in negative sentiment often predicts a short-term drop in price.
Risks and Limitations of AI-Driven Trading
Despite its advantages, AI also brings challenges:
1. Overfitting
Models may perform well on historical data but poorly in live markets.
2. Black-Box Behavior
Deep learning models can be difficult to interpret.
3. Market Regime Shifts
AI can struggle when markets behave in ways not seen in training data.
4. Data Quality Issues
Incorrect, insufficient, or biased data leads to inaccurate predictions.
5. Overdependence
Traders relying entirely on AI may overlook fundamental risks or black swan events.
Successful AI trading requires human judgment, risk management, and continuous monitoring.
The Future of AI-Driven Trading
The AI trading era has only just begun. The future will likely include:
Fully autonomous trading systems
AI-powered portfolio optimization
Predictive risk models
Quantum computing–based trading algorithms
Personalized AI trading advisors
Real-time global sentiment heat maps
Markets will continue becoming faster, smarter, and more efficient. Traders who adopt AI early will have a powerful edge, while those who ignore it risk falling behind.
Trading Styles in the Indian Market1. Intraday Trading
Intraday trading, commonly known as day trading, is one of the most popular styles in India due to high volatility and leverage availability. It involves entering and exiting trades within the same trading day. The primary objective is to capture small price movements across large volumes.
Key Features
Short time frames: 1–5 minutes, 15 minutes, or hourly charts.
High leverage: Brokers offer margin for intraday trades.
Targets are small: 0.3% to 1.5% moves.
Risk management is crucial due to high volatility.
Popular Strategies
Momentum trading during market opening.
Breakout and breakdown strategies.
VWAP-based institutional flow tracking.
Reversal trades at key supply-demand zones.
Best Suited For
Traders with quick decision-making skills, emotional discipline, and the ability to monitor charts during market hours.
2. Swing Trading
Swing trading is ideally suited for the Indian market because stocks often move in short-term trends driven by news, earnings expectations, institutional flows, and sector rotation. Swing traders typically hold positions for 2–20 days.
Key Features
Higher timeframe analysis: Daily and weekly charts.
Lower stress compared to intraday.
Ideal for people with jobs who cannot monitor the market all day.
Uses technical patterns like flags, triangles, pullbacks, and breakouts.
Popular Swing Indicators
Moving averages (20, 50, 200)
RSI divergences
Fibonacci retracement zones
MACD crossovers
Best Suited For
Traders who prefer moderate risk, medium-term profits, and structured analysis without minute-to-minute monitoring.
3. Positional Trading
Positional trading involves holding trades for weeks to months based on broader market trends. This style is popular among experienced traders and investors who understand macro trends, sectoral cycles, and company fundamentals.
Key Features
Focus on major trends, not minor fluctuations.
Requires patience and conviction.
Uses weekly and monthly charts.
Less stressful than intraday/swing.
Approach
Use fundamentals for selection and technicals for timing.
Sectors like banking, FMCG, pharma, and IT respond well to positional plays.
Key tool: trendlines, moving averages, sector rotation analysis.
Best Suited For
Working professionals, medium-capital traders, and long-term thinkers.
4. Scalping
Scalping is one of the fastest and most advanced trading styles. The goal is to book very small profits (0.05%–0.3%) multiple times throughout the day. Scalping is extensively used in index derivatives—especially NIFTY, BANK NIFTY, and FINNIFTY—because liquidity and depth are extremely high.
Key Features
Extremely quick trades lasting seconds to minutes.
High frequency, low risk per trade.
Requires stable internet and low-latency execution.
Works best during high liquidity periods—opening hour and closing hour.
Tools
Option order flow
VWAP
Depth of market (DOM) data
Tick charts and footprint charts (for advanced scalpers)
Best Suited For
High-skill professional traders with strong reflexes, emotional control, and advanced tools.
5. Algorithmic and System-Based Trading
Algo trading has grown rapidly in India with the availability of APIs, platforms like Zerodha Streak, Tradetron, and custom Python systems. Algorithmic trading uses rules, automation, and backtesting instead of emotional decision-making.
Key Features
Mechanical, rule-based execution.
Removes emotions from trading.
Can handle high-frequency signals.
Backtesting helps refine strategies.
Popular Algo Styles
Trend-following systems.
Mean-reversion systems.
Statistical arbitrage.
Option selling with hedges.
Market-neutral strategies.
Advantages
Consistency and discipline.
Ability to trade multiple symbols simultaneously.
Works even for part-time traders.
Best Suited For
Tech-savvy traders, engineers, data scientists, or those who prefer automation over discretion.
6. BTST / STBT Trading (Buy Today, Sell Tomorrow / Sell Today, Buy Tomorrow)
BTST and STBT trading styles focus on overnight price movements influenced by global cues, economic announcements, or corporate news.
Key Features
BTST: Carry equity positions overnight to capture gap-up openings.
STBT: Mostly used in F&O due to short selling restrictions.
Trades depend on global markets—Dow, SGX NIFTY, crude oil, and currency moves.
Best Suited For
Swing traders who want to avoid intraday volatility but profit from overnight reactions.
7. Options Buying (Directional)
Options trading has exploded in India due to low capital entry and high reward potential. Directional option buyers predict sharp short-term moves.
Focus Areas
ATM/OTM calls and puts.
Breakout-based entries.
Trend days with strong momentum.
Expiry day (Thursday) trades.
Challenges
High theta decay.
Requires accuracy in direction and timing.
Best Suited For
Experienced traders who understand volatility, Greeks, and market structure.
8. Options Selling (Non-Directional or Semi-Directional)
Option selling is preferred by professional traders because it offers consistent income through premium decay.
Popular Strategies
Straddles & strangles.
Iron condor.
Bull/bear spreads.
Calendar spreads.
Advantages
High probability trades.
Beneficial during low-volume consolidations.
Risks
Requires strict hedging.
Black swan events can cause large losses.
Best Suited For
Capital-rich traders with risk-management experience.
9. Trend Following
Trend following is timeless and works well in trending markets like India. Instead of predicting tops and bottoms, trend followers ride the big wave.
Key Features
Use moving averages (20/50/200).
Enter after confirmation, not prediction.
Works extremely well in bull markets.
Requires fewer but high-quality trades.
Psychology
Trend following is simple but emotionally challenging because you must hold winners and cut losers quickly.
10. News-Based and Event Trading
Event traders focus on volatility around:
RBI policy
Budget announcements
Earnings results
Global macro events
Corporate announcements
Approach
Predict volatility, not direction.
Often uses straddles/strangles.
Fast execution is required.
Conclusion
The Indian market provides opportunities for every type of trader—from beginners to advanced professionals. Each trading style has its strengths, weaknesses, and ideal market conditions. To succeed, traders must choose a style that matches their personality, risk tolerance, time availability, and capital. Mastery comes from specialization, risk management, and continuous learning.

Part 1 Ride The Big Moves What Are Options?
Options are derivatives, which means their value is derived from an underlying asset such as stocks, indices, commodities, or currencies. In equity and index markets, options help traders speculate on price movements or protect their existing positions.
An option is essentially a contract that grants the buyer the right (but not the obligation) to buy or sell the underlying asset at a predetermined price (called the strike price) before a specific date (called the expiry).
There are two types:
Call Option – Gives the right to buy
Put Option – Gives the right to sell

XAUUSD – H4 Trend Structure Awaiting BreakoutXAUUSD – H4 Trend Structure Awaiting Breakout
Brian – Strategy to Buy on Pullback in Uptrend Channel
I. Strategy Summary
Gold continues its uptrend on H4, supported by the upward trendline from the 3,880–3,900 region.
The price is testing the resistance zone of 4,133–4,150, coinciding with the H4 supply and descending trendline, making short-term corrections likely.
Main strategy: wait for a pullback to support/FVG to buy with the trend, avoid FOMO buying at resistance.
Key levels to note: closing below 4,000 weakens the uptrend structure; below 3,884 risks shifting to a medium-term downtrend.
II. Macro Context
Unemployment Claims (weekly unemployment benefits):
Forecast: 226K
Previous: 220K
Higher-than-expected figures → indicate a weakening labor market, cooling economy, increasing the likelihood of the Fed easing sooner → real yields decrease, supporting gold.
Better-than-expected figures (lower than forecast) → support USD and bond yields, potentially causing short-term pressure on gold.
Geopolitical:
Trump's statement on easing "deadline" pressure for Russia–Ukraine negotiations ("the deadline will be when the issue is resolved") helps the market worry less about a hard deadline, but conflict risks remain. The demand for gold as a safe haven remains stable, not overly inflated but also unlikely to disappear entirely.
III. Fundamental Picture
Expectations for a rate cut cycle in 2025 continue to support gold as the market gradually prices in lower real interest rates in the medium to long term.
The demand for holding defensive assets persists amid slowing global growth and unresolved geopolitical hotspots.
In the short term, USD and US bond yields remain the two leading variables; any USD recovery can pull gold back to technical support areas, creating opportunities for buy-on-dip strategies.
IV. Technical Structure – H4 Trend Channel & FVG Zone
On H4, the price is moving within an uptrend channel, with the support trendline respected multiple times since the end of last month.
Above is the descending trendline connecting the nearest peaks, creating a price compression zone as the market approaches the 4,133–4,150 area. This is a confluence resistance zone:
The nearest swing high.
H4 supply zone.
Intersection with the descending trendline.
Notable price zones:
Resistance: 4,133–4,150 – a zone that may trigger short-term profit-taking and create a correction.
Near support/FVG: 4,078–4,080 – FVG zone combined with support after the previous breakout.
Psychological support: 4,000 – if H4 closes below this area, the uptrend structure weakens.
Medium-term reversal level: 3,884 – closing below here opens the risk of shifting entirely to a medium-term downtrend.
V. Trading Plan
Scenario 1 – Buy with the Trend (Priority)
Idea: wait for a shallow pullback to near support in the H4 uptrend channel and then buy.
Entry: 4,111–4,114
SL: 4,005
TP: 4,133 – 4,150 – 4,172 – 4,190
Scenario 2 – Buy Deep at FVG Zone
Idea: if a stronger pullback to FVG 4,078–4,080 occurs, take advantage of the good price zone to buy.
Entry: 4,078–4,080
SL: 4,073
TP: 4,100 – 4,115 – 4,142
VI. Risk Management & Notes
Limit opening new orders at the time of Unemployment Claims announcement due to potential volatility and spread widening.
If H4 closes below 4,000, reassess all current buy positions.
If H4/Daily closes below 3,884, consider the medium-term uptrend structure broken; prioritize staying out to observe or wait for a new downtrend scenario instead of continuing to look for buying points.

Candle Patterns ExplainedCandlestick patterns are one of the most powerful tools in technical analysis. They visually capture the battle between buyers and sellers and show you who is in control of the market at any moment. Each candle represents the market psychology of that particular timeframe—fear, greed, rejection, aggression, and hesitation. When you learn to read candles correctly, you understand the story behind price, not just the price itself.
A single candlestick is made up of four important points: Open, High, Low, and Close (OHLC). The body of the candle represents the distance between open and close. The wicks (also called shadows) show the highest and lowest points reached during the candle. Bullish candles close higher than they open, while bearish candles close lower than they open.
Candle patterns are broadly divided into three categories: Single-candle patterns, Double-candle patterns, and Triple-candle patterns. Each type gives different signals about trend continuation, reversal, or market indecision.

Premium Chart PatternsPremium chart patterns are advanced market structures that go beyond basic triangles, flags, and double tops. These patterns are used by experienced traders, institutional desks, and serious technical analysts to catch moves before the majority notices. What makes them “premium” is their reliability, deeper logic, and ability to identify institutional activity, liquidity traps, and major swing reversals.
While basic chart patterns rely on simple visual structures, premium patterns focus on price psychology, volume behavior, liquidity engineering, and market structure transitions. These tools help traders understand why price is moving in a certain direction—not just how it looks.

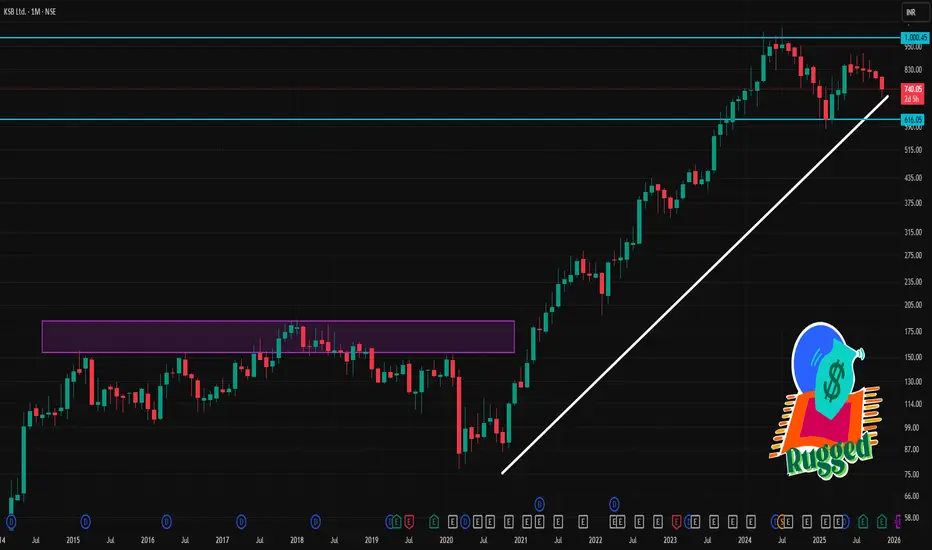
KSB 1 Month Time Frame 📊 Recent Price & Context
1. As of this week, KSB share price is trading around ₹ 740–748.
2. Over the past 1 month, the stock has seen a decline: some data suggest ~–10% to –12% monthly movement.
3. 52-week trading range: ~₹ 582 (low) to ~₹ 912 (high).
⭐ What this implies (1-Month Outlook)
Base case (neutral / consolidation): Price may hover between ₹ 702–750, possibly swinging around support-resistance zones if broader markets remain stable.
Bullish near-term bounce: If sentiment or fundamentals improve (orders, demand, sector enthusiasm), KSB could test ₹ 738–750 — a key resistance cluster.
Bearish downside: Weak macro or sector headwinds might push price toward ₹ 690, or — if broken — towards ₹ 678.
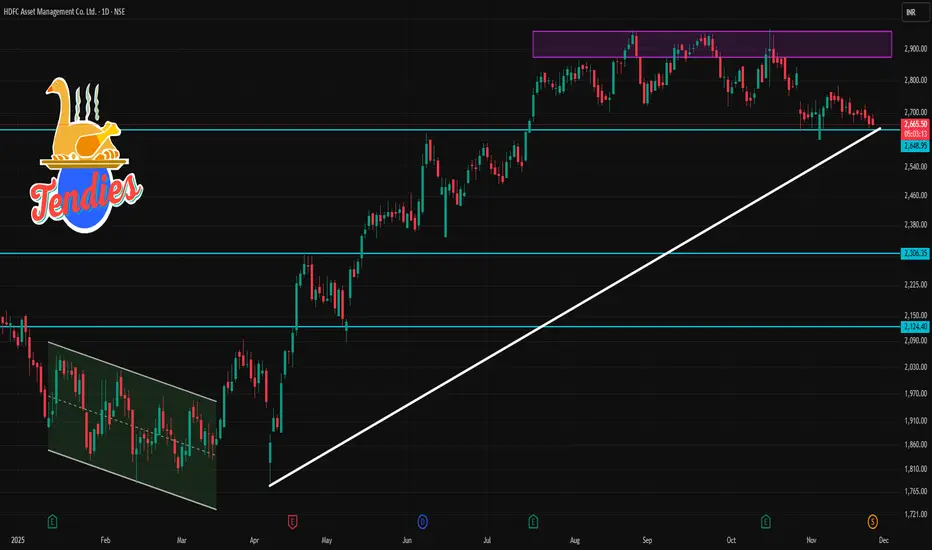
HDFCAMC 1 Day Time Frame 📊 Current Price & Context
1. Recent quoted price on several platforms is ~ ₹ 2,667 / ₹ 2,670 (on an adjusted basis, after its 1:1 bonus share issue) for HDFCAMC.
2. Historically (pre-bonus) the “old” nominal price was ~ ₹ 5,336–₹ 5,340.
3. The share is currently trading with valuation metrics: high P/E, high P/B (as per screener data) indicating it remains a premium/ high-valuation stock.
🎯 What This Means for Intraday / Short-Term Moves
If the price stays above the pivot (≈ ₹ 2,689), that suggests a short-term bullish bias; watch for a move toward the first resistance near ₹ 2,710–₹ 2,728.
If price slips below support ~₹ 2,652, the next downside targets are ₹ 2,635 then ₹ 2,614 — a break below those could open risk of further slide.
Holding above the pivot + a bounce off support (with volume) may indicate renewed upside momentum; conversely, a breakdown below support zones might suggest weakness.
⚠️ Special Context — Corporate Action Impact
The stock recently went “ex-bonus,” with a 1:1 bonus issue, meaning number of shares doubled and price was adjusted downward — which explains the division between older ₹ 5,300-plus quotes and newer ~₹ 2,600-₹ 2,700 quotes.
Because of this adjustment, comparing current technical levels with older price history needs caution — especially if referencing older support/resistance zones.
UNIONBANK 1 Week Time Frame 🔎 Current snapshot
Share price recently around ₹152.85–₹156.94.
52-week trading range: ~₹100.81 (low) to ~₹158.65 (high).
Fundamentals wise: low P/E vs peers, reasonable book value / dividend yield.
📈 Short-term (1-week) “Levels to watch”
Based on technical-forecast projections from providers:
Level type Price
Support (down-side) ~ ₹149.7
Alternate lower support ~ ₹140.0 (on a deeper dip)
Base / near-term target (if stable / slightly bullish) ~ ₹157-₹159
Upside breakout target ~ ₹162–₹165 (if momentum picks up)
Interpretation:
If price dips, ₹149–150 may act as immediate support.
On bounce or flat consolidation, ₹157-₹159 is plausible.
A clean breakout could take price toward ₹162–₹165 within a week — though that likely requires favourable macro / market mood.
