Sector Rotation Strategies in IndiaIntroduction
In the dynamic landscape of financial markets, investors constantly seek methods to outperform benchmarks and manage risks effectively. One such approach is sector rotation—a strategy that capitalizes on the natural ebb and flow of different sectors within the economy. In the Indian context, where cyclical and structural shifts frequently influence market behavior, sector rotation strategies have gained immense significance. By identifying which sectors are poised for growth and reallocating capital accordingly, investors can ride the momentum of economic cycles and maximize returns.
Sector rotation strategies are not new, but their relevance in India has grown in recent years due to rapid economic transformation, evolving government policies, and increased participation by institutional and retail investors. Understanding how to implement this strategy effectively can help both short-term traders and long-term investors optimize their portfolios.
What Is Sector Rotation?
Sector rotation refers to the practice of shifting investments from one industry sector to another based on the anticipated performance of sectors during different phases of the economic or market cycle. The core belief behind this strategy is that different sectors perform better at different times depending on economic conditions, interest rates, inflation, and government policy.
For example:
During an economic expansion, sectors like banking, infrastructure, capital goods, and consumer discretionary often outperform.
In a slowdown or recession, defensive sectors such as healthcare, FMCG (fast-moving consumer goods), and utilities tend to provide stability.
The idea is to rotate capital ahead of market trends—buying into sectors expected to outperform and exiting those likely to lag.
Economic Cycle and Sector Performance
To apply sector rotation effectively, one must understand the economic cycle, which typically consists of four stages:
Early Recovery / Expansion Phase:
The economy emerges from a slowdown.
Interest rates are low, liquidity is abundant, and corporate earnings begin to recover.
Sectors that tend to perform well: Banking, Auto, Infrastructure, Capital Goods, Metals.
Mid-Cycle (Growth Phase):
Economic activity strengthens, credit growth improves, and employment rises.
Consumer demand is high, and profits grow across industries.
Leading sectors: Technology, Consumer Discretionary, Financials.
Late-Cycle (Peak Phase):
Inflationary pressures increase, central banks may hike interest rates.
Input costs rise, margins narrow, and economic growth plateaus.
Beneficiaries: Energy, Commodities, Real Estate (short-term), while defensive sectors start gaining interest.
Recession / Slowdown Phase:
Demand slows down, earnings decline, and risk appetite decreases.
Safe-haven sectors outperform: FMCG, Healthcare, Utilities, Telecom.
Understanding these cycles and aligning sector exposure accordingly can significantly enhance portfolio returns.
Sector Rotation in the Indian Context
India’s economy is highly diverse and cyclical, influenced by factors such as monsoons, global demand, fiscal policy, and political stability. This makes it fertile ground for sector rotation strategies.
Over the past decade, India’s markets have demonstrated how different sectors come into prominence at different times:
2014–2017: A strong bull run in banking, infrastructure, and auto sectors, driven by reforms and policy push.
2018–2019: IT and FMCG sectors led due to global uncertainty and domestic consumption stability.
2020 (Pandemic): Pharmaceuticals and IT outperformed amid lockdowns.
2021–2023: A rebound in capital goods, energy, and PSU stocks, aligned with the government’s infrastructure focus.
2024–2025: Defence, renewable energy, and railways emerged as key performers.
Such patterns reflect how rotating between sectors based on macro trends can capture performance waves across cycles.
Key Drivers of Sector Rotation in India
Macroeconomic Indicators:
GDP growth, inflation, interest rates, and fiscal policies shape sector outlooks.
Example: Falling interest rates typically favor banks and real estate, while rising inflation benefits commodities and energy.
Government Policies and Budget Allocations:
The Union Budget can drastically shift sectoral fortunes.
For example, higher capital expenditure boosts infrastructure and cement, while healthcare allocations support pharma stocks.
Global Trends and Commodity Prices:
India’s dependence on global trade means commodity cycles affect sectors like metals, oil & gas, and IT (via currency movements).
Corporate Earnings Cycles:
Investors rotate toward sectors with improving earnings momentum.
Quarterly earnings season often triggers sectoral moves in Indian markets.
Technological Disruption and Innovation:
Rapid digital adoption has pushed investors toward IT, fintech, and e-commerce sectors, reflecting a long-term structural shift.
Approaches to Implement Sector Rotation
There are several ways investors can execute sector rotation strategies in India, depending on their investment horizon, risk appetite, and analytical tools.
1. Top-Down Approach
This involves analyzing the macroeconomic environment first, identifying the economic phase, and then selecting sectors likely to perform well.
Example: If the Reserve Bank of India (RBI) cuts interest rates, sectors like housing finance, auto, and banks are likely to benefit.
Tools: GDP data, inflation reports, RBI monetary policy statements.
2. Quantitative Models
Some investors use quantitative indicators such as:
Relative Strength Index (RSI) to gauge sector momentum.
Moving Averages (MA) for sector trend identification.
Sector Rotation Index (SRI) or ratio charts comparing sector indices (e.g., NIFTY IT vs. NIFTY Bank).
These methods help traders identify which sectors are gaining strength relative to the broader market.
3. Earnings Momentum and Valuation Shifts
Investors track sectors showing strong earnings upgrades and favorable valuation multiples.
For instance, analysts might rotate from overvalued IT stocks to undervalued manufacturing or PSU companies showing improving profits.
4. ETF and Mutual Fund Rotation
Investors can also rotate exposure via sectoral ETFs or mutual funds, such as:
Nippon India Pharma Fund
ICICI Prudential Infrastructure Fund
UTI Transportation and Logistics Fund
These allow diversified exposure within a targeted sector without picking individual stocks.
Practical Example of Sector Rotation in India
Let’s consider a simplified rotation from 2020 to 2025:
2020 (Pandemic Phase):
Pharma, IT, and FMCG surged due to health concerns and work-from-home trends.
2021–2022 (Recovery Phase):
Infrastructure, auto, and banking gained momentum as the economy reopened and credit demand rose.
2023 (Rising Capex and Defence Spending):
Sectors like capital goods, defence, and PSU stocks led the rally.
2024–2025 (Green Transition and Energy Shift):
Renewable energy, EVs, and power sector stocks dominated as the government pushed for sustainability and net-zero goals.
An investor following this sequence could have achieved strong portfolio performance by rotating across these themes.
Advantages of Sector Rotation
Enhanced Returns:
Capturing sectoral upswings often results in outperformance compared to passive investing.
Diversification with Focus:
While rotating sectors, investors maintain diversification but concentrate capital on high-probability opportunities.
Risk Management:
Moving away from underperforming sectors helps mitigate downside risk.
Tactical Flexibility:
Allows investors to adapt quickly to changing economic conditions or policy changes.
Alignment with Economic Reality:
This strategy mirrors real economic developments, making investment decisions more grounded in fundamentals.
Risks and Challenges
Despite its benefits, sector rotation comes with certain risks:
Timing Risk:
Identifying the correct phase of the economic cycle is challenging, and mistimed rotations can lead to underperformance.
Overtrading:
Frequent switching can increase transaction costs and reduce net returns.
False Signals:
Short-term market noise or speculative rallies may mislead investors.
Policy Uncertainty:
Sudden regulatory changes or geopolitical shocks can reverse sector trends.
Limited Data for Emerging Sectors:
Newer industries like electric vehicles or renewable energy may lack long-term performance history, complicating analysis.
Tools and Indicators for Sector Rotation
To successfully apply this strategy in Indian markets, investors often rely on:
NSE Sectoral Indices: (e.g., NIFTY Bank, NIFTY IT, NIFTY FMCG, NIFTY Infra).
Sectoral Ratio Charts: Comparing each sector index against the NIFTY 50 to spot outperformers.
Economic Indicators: RBI policy updates, inflation data, IIP (Index of Industrial Production), and fiscal budgets.
Technical Indicators: MACD crossovers, relative momentum charts, and sector breadth analysis.
Advanced investors may also use AI-based predictive models or factor-based analytics to anticipate rotation opportunities.
Sector Rotation and Institutional Activity
In India, foreign institutional investors (FIIs) and domestic institutional investors (DIIs) play a crucial role in sector rotation. Their capital inflows often dictate sectoral leadership:
When FIIs buy heavily into India, sectors like banks and IT usually lead due to global exposure.
During risk aversion phases, FIIs move to defensives like FMCG and healthcare.
Tracking institutional flow data (available on NSE or AMFI) provides valuable clues for rotation strategies.
Long-Term Structural Rotations in India
Beyond cyclical rotations, India is also witnessing structural sector shifts:
Digital Transformation: Boosting IT services, fintech, and digital platforms.
Manufacturing and Defence: Driven by “Make in India” and self-reliance initiatives.
Renewable Energy & EVs: Supported by green transition policies.
Consumer Upgradation: Growing middle-class demand benefiting retail, luxury goods, and financial services.
Investors combining cyclical and structural perspectives can enjoy both short-term alpha and long-term wealth creation.
Conclusion
Sector rotation strategies in India represent a powerful yet disciplined approach to navigating the complexities of the stock market. By understanding economic cycles, policy dynamics, and sectoral interrelationships, investors can tactically position themselves in outperforming industries while minimizing exposure to laggards.
While this approach demands active monitoring, analytical rigor, and timing precision, it offers immense potential in a fast-evolving economy like India’s. Whether through direct stock selection or via sectoral funds and ETFs, a well-executed sector rotation strategy can enhance portfolio performance, protect capital in downturns, and align investments with the pulse of India’s economic transformation.
Trend Lines

Essential Infrastructure Investment The Foundation of Sustainable Growth
Infrastructure is the backbone of any modern economy. It encompasses the fundamental systems and facilities that support a nation's economic and social well-being, such as transportation networks, energy grids, communication systems, water supply, and social amenities like healthcare and education. Investment in essential infrastructure is not merely a financial commitment; it is an investment in the future prosperity, resilience, and inclusivity of a society. In the 21st century, as global economies face the challenges of urbanization, climate change, technological transformation, and population growth, infrastructure investment has become more crucial than ever.
1. Understanding Essential Infrastructure Investment
Essential infrastructure investment refers to the allocation of capital and resources toward the development, maintenance, and modernization of basic systems that ensure the smooth functioning of an economy. These investments can be made by governments, private entities, or through public-private partnerships (PPPs). The goal is to provide long-term value by improving efficiency, connectivity, productivity, and quality of life.
Infrastructure investment can be divided into several categories:
Economic Infrastructure – Transport (roads, railways, ports, airports), energy (power plants, transmission grids), telecommunications, and water management.
Social Infrastructure – Education facilities, healthcare systems, housing, and public safety institutions.
Digital Infrastructure – Internet connectivity, data centers, cybersecurity systems, and smart city frameworks.
Green Infrastructure – Renewable energy installations, sustainable waste management, and climate-resilient urban planning.
Each category plays a vital role in creating a foundation upon which economies can grow and societies can thrive.
2. The Importance of Infrastructure Investment
The significance of investing in infrastructure can be seen from multiple dimensions — economic, social, and environmental.
a. Economic Growth and Productivity
Infrastructure fuels economic expansion by facilitating trade, mobility, and industrial development. Efficient transportation systems reduce logistics costs and time, while reliable energy supply enhances industrial output. The World Bank estimates that every 1% increase in infrastructure spending can increase GDP growth by up to 2%. Moreover, infrastructure investments generate employment opportunities during both construction and operational phases, creating a multiplier effect across various sectors.
b. Enhancing Competitiveness
Nations with advanced infrastructure attract more domestic and foreign investments. Investors are drawn to regions with reliable electricity, transport connectivity, and digital systems. For instance, well-developed logistics networks lower production costs, improving global competitiveness. This is why emerging economies like India, Indonesia, and Vietnam have prioritized infrastructure modernization to attract manufacturing and service industries.
c. Reducing Regional Inequality
Infrastructure investments can bridge regional development gaps. By improving access to transportation, communication, and education, remote areas can become economically viable. This inclusivity promotes social stability and reduces urban overcrowding. For example, rural electrification projects in Africa and Asia have dramatically improved agricultural productivity and small business growth.
d. Promoting Environmental Sustainability
Green infrastructure investments in renewable energy, waste management, and sustainable transport reduce carbon emissions and combat climate change. Building climate-resilient infrastructure — such as flood-resistant roads or water recycling systems — ensures long-term sustainability. The global push for “net-zero” emissions has made green infrastructure an essential pillar of modern economic strategy.
e. Enhancing Quality of Life
Reliable infrastructure ensures access to clean water, healthcare, and education — fundamental human rights that underpin a decent standard of living. Smart city initiatives and digital infrastructure enhance safety, convenience, and access to public services, improving the overall quality of life.
3. Key Sectors of Essential Infrastructure Investment
a. Transportation Infrastructure
Transportation is the lifeblood of commerce. Roads, highways, ports, airports, and railways connect producers to markets and people to opportunities. Countries that invest in integrated transport systems experience enhanced trade efficiency and reduced costs. For instance, China’s Belt and Road Initiative (BRI) demonstrates how massive transport infrastructure investments can foster international connectivity and trade growth.
b. Energy Infrastructure
Energy is critical for industrial development, urbanization, and modern living. Investment in power generation, transmission, and distribution systems ensures reliable access to electricity. With the shift toward renewable energy sources like solar, wind, and hydroelectric power, the energy sector has become a hotspot for sustainable infrastructure investment. Smart grids and battery storage technologies are transforming how energy is produced, stored, and consumed.
c. Water and Sanitation Systems
Water infrastructure ensures the availability and quality of water for consumption, agriculture, and industry. Investments in desalination plants, irrigation networks, and wastewater treatment facilities improve public health and agricultural productivity. Poor water infrastructure, conversely, can lead to water scarcity, disease outbreaks, and economic inefficiencies.
d. Digital Infrastructure
In the digital era, connectivity is as crucial as physical roads and bridges. High-speed internet, 5G networks, data centers, and cybersecurity systems form the backbone of digital economies. Nations investing in digital infrastructure experience exponential growth in e-commerce, fintech, and information technology sectors. For example, the expansion of broadband networks in India has empowered millions of small businesses and enabled remote education and telemedicine services.
e. Social Infrastructure
Education and healthcare facilities form the foundation of human capital development. Investments in schools, universities, and hospitals ensure a healthy, skilled workforce capable of sustaining long-term economic growth. Modern social infrastructure integrates technology — such as telehealth and online learning platforms — to increase access and efficiency.
4. Funding Models for Infrastructure Investment
Infrastructure projects require massive capital outlays, often running into billions of dollars. Several funding models exist to mobilize these resources:
Public Financing: Governments allocate budgetary resources or issue bonds to finance infrastructure projects. This model ensures public ownership but can strain fiscal budgets.
Public-Private Partnerships (PPPs): A collaborative model where private investors finance, build, and operate infrastructure projects while sharing risks and returns with the government. PPPs have been widely successful in transport and energy projects worldwide.
Private Financing: Large institutional investors, such as pension funds and sovereign wealth funds, often invest in infrastructure for long-term stable returns.
Multilateral and Development Banks: Institutions like the World Bank, Asian Infrastructure Investment Bank (AIIB), and IMF provide financing, guarantees, and technical assistance for infrastructure development in emerging economies.
5. Challenges in Infrastructure Investment
Despite its importance, infrastructure investment faces several challenges:
a. Financing Gaps
The global infrastructure financing gap is estimated at over $15 trillion by 2040. Many developing nations struggle to attract sufficient capital due to fiscal constraints, political instability, or lack of investor confidence.
b. Regulatory and Bureaucratic Hurdles
Complex approval processes, land acquisition disputes, and corruption can delay projects and escalate costs. Transparent governance and streamlined regulatory frameworks are essential for project success.
c. Technological Obsolescence
With rapid technological advancement, infrastructure systems can quickly become outdated. Therefore, investments must incorporate flexibility and scalability to adapt to new technologies.
d. Environmental and Social Concerns
Large infrastructure projects can have negative environmental and social impacts, such as displacement, deforestation, or pollution. Sustainable and inclusive planning is necessary to minimize such effects.
e. Maintenance and Lifecycle Costs
Many countries focus on building new infrastructure but neglect maintenance, leading to deterioration and inefficiency. Regular upkeep and modernization are vital to maximize the lifespan of assets.
6. Emerging Trends in Infrastructure Investment
a. Green and Sustainable Infrastructure
Governments and investors are increasingly prioritizing projects that align with environmental, social, and governance (ESG) principles. Renewable energy, electric vehicle infrastructure, and sustainable housing are at the forefront of this shift.
b. Smart Infrastructure
Integration of technology such as AI, IoT, and big data enables “smart” infrastructure — intelligent systems that monitor, manage, and optimize resources in real time. Smart grids, smart transportation systems, and smart cities represent the future of infrastructure investment.
c. Resilient Infrastructure
With climate risks on the rise, resilience has become a key investment criterion. Infrastructure must withstand extreme weather events, earthquakes, and other disruptions to ensure continuity of essential services.
d. Inclusive and Equitable Infrastructure
There is growing recognition of the need for infrastructure that benefits all citizens, including marginalized and rural populations. Inclusive planning ensures equal access and opportunity, supporting social cohesion.
e. Digital Transformation
Digitalization is redefining infrastructure priorities. Governments are investing in 5G, cloud computing, and cybersecurity to build the foundation for data-driven economies.
7. Case Studies: Successful Infrastructure Investments
a. Singapore
Singapore’s meticulous planning and heavy investment in infrastructure have made it one of the most efficient and competitive economies in the world. Its integrated transport systems, advanced digital infrastructure, and world-class port facilities are models for global best practices.
b. India’s Infrastructure Push
India’s National Infrastructure Pipeline (NIP) and initiatives like Gati Shakti aim to modernize transportation, logistics, and energy networks. The focus on renewable energy, highways, and digital connectivity has significantly improved economic efficiency.
c. Europe’s Green Deal
The European Union’s Green Deal allocates billions toward clean energy, sustainable transport, and digital transformation. This initiative exemplifies how infrastructure investment can drive both economic growth and environmental protection.
8. The Future of Infrastructure Investment
The future of infrastructure investment lies in integration, innovation, and inclusivity. As the world becomes more interconnected, the boundaries between physical and digital infrastructure are blurring. Future investments will emphasize:
Carbon-neutral projects and green financing,
AI-driven urban management systems,
Sustainable public transport and energy systems,
Cross-border infrastructure cooperation.
Governments, investors, and international institutions must collaborate to close the global infrastructure gap while ensuring social and environmental responsibility.
9. Conclusion
Essential infrastructure investment is more than building roads, bridges, or power plants — it is about constructing the framework for human progress. It fosters economic growth, reduces inequality, enhances resilience, and improves quality of life. As the world faces mounting challenges from climate change, digital disruption, and population pressures, strategic and sustainable infrastructure investment will determine which nations thrive in the decades ahead.
In essence, investing in infrastructure is investing in the foundation of civilization itself — ensuring that societies remain connected, productive, and prepared for the future.
Will only gp long if sustains above 26000 level!As we can see NIFTY recovered sharply but managed to close below 26000 which is a strong supply zone. Moreover, we analysed in our previous post that we may see short term retracement towards upside and we did see that today. Now, we will only think of going long if sustains above 26000-26100 level until that every rise can be shorted for 25500 so plan your trades accordingly and keep watching everyone
XAUUSD Analysis - Levels and Pridiction#Gold (XAU/USD) Technical Analysis - October 27, 2025
Current Market Status: Retracement on Higher Time Frame,
Lower Timeframe Bearish Breakdown⚠️
Gold is trading at 4,033.67, having broken down from the previous #consolidation zone. The market has violated key support levels and is now showing clear bearish momentum with multiple technical confirmations.
Critical Technical Developments:
1️⃣ Triangle Pattern Breakdown (1H Chart)
The 1-hour chart reveals a confirmed triangle #pattern breakout to the downside. After breaking below the triangle support, price attempted a retest of the breakdown level around 4,093-4,144 but was rejected, confirming the pattern's validity. This is a classic bearish continuation signal.
2️⃣ Demand Zone Invalidation
A crucial demand level that previously held multiple tests has now been completely invalidated. The chart explicitly notes: "Demand Level to be invalidated to move the Price Further Down" - this condition has been met, opening the path for deeper downside movement.
3️⃣ Minor Trend Shift Level Breach
Price has broken below the **Minor Trend Shift Level** at approximately 4,093, confirming a shift from bullish to bearish short-term structure. This level now acts as resistance.
Target Zones (High Probability):
🎯 Immediate Targets:
- 3,945 - Next support cluster (current proximity)
- 3,845 - 0.5 Fibonacci retracement level (PRIMARY TARGET)
- 3,719 - 0.618 Fibonacci retracement level (EXTENDED TARGET)
The Fibonacci levels in green boxes, are the key magnetic zones for price action.
📉 Bearish Continuation (70% Probability)
Price continues lower toward 3,845, potentially extending to 3,719 if selling pressure intensifies. This move would represent a healthy correction within the broader uptrend from the yearly lows.
📈 Bullish Reversal (30% Probability)
Requires reclaiming 4,144 with strong momentum AND holding above it on daily timeframe. Only then would the bearish structure be invalidated.
Conclusion:
Gold remains in a confirmed downtrend on lower timeframes with clear downside targets visible. The invalidation of demand zones and triangle breakdown provide strong bearish confirmation. Traders should focus on the 3,845-3,719 zone as the primary area of interest for potential reversal setups. Until price reclaims 4,150+, the path of least resistance remains **DOWN**.
Risk Management: Use proper position sizing as volatility remains elevated. The 3,845 level will be crucial - watch for buyer reaction there.

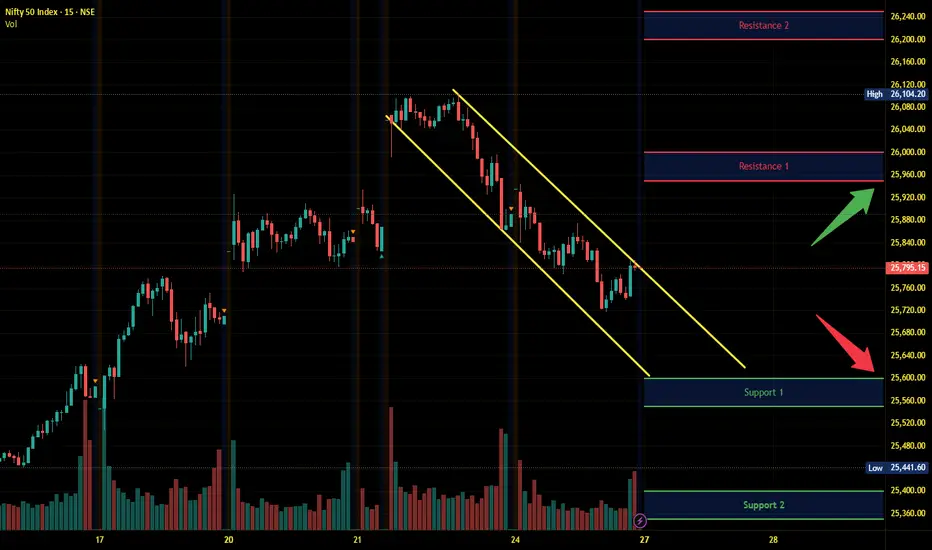
Nifty Intraday Analysis for 27th October 2025NSE:NIFTY
Index has resistance near 25950 – 26000 range and if index crosses and sustains above this level then may reach near 26200 – 26250 range.
Nifty has immediate support near 25600 – 25550 range and if this support is broken then index may tank near 25400 – 25350 range.
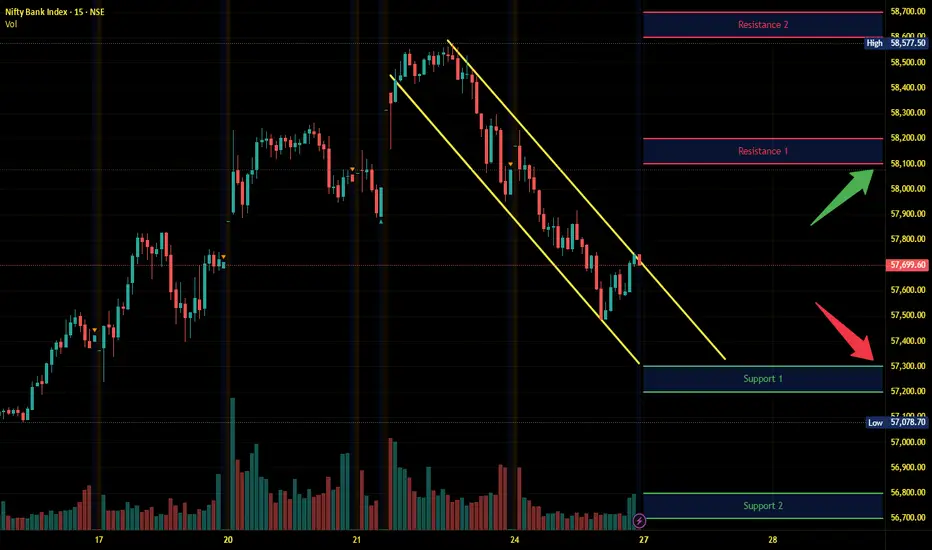
Banknifty Intraday Analysis for 27th October 2025NSE:BANKNIFTY
Index has resistance near 58100 – 58200 range and if index crosses and sustains above this level then may reach near 58600 – 58700 range.
Banknifty has immediate support near 57200 - 57100 range and if this support is broken then index may tank near 56800 - 56700 range.
Finnifty Intraday Analysis for 27th October 2025 NSE:CNXFINANCE
Index has resistance near 27550 - 27600 range and if index crosses and sustains above this level then may reach near 27750 - 27800 range.
Finnifty has immediate support near 27200– 27150 range and if this support is broken then index may tank near 27000 – 26950 range.

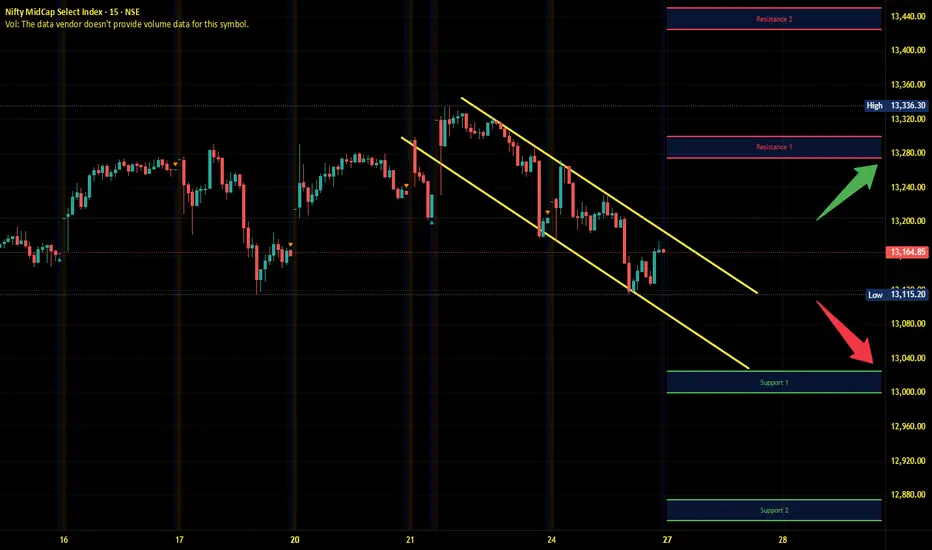
Midnifty Intraday Analysis for 27th October 2025NSE:NIFTY_MID_SELECT
Index has immediate resistance near 13275 – 13300 range and if index crosses and sustains above this level then may reach 13425 – 13450 range.
Midnifty has immediate support near 13025 – 13000 range and if this support is broken then index may tank near 12875 – 12850 range.
[XAUUSD] New Week Scenario: Accumulation Awaiting Drop New Week Scenario: Accumulation Awaiting Drop - Watch for Selling at Liquidity Zone $4195
Hello traders community,
The new week begins with XAUUSD (Gold) being "restrained" in a sideways structure. However, don't let this calm deceive you. Technically, this is an accumulation pattern with a clear bearish bias.
The market is in "wait" mode, and patience will be the key to catching the next big wave.
📰 MACRO ANALYSIS: TUG OF WAR AHEAD OF FOMC
The market is caught between two opposing streams of information:
Bearish Pressure: Positive signs of a US-China trade deal are reducing the demand for safe-haven assets, putting pressure on Gold prices.
Bullish Support: The weakening USD due to expectations that the Fed will continue to cut interest rates, inadvertently provides some short-term support for the precious metal.
Decisive Factor: Traders are "lying low" waiting for this week's two-day monetary policy meeting (FOMC). This will be the main event, determining the medium-term trend of USD and Gold.
📊 TECHNICAL ANALYSIS: CONTINUATION OF BEARISH STRUCTURE
The H1 chart shows a very clear "Sell" scenario:
Price Structure: After a strong drop from the peak, the price is moving sideways in an accumulation pattern of a bearish pennant. This is a continuation structure, indicating that the Sellers are "resting" before pushing the price further down.
Ideal Sell Zone: The $4195 zone is an extremely strong resistance confluence, marked as "Liquidity strong" on the chart.
This is the 0.5 Fibonacci level, the "golden" retracement point of the entire previous decline.
This is the old support zone now turned into new resistance.
Optimal Scenario: We will wait for the price to pull back to test the $4195 liquidity zone. This is an opportunity for Sellers to enter the market with low risk and high profit potential.
🎯 TRADING PLAN (SELL SETUP)
Absolute priority is to Watch for Selling (Sell) in line with the main trend.
ENTRY (Sell): $4195
STOP LOSS: $4205
TAKE PROFIT: TP1: $4168-TP2: $4145-TP3: $4122-TP4: $4102
SUMMARY
In the context of the market awaiting FOMC news, Gold is likely to make a final "pullback" to the $4195 zone before continuing its downtrend. Be patient and wait for signals at this ideal sell zone.
Wishing traders a successful and disciplined new trading week!

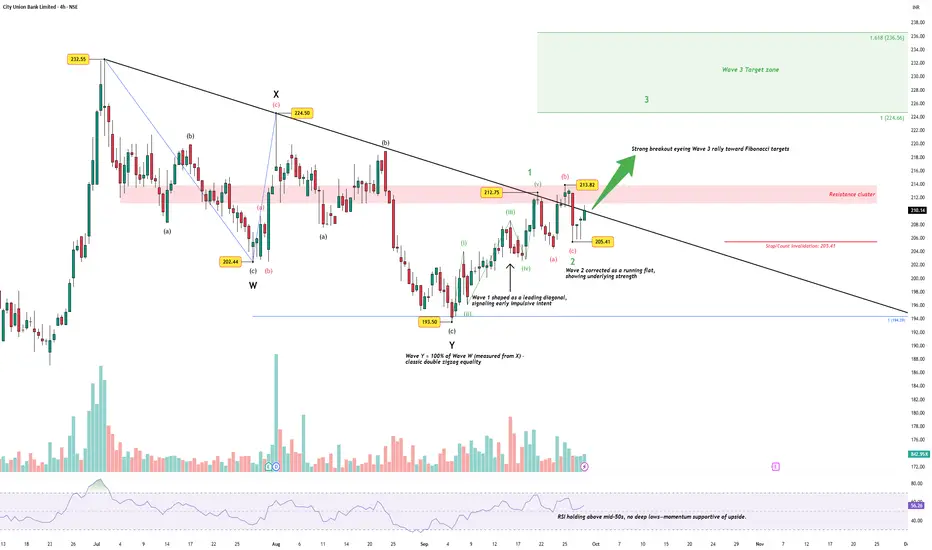
City Union Bank – Tight Stop, Wave 3 Setup in PlayDisclaimer: This analysis is for educational purposes only and does not constitute investment advice. Please do your own research (DYOR) before making any trading decisions.
Elliott Wave Setup
City Union Bank has completed a W–X–Y double zigzag correction into 193.50, with Wave Y equaling Wave W — a classic case of corrective symmetry. From that low:
Wave 1 unfolded as a leading diagonal.
Wave 2 corrected as a running flat, showing underlying strength.
Price is now attempting a breakout, suggesting Wave 3 is underway.
The stop-loss / invalidation is clear: 205.41 , the Wave 2 low. This creates a textbook tight-risk entry point.
Why Wave 3 Matters
Wave 3 in Elliott theory is often the strongest, most extended move. Early signs support this potential:
RSI is holding above mid-50s without new lows → momentum remains bullish.
Volume has dried up during correction but is starting to expand with breakout attempts.
Target zone : 224.6 → 236.5 (1.0–1.618 Fib extensions of Wave 1).
Immediate challenge lies at the 212–214 resistance cluster. A clean break above confirms acceleration.
Trading the Setup
Tight stop: below 205.41.
Potential reward: 20–25 points higher.
Risk/Reward: exactly what traders look for in a Wave 3 entry.
For readers, the bigger lesson is how Elliott Wave provides natural stop placement. By respecting Wave 2 lows, traders can define risk precisely and be positioned for the explosive Wave 3 rally.
The Takeaway
This is not just a bullish call on City Union Bank. It’s a case study in EW discipline:
Use Wave 2 lows as invalidation.
Look for Wave 3 to deliver the reward.
Enter with conviction only when structure + momentum align.
IRB trendline breakout on support level1. trendline breakout on support level
2. Inverse head and shoulder pattern on support level
3. good for swing upside movement

Is the SPX500 Correction OVER ?Analysed 1Hr chart:
SPX 500 is correcting from around FEB 25th
It has has been correcting in complex ABC pattern
Within last Leg that is C, it has been doing W-X-Y correction.
Will it have one more Z leg ?
YES : If it retraces/does not cross previous high
When this structure will be invalid ?
When a hourly close is below 5096.
What is the road map if the current structure holds good ?
Wave-3 ~6000
Wave-4 Correction , back to 5500 ??
Wave-5 ~6200
Assumption: It follows plotted channel
Times/Shape of pattern will get extended if time correction follows.

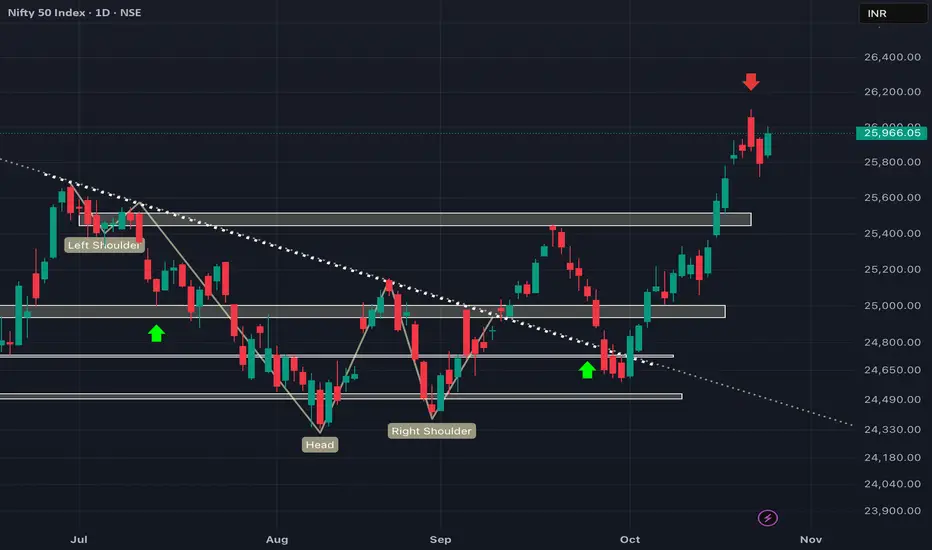
NIFTY heading towards 25500!!As we can see NIFTY started showing rejection exactly from 26000 level which is also a psychological level and had been falling unidirectionally ever since. Further we can't see any eminent SUPPORT but minor supports can be seen on previous swings around 25700 hence despite being weak, we may see temporary green candles for few trading sessions before finally falling towards 25500 levels which is its next psychological level and important SUPPORT and any signs of REVERSAL from this zone can show massive upside so plan your trades accordingly and keep watching everyone.

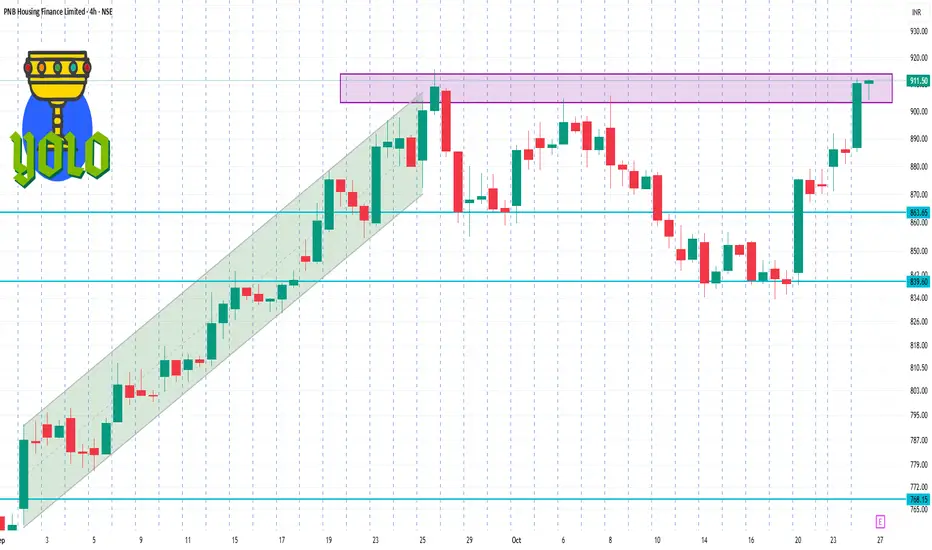
PNBHOUSING 4 Hour Time Frame PNB Housing Finance Ltd is trading at ₹907.30, reflecting a 2.68% increase from the previous close.
📊 Key Support and Resistance Levels
Support Levels: ₹885.15 (recent low), ₹826.72 (Super Trend level).
Resistance Levels: ₹912.15 (recent high), ₹1,141.90 (52-week high).
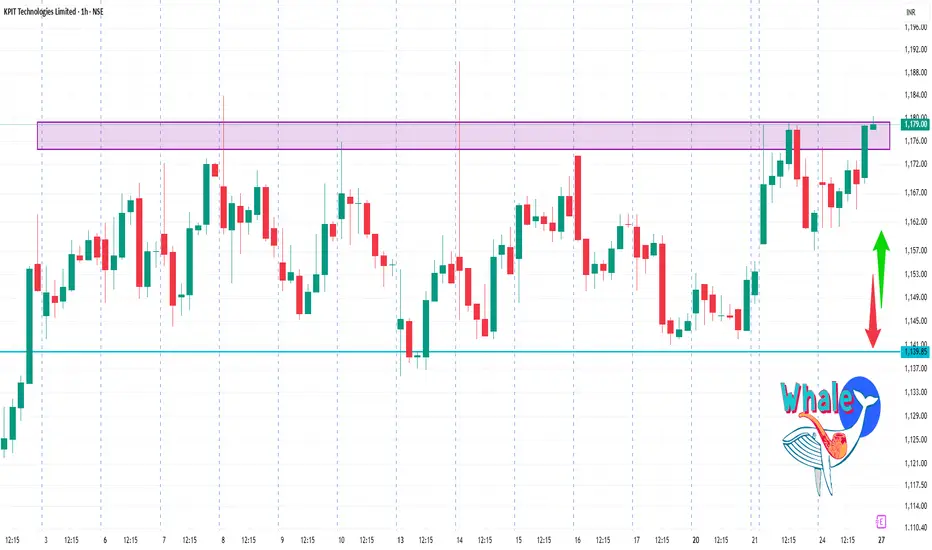
KPITTECH 1 Hour Time Frame 📈 Current Price Overview
Latest Price: ₹1,178.70
Day’s Range: ₹1,161.00 – ₹1,180.40
50-Day Moving Average (DMA): ₹1,206.21
200-Day Moving Average (DMA): Data not specified
PREMIERENE 1 Week Time Frame Key Weekly Metrics:
Opening Price (Oct 20): ₹1,052.00
Closing Price (Oct 24): ₹1,070.70
Weekly High: ₹1,080.70
Weekly Low: ₹1,003.70
Average Price: ₹1,036.22

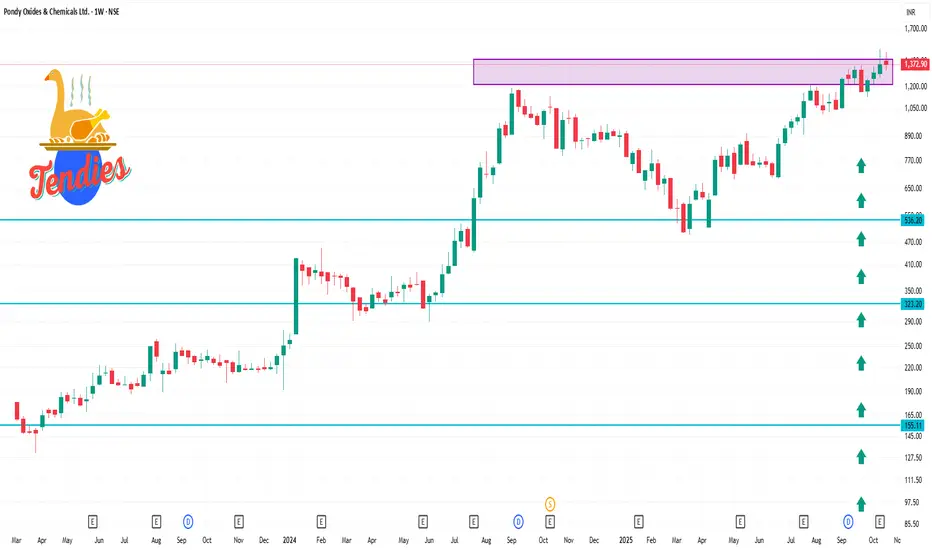
POCL 1 Week Time Frame🔍 Technical Highlights
52-Week Range: ₹490.00 – ₹1,507.05
Current Price: ₹1,372.90
Beta: -0.68, indicating lower volatility compared to the market
Relative Strength Index (RSI): 59.08, suggesting the stock is neither overbought nor oversold
50-Day Moving Average: ₹1,222.79
200-Day Moving Average: ₹886.54
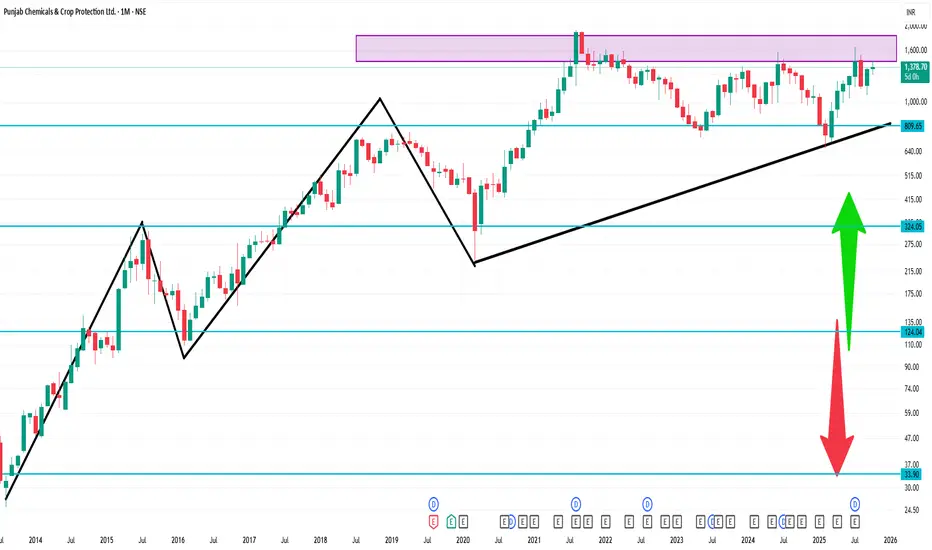
PUNJABCHEM 1 Month Time Frame 📈 1-Month Price Range (September 24 – October 24, 2025)
High: ₹1,407.50 on October 17
Low: ₹1,320.30 on October 14
Closing on October 24: ₹1,378.70
📊 Summary
Over the past month, PUNJABCHEM has experienced a decline, trading within a range of ₹1,320.30 to ₹1,407.50. Technical indicators suggest a bearish trend, with the stock trading below key moving averages and a negative MACD. However, the low RSI indicates potential for a rebound if buying interest returns.
CHOLAFIN 1 Day Time Frame 📊 Current Snapshot
Latest closing around ₹1,733.60 on 24 Oct 2025.
Day’s range on that date: high ~ ₹1,752.70, low ~ ₹1,678.10.
52-week range: ~ ₹1,168 (low) to ~ ₹1,708 (high) as per latest data.

KOTAKBANK 1 Month Time Frame 📊 Recent Price & Trend Snapshot
Current approximate price: ₹2,187 (as of 24 Oct 2025)
52-week high / low: ~ ₹2,301.90 / ~ ₹1,679.05
1-month return: positive, ~ +7.7% (per one source)
On technical indicators: Many moving averages suggest price is above key averages, which is a bullish bias in the short term. E.g., moving averages show “Buy” signals (MA5-MA200) on one checklist.

HFCL Cmp 77.74 Ascending Triangle PatternHFCL Cmp 77.74 Dated 24-10-2025
1. Ascending Triangle Pattern BO @ 79
Buy @ Cmp for riskers trades
Safe traders buy above 79 SL 75 target 80-81-83-84-85-87-88-89
It is just a view, please trade at your own risk.

BUY TODAY SELL TOMORROW for 5%DON’T HAVE TIME TO MANAGE YOUR TRADES?
- Take BTST trades at 3:25 pm every day
- Try to exit by taking 4-7% profit of each trade
- SL can also be maintained as closing below the low of the breakout candle
Now, why do I prefer BTST over swing trades? The primary reason is that I have observed that 90% of the stocks give most of the movement in just 1-2 days and the rest of the time they either consolidate or fall
Trendline Breakout in SAMMAANCAP
BUY TODAY SELL TOMORROW for 5%
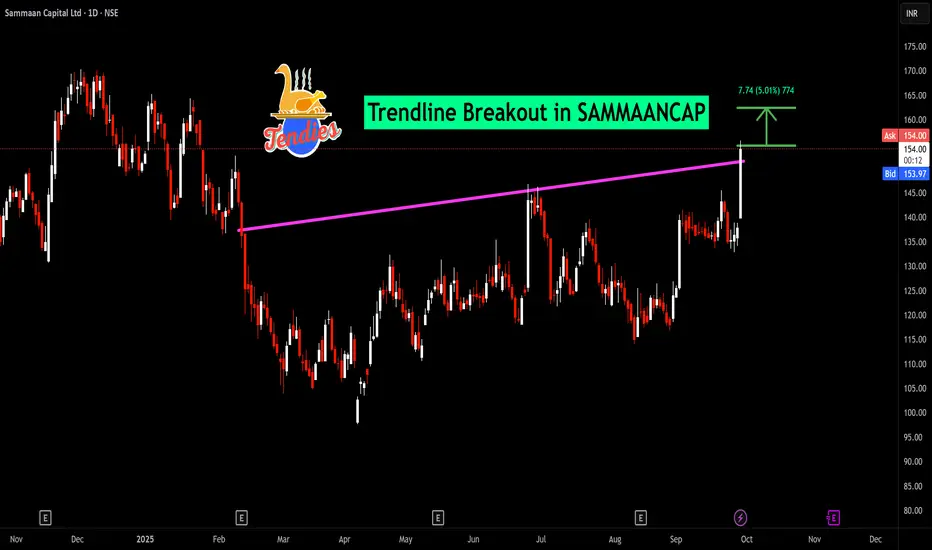
BUY TODAY SELL TOMORROW for 5%DON’T HAVE TIME TO MANAGE YOUR TRADES?
- Take BTST trades at 3:25 pm every day
- Try to exit by taking 4-7% profit of each trade
- SL can also be maintained as closing below the low of the breakout candle
Now, why do I prefer BTST over swing trades? The primary reason is that I have observed that 90% of the stocks give most of the movement in just 1-2 days and the rest of the time they either consolidate or fall
Trendline Breakout in IDEA
BUY TODAY SELL TOMORROW for 5%
