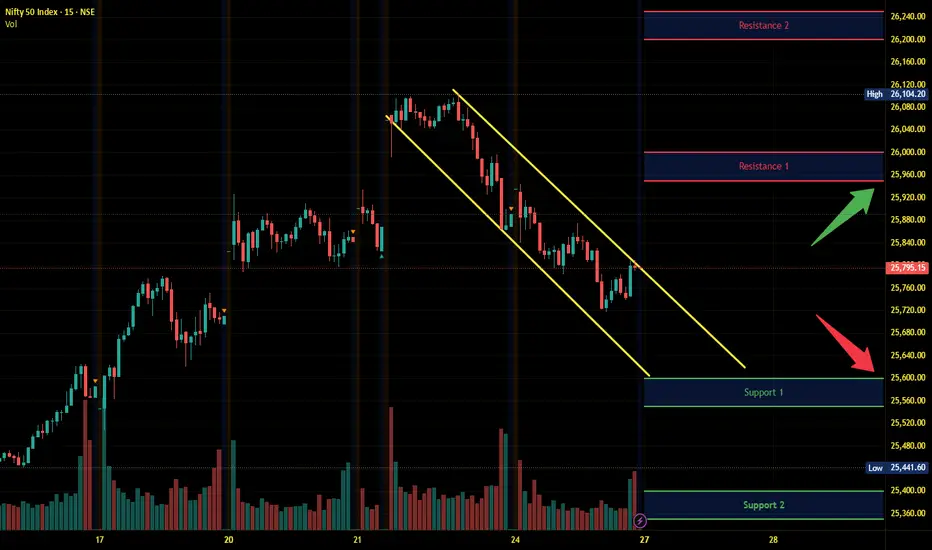
Nifty Intraday Analysis for 27th October 2025NSE:NIFTY
Index has resistance near 25950 – 26000 range and if index crosses and sustains above this level then may reach near 26200 – 26250 range.
Nifty has immediate support near 25600 – 25550 range and if this support is broken then index may tank near 25400 – 25350 range.
Trend Lines
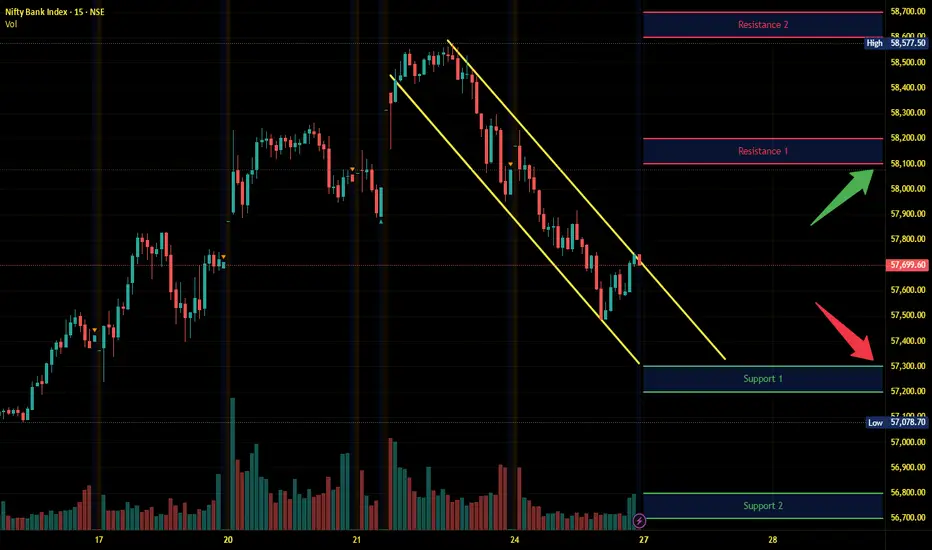
Banknifty Intraday Analysis for 27th October 2025NSE:BANKNIFTY
Index has resistance near 58100 – 58200 range and if index crosses and sustains above this level then may reach near 58600 – 58700 range.
Banknifty has immediate support near 57200 - 57100 range and if this support is broken then index may tank near 56800 - 56700 range.
Finnifty Intraday Analysis for 27th October 2025 NSE:CNXFINANCE
Index has resistance near 27550 - 27600 range and if index crosses and sustains above this level then may reach near 27750 - 27800 range.
Finnifty has immediate support near 27200– 27150 range and if this support is broken then index may tank near 27000 – 26950 range.

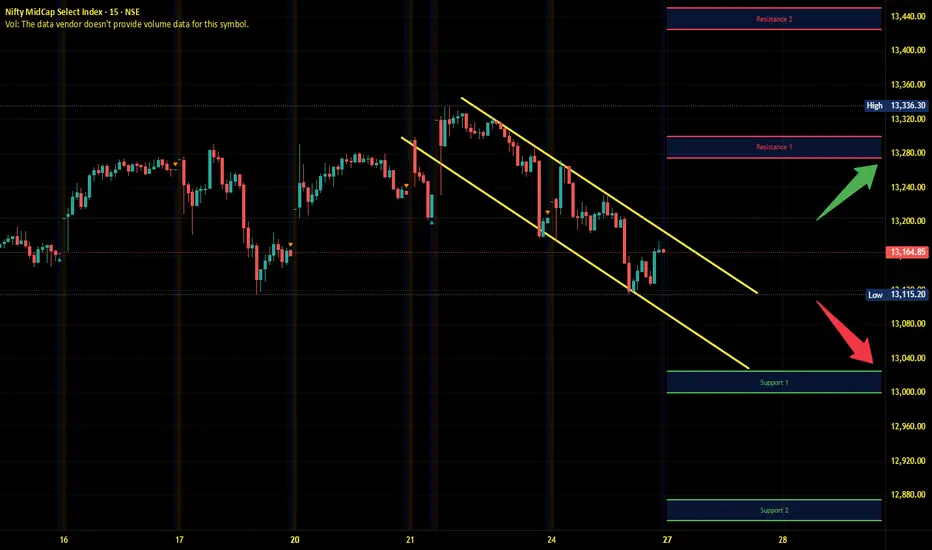
Midnifty Intraday Analysis for 27th October 2025NSE:NIFTY_MID_SELECT
Index has immediate resistance near 13275 – 13300 range and if index crosses and sustains above this level then may reach 13425 – 13450 range.
Midnifty has immediate support near 13025 – 13000 range and if this support is broken then index may tank near 12875 – 12850 range.
[XAUUSD] New Week Scenario: Accumulation Awaiting Drop New Week Scenario: Accumulation Awaiting Drop - Watch for Selling at Liquidity Zone $4195
Hello traders community,
The new week begins with XAUUSD (Gold) being "restrained" in a sideways structure. However, don't let this calm deceive you. Technically, this is an accumulation pattern with a clear bearish bias.
The market is in "wait" mode, and patience will be the key to catching the next big wave.
📰 MACRO ANALYSIS: TUG OF WAR AHEAD OF FOMC
The market is caught between two opposing streams of information:
Bearish Pressure: Positive signs of a US-China trade deal are reducing the demand for safe-haven assets, putting pressure on Gold prices.
Bullish Support: The weakening USD due to expectations that the Fed will continue to cut interest rates, inadvertently provides some short-term support for the precious metal.
Decisive Factor: Traders are "lying low" waiting for this week's two-day monetary policy meeting (FOMC). This will be the main event, determining the medium-term trend of USD and Gold.
📊 TECHNICAL ANALYSIS: CONTINUATION OF BEARISH STRUCTURE
The H1 chart shows a very clear "Sell" scenario:
Price Structure: After a strong drop from the peak, the price is moving sideways in an accumulation pattern of a bearish pennant. This is a continuation structure, indicating that the Sellers are "resting" before pushing the price further down.
Ideal Sell Zone: The $4195 zone is an extremely strong resistance confluence, marked as "Liquidity strong" on the chart.
This is the 0.5 Fibonacci level, the "golden" retracement point of the entire previous decline.
This is the old support zone now turned into new resistance.
Optimal Scenario: We will wait for the price to pull back to test the $4195 liquidity zone. This is an opportunity for Sellers to enter the market with low risk and high profit potential.
🎯 TRADING PLAN (SELL SETUP)
Absolute priority is to Watch for Selling (Sell) in line with the main trend.
ENTRY (Sell): $4195
STOP LOSS: $4205
TAKE PROFIT: TP1: $4168-TP2: $4145-TP3: $4122-TP4: $4102
SUMMARY
In the context of the market awaiting FOMC news, Gold is likely to make a final "pullback" to the $4195 zone before continuing its downtrend. Be patient and wait for signals at this ideal sell zone.
Wishing traders a successful and disciplined new trading week!

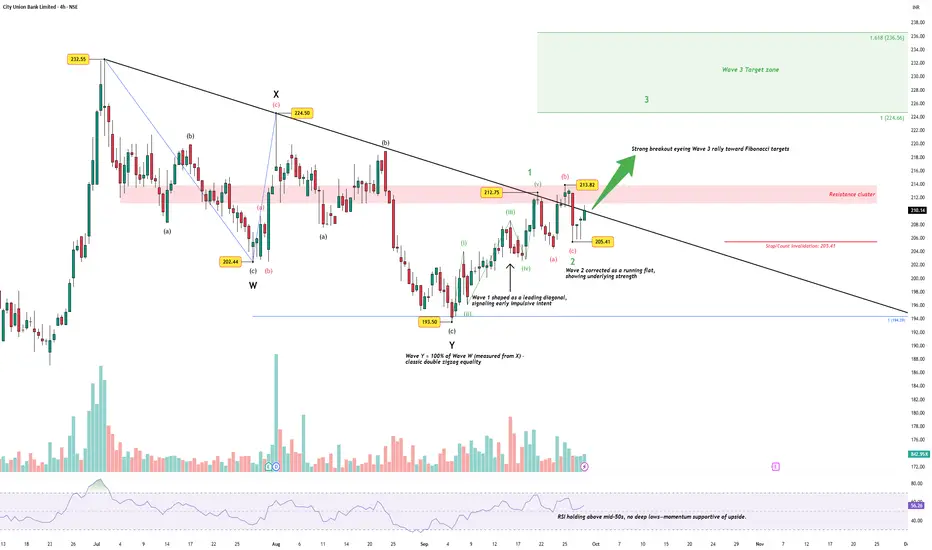
City Union Bank – Tight Stop, Wave 3 Setup in PlayDisclaimer: This analysis is for educational purposes only and does not constitute investment advice. Please do your own research (DYOR) before making any trading decisions.
Elliott Wave Setup
City Union Bank has completed a W–X–Y double zigzag correction into 193.50, with Wave Y equaling Wave W — a classic case of corrective symmetry. From that low:
Wave 1 unfolded as a leading diagonal.
Wave 2 corrected as a running flat, showing underlying strength.
Price is now attempting a breakout, suggesting Wave 3 is underway.
The stop-loss / invalidation is clear: 205.41 , the Wave 2 low. This creates a textbook tight-risk entry point.
Why Wave 3 Matters
Wave 3 in Elliott theory is often the strongest, most extended move. Early signs support this potential:
RSI is holding above mid-50s without new lows → momentum remains bullish.
Volume has dried up during correction but is starting to expand with breakout attempts.
Target zone : 224.6 → 236.5 (1.0–1.618 Fib extensions of Wave 1).
Immediate challenge lies at the 212–214 resistance cluster. A clean break above confirms acceleration.
Trading the Setup
Tight stop: below 205.41.
Potential reward: 20–25 points higher.
Risk/Reward: exactly what traders look for in a Wave 3 entry.
For readers, the bigger lesson is how Elliott Wave provides natural stop placement. By respecting Wave 2 lows, traders can define risk precisely and be positioned for the explosive Wave 3 rally.
The Takeaway
This is not just a bullish call on City Union Bank. It’s a case study in EW discipline:
Use Wave 2 lows as invalidation.
Look for Wave 3 to deliver the reward.
Enter with conviction only when structure + momentum align.
IRB trendline breakout on support level1. trendline breakout on support level
2. Inverse head and shoulder pattern on support level
3. good for swing upside movement

Is the SPX500 Correction OVER ?Analysed 1Hr chart:
SPX 500 is correcting from around FEB 25th
It has has been correcting in complex ABC pattern
Within last Leg that is C, it has been doing W-X-Y correction.
Will it have one more Z leg ?
YES : If it retraces/does not cross previous high
When this structure will be invalid ?
When a hourly close is below 5096.
What is the road map if the current structure holds good ?
Wave-3 ~6000
Wave-4 Correction , back to 5500 ??
Wave-5 ~6200
Assumption: It follows plotted channel
Times/Shape of pattern will get extended if time correction follows.

NIFTY heading towards 25500!!As we can see NIFTY started showing rejection exactly from 26000 level which is also a psychological level and had been falling unidirectionally ever since. Further we can't see any eminent SUPPORT but minor supports can be seen on previous swings around 25700 hence despite being weak, we may see temporary green candles for few trading sessions before finally falling towards 25500 levels which is its next psychological level and important SUPPORT and any signs of REVERSAL from this zone can show massive upside so plan your trades accordingly and keep watching everyone.

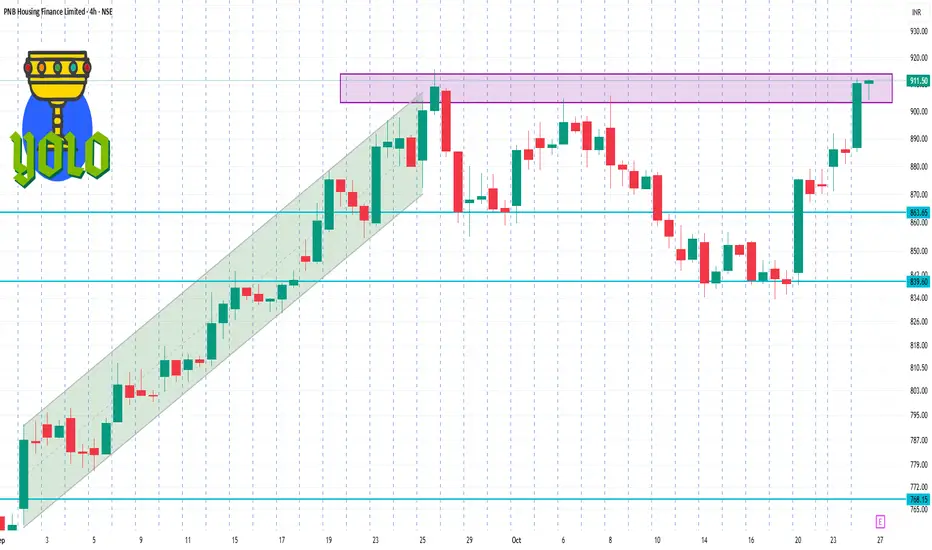
PNBHOUSING 4 Hour Time Frame PNB Housing Finance Ltd is trading at ₹907.30, reflecting a 2.68% increase from the previous close.
📊 Key Support and Resistance Levels
Support Levels: ₹885.15 (recent low), ₹826.72 (Super Trend level).
Resistance Levels: ₹912.15 (recent high), ₹1,141.90 (52-week high).
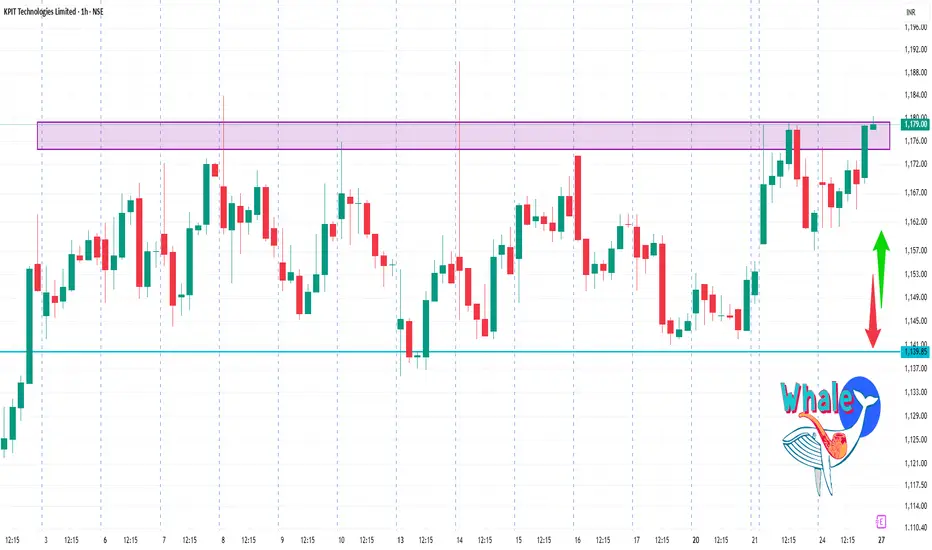
KPITTECH 1 Hour Time Frame 📈 Current Price Overview
Latest Price: ₹1,178.70
Day’s Range: ₹1,161.00 – ₹1,180.40
50-Day Moving Average (DMA): ₹1,206.21
200-Day Moving Average (DMA): Data not specified
PREMIERENE 1 Week Time Frame Key Weekly Metrics:
Opening Price (Oct 20): ₹1,052.00
Closing Price (Oct 24): ₹1,070.70
Weekly High: ₹1,080.70
Weekly Low: ₹1,003.70
Average Price: ₹1,036.22

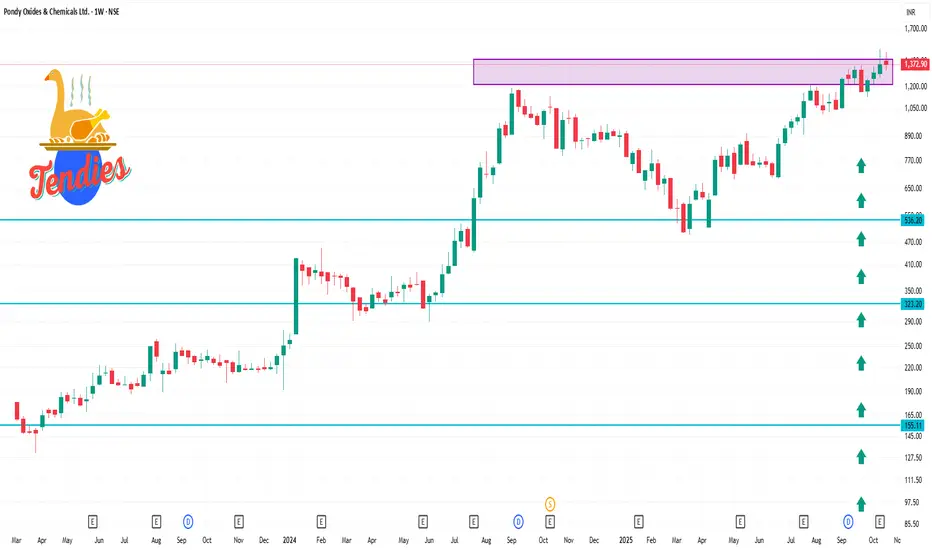
POCL 1 Week Time Frame🔍 Technical Highlights
52-Week Range: ₹490.00 – ₹1,507.05
Current Price: ₹1,372.90
Beta: -0.68, indicating lower volatility compared to the market
Relative Strength Index (RSI): 59.08, suggesting the stock is neither overbought nor oversold
50-Day Moving Average: ₹1,222.79
200-Day Moving Average: ₹886.54
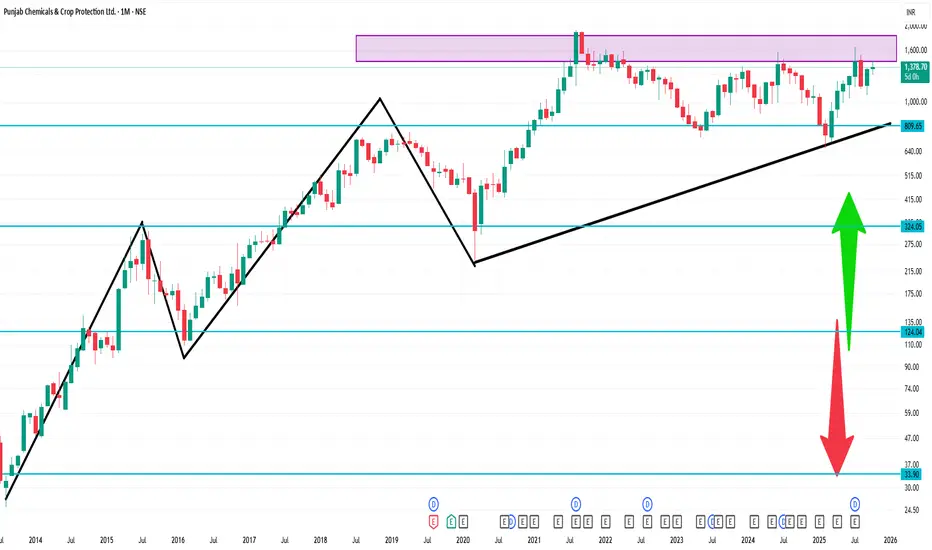
PUNJABCHEM 1 Month Time Frame 📈 1-Month Price Range (September 24 – October 24, 2025)
High: ₹1,407.50 on October 17
Low: ₹1,320.30 on October 14
Closing on October 24: ₹1,378.70
📊 Summary
Over the past month, PUNJABCHEM has experienced a decline, trading within a range of ₹1,320.30 to ₹1,407.50. Technical indicators suggest a bearish trend, with the stock trading below key moving averages and a negative MACD. However, the low RSI indicates potential for a rebound if buying interest returns.
CHOLAFIN 1 Day Time Frame 📊 Current Snapshot
Latest closing around ₹1,733.60 on 24 Oct 2025.
Day’s range on that date: high ~ ₹1,752.70, low ~ ₹1,678.10.
52-week range: ~ ₹1,168 (low) to ~ ₹1,708 (high) as per latest data.

KOTAKBANK 1 Month Time Frame 📊 Recent Price & Trend Snapshot
Current approximate price: ₹2,187 (as of 24 Oct 2025)
52-week high / low: ~ ₹2,301.90 / ~ ₹1,679.05
1-month return: positive, ~ +7.7% (per one source)
On technical indicators: Many moving averages suggest price is above key averages, which is a bullish bias in the short term. E.g., moving averages show “Buy” signals (MA5-MA200) on one checklist.

HFCL Cmp 77.74 Ascending Triangle PatternHFCL Cmp 77.74 Dated 24-10-2025
1. Ascending Triangle Pattern BO @ 79
Buy @ Cmp for riskers trades
Safe traders buy above 79 SL 75 target 80-81-83-84-85-87-88-89
It is just a view, please trade at your own risk.

BUY TODAY SELL TOMORROW for 5%DON’T HAVE TIME TO MANAGE YOUR TRADES?
- Take BTST trades at 3:25 pm every day
- Try to exit by taking 4-7% profit of each trade
- SL can also be maintained as closing below the low of the breakout candle
Now, why do I prefer BTST over swing trades? The primary reason is that I have observed that 90% of the stocks give most of the movement in just 1-2 days and the rest of the time they either consolidate or fall
Trendline Breakout in SAMMAANCAP
BUY TODAY SELL TOMORROW for 5%
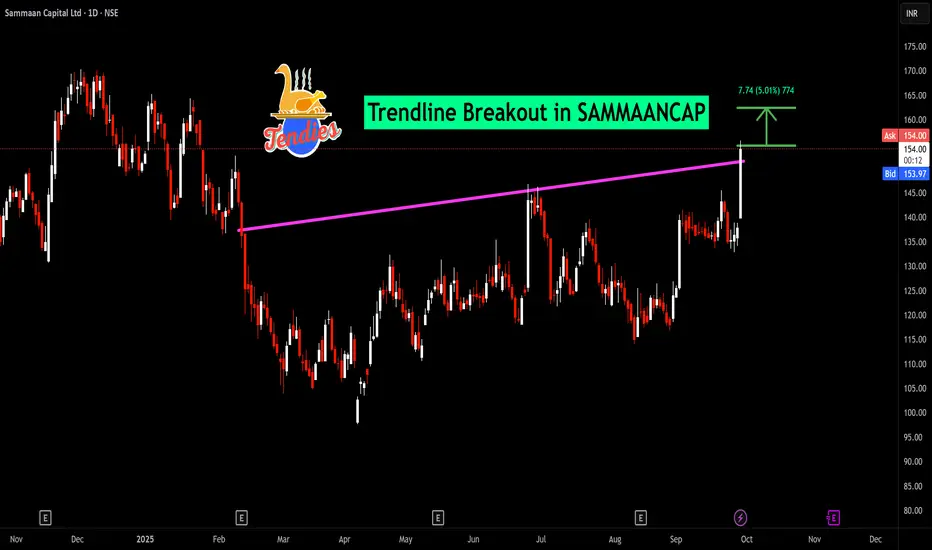
BUY TODAY SELL TOMORROW for 5%DON’T HAVE TIME TO MANAGE YOUR TRADES?
- Take BTST trades at 3:25 pm every day
- Try to exit by taking 4-7% profit of each trade
- SL can also be maintained as closing below the low of the breakout candle
Now, why do I prefer BTST over swing trades? The primary reason is that I have observed that 90% of the stocks give most of the movement in just 1-2 days and the rest of the time they either consolidate or fall
Trendline Breakout in IDEA
BUY TODAY SELL TOMORROW for 5%

BUY TODAY SELL TOMORROW for 5%DON’T HAVE TIME TO MANAGE YOUR TRADES?
- Take BTST trades at 3:25 pm every day
- Try to exit by taking 4-7% profit of each trade
- SL can also be maintained as closing below the low of the breakout candle
Now, why do I prefer BTST over swing trades? The primary reason is that I have observed that 90% of the stocks give most of the movement in just 1-2 days and the rest of the time they either consolidate or fall
Trendline Breakout in SOUTHBANK
BUY TODAY SELL TOMORROW for 5%

Swing Trading and Positional Trading1. Understanding Swing Trading
1.1 Definition
Swing trading is a short-to-medium-term trading strategy where traders aim to capitalize on price swings or fluctuations within a trend. Unlike day trading, which involves buying and selling securities within the same day, swing trading typically involves holding positions for several days to weeks. The main goal is to capture a portion of a market move, whether upward or downward.
1.2 Objectives
The primary objective of swing trading is to identify short-term opportunities in the market and profit from them without getting caught in long-term market fluctuations. Swing traders often rely on technical analysis, chart patterns, and market indicators to make decisions.
1.3 Key Strategies in Swing Trading
Swing trading involves several techniques to identify profitable opportunities:
Trend Trading: Riding the momentum of an existing trend. Traders look for strong upward or downward trends and enter trades in the direction of the trend.
Breakout Trading: Identifying key levels of support or resistance and entering trades when the price breaks through these levels.
Reversal Trading: Spotting potential trend reversals using candlestick patterns, indicators like RSI (Relative Strength Index), or MACD (Moving Average Convergence Divergence).
Momentum Trading: Trading based on momentum indicators and volume spikes that suggest a strong directional move.
1.4 Tools and Indicators
Swing traders often use a combination of technical tools and indicators to identify trade setups:
Moving Averages: To detect trends and potential reversal points.
Fibonacci Retracement Levels: To identify potential support and resistance levels.
RSI and Stochastic Oscillators: To spot overbought or oversold conditions.
Candlestick Patterns: To identify potential price reversals.
Volume Analysis: To confirm the strength of a trend.
1.5 Advantages of Swing Trading
Time Efficiency: Requires less constant monitoring compared to day trading.
Profit Potential: Captures short-term market swings that can be significant.
Flexibility: Can be applied to stocks, forex, commodities, and cryptocurrencies.
1.6 Risks and Challenges
Market Volatility: Unexpected news or events can trigger sharp price movements.
Overnight Risk: Prices can gap up or down between trading sessions.
Requires Discipline: Traders must stick to strategies and avoid emotional decisions.
2. Understanding Positional Trading
2.1 Definition
Positional trading is a long-term trading strategy where traders hold positions for weeks, months, or even years. Unlike swing trading, positional trading focuses on capturing major market trends rather than short-term price movements. Traders typically rely on a mix of fundamental analysis and technical analysis to identify long-term opportunities.
2.2 Objectives
The main goal of positional trading is to capitalize on large price movements over an extended period. Positional traders aim to ride the primary trend of an asset, ignoring minor fluctuations to avoid excessive trading and transaction costs.
2.3 Key Strategies in Positional Trading
Trend Following: Entering positions in alignment with the prevailing long-term trend.
Fundamental Analysis: Evaluating company financials, economic indicators, and macroeconomic trends to select assets with growth potential.
Breakout and Support/Resistance Analysis: Using long-term chart patterns such as triangles, head and shoulders, or channel patterns to make trading decisions.
Moving Average Crossovers: Using long-term moving averages (e.g., 50-day and 200-day) to identify trend direction.
2.4 Tools and Indicators
Positional traders focus on long-term technical and fundamental tools:
Fundamental Reports: Company earnings, economic data, and geopolitical developments.
Long-Term Moving Averages: To detect primary trends.
Trend Lines and Channels: For identifying support and resistance zones.
Technical Patterns: Such as cup-and-handle, double top/bottom for long-term breakout opportunities.
2.5 Advantages of Positional Trading
Less Time-Intensive: Requires minimal day-to-day monitoring.
Lower Transaction Costs: Fewer trades reduce brokerage fees.
Potential for Large Gains: Capturing long-term trends can result in substantial profits.
2.6 Risks and Challenges
Market Corrections: Long-term holdings are susceptible to market corrections.
Capital Commitment: Funds remain tied up for extended periods.
Patience and Discipline Required: Traders must resist the urge to react to short-term volatility.
3. Risk Management in Both Styles
Risk management is vital for both swing and positional trading. Techniques include:
Stop-Loss Orders: Placing stop-loss levels to limit potential losses.
Position Sizing: Determining the appropriate trade size based on risk tolerance.
Diversification: Avoiding concentration in a single asset or sector.
Regular Review: Monitoring positions and adjusting strategies as market conditions change.
4. Practical Examples
4.1 Swing Trading Example
A swing trader identifies a stock in a strong upward trend with support at ₹500 and resistance at ₹550. The trader buys at ₹505 and targets a sell at ₹545, with a stop-loss at ₹495. Over a week, the stock rises to ₹545, yielding a short-term profit.
4.2 Positional Trading Example
A positional trader identifies a technology stock with strong fundamentals and long-term growth prospects. Buying at ₹1,000 with a target of ₹1,500 over the next year, the trader ignores minor fluctuations, focusing on the overall upward trend. Over several months, the stock appreciates steadily, achieving the target.
5. Integrating Both Strategies
Some traders combine swing and positional strategies:
Hybrid Approach: Holding a core long-term position while taking short-term swing trades on other assets.
Hedging: Using swing trades to hedge risks in a long-term portfolio.
This approach allows traders to balance risk and reward while leveraging both short-term and long-term opportunities.
6. Psychological Aspects
Swing Traders: Must handle short-term volatility, avoid overtrading, and maintain discipline.
Positional Traders: Need patience, emotional stability, and a long-term mindset.
Emotional discipline and mental resilience are key to success in both trading styles.
Conclusion
Both swing trading and positional trading offer valuable opportunities in financial markets. Swing trading is ideal for traders seeking short-term profits from market fluctuations, while positional trading suits those aiming to capture long-term trends. Choosing the right strategy depends on individual risk tolerance, time availability, and market knowledge. Mastery of technical analysis, risk management, and psychological discipline is essential for success in either style. Combining insights from both strategies can provide a comprehensive approach to trading, maximizing profits while mitigating risks.

Smart Liquidity Trading Strategies1. Understanding Market Liquidity
Market liquidity refers to the ease with which an asset can be converted to cash at a stable price. High liquidity implies narrow bid-ask spreads, large volumes, and low volatility for a given transaction size, while low liquidity involves wider spreads, lower volume, and higher volatility. Understanding liquidity is crucial for trading strategies because:
Liquidity affects execution costs.
Illiquid markets are prone to sharp price moves.
Market participants’ behavior can create temporary liquidity imbalances, which smart traders exploit.
Liquidity can be categorized into:
Natural liquidity – The existing supply and demand for an asset.
Hidden liquidity – Orders that are not visible in the order book but can influence prices, such as iceberg orders.
Synthetic liquidity – Created by market participants through strategies like high-frequency trading (HFT) or algorithmic trading.
2. Types of Liquidity Trading Strategies
Smart liquidity trading strategies can be broadly classified into several types:
2.1 Order Book Analysis
The order book shows the real-time buy (bid) and sell (ask) orders. Smart traders analyze the order book to detect liquidity clusters:
Support and Resistance Liquidity Zones: Large order clusters act as barriers to price movement. If the buy-side has a significant volume, it can provide support. Conversely, large sell orders can act as resistance.
Order Flow Imbalances: When the number of aggressive buy orders exceeds sell orders, it can indicate potential upward price pressure, and vice versa.
Tools such as depth-of-market (DOM) screens, Level II quotes, and heatmaps allow traders to visualize these liquidity zones.
2.2 Volume-Weighted Strategies
Volume is a direct proxy for liquidity. Smart liquidity traders often use volume-weighted techniques:
Volume Weighted Average Price (VWAP) Trading: VWAP is the average price of a security weighted by its traded volume. Traders aim to buy below or sell above VWAP to minimize market impact.
Liquidity-Seeking Algorithms: Large institutional orders are split and executed in small portions based on current liquidity to avoid slippage. Algorithms like VWAP, TWAP (Time-Weighted Average Price), and POV (Percentage of Volume) are commonly used.
2.3 Price Action and Liquidity Gaps
Liquidity gaps occur when the order book is thin at certain price levels. Smart traders exploit these gaps:
Breakout Trading: Thin liquidity areas often allow prices to accelerate quickly once the barrier is breached.
Stop-Hunting Strategies: Large participants sometimes trigger liquidity pools (stop-loss clusters) to create favorable price movements. Traders who understand liquidity dynamics can anticipate these zones.
2.4 High-Frequency and Algorithmic Liquidity Strategies
High-frequency traders (HFTs) specialize in identifying and exploiting transient liquidity imbalances. Examples include:
Market-Making: Providing liquidity by continuously quoting buy and sell prices and profiting from the spread.
Latency Arbitrage: Exploiting delays in price updates across exchanges or trading venues.
Liquidity Sniping: Targeting hidden orders when they are partially revealed or exposed due to large market moves.
2.5 Cross-Market and Cross-Asset Liquidity Trading
Liquidity is not confined to a single market. Smart traders examine correlations between markets:
Equity and Derivative Pairs: For example, the liquidity in index futures can provide insights into the underlying stocks’ potential moves.
Forex and Commodity Cross-Market Liquidity: Major currency pairs often exhibit predictable liquidity patterns, which can influence commodity prices, like oil or gold.
ETF Arbitrage: When ETF liquidity diverges from its underlying basket, traders can exploit the mispricing efficiently.
3. Smart Tools for Liquidity Analysis
Successful liquidity trading requires advanced tools and data sources:
Order Book and Level II Data: Visualizing real-time buy/sell orders and depth helps identify liquidity clusters and thin zones.
Volume Heatmaps: Identify where significant trading activity is occurring across price levels.
Liquidity Aggregators: Tools that combine order book data across multiple exchanges to provide a consolidated view.
Algorithmic Platforms: Automated execution minimizes slippage and optimizes order placement according to liquidity conditions.
News and Event Scanners: Market liquidity often changes during economic releases, corporate earnings, or geopolitical events. Monitoring these can prevent adverse execution.
4. Liquidity Timing Strategies
Timing is crucial in liquidity trading. Smart traders often consider:
Market Open and Close: Liquidity is often thin at market open, leading to high volatility. Conversely, liquidity peaks near close due to institutional rebalancing.
Intraday Patterns: Volume spikes are common at certain times of the day (e.g., after economic news). Traders can use these predictable patterns.
Event-Based Liquidity: Earnings announcements, central bank decisions, and geopolitical events create temporary liquidity vacuums or surges.
5. Risk Management in Liquidity Trading
While liquidity strategies can be profitable, they carry specific risks:
Execution Risk: Entering or exiting positions in illiquid markets may lead to slippage or partial fills.
Market Impact Risk: Large orders in thin markets can move prices against the trader.
Counterparty Risk: Over-reliance on automated systems or brokers may lead to failure if liquidity vanishes unexpectedly.
Overnight Risk: Illiquid positions held overnight can be vulnerable to gaps in price movement.
Smart liquidity traders manage these risks using:
Order Slicing: Breaking large trades into smaller orders to avoid price impact.
Stop-Loss Placement: Strategic placement in liquid zones to reduce adverse execution.
Diversification: Trading multiple correlated instruments to distribute liquidity risk.
Automated Monitoring: Alert systems to detect liquidity shifts and adjust execution dynamically.
6. Psychological and Behavioral Insights
Liquidity trading is not just technical; market psychology plays a key role:
Traders often herd around visible liquidity pools, creating predictable patterns.
Understanding the behavior of institutional participants, such as how they hide large orders, can give retail traders a strategic advantage.
Market sentiment can create sudden liquidity droughts, which savvy traders can exploit by anticipating crowd behavior.
7. Practical Examples of Smart Liquidity Strategies
Example 1: VWAP Execution
An institutional trader needs to buy 1 million shares without moving the market.
The algorithm executes trades according to intraday volume, ensuring the average price is near VWAP, minimizing slippage.
Example 2: Liquidity Gap Breakout
A stock shows a thin order book at a certain price level due to low participation.
A trader places a breakout order just above the liquidity gap, allowing rapid execution as the price accelerates through the thin zone.
Example 3: Cross-Market Arbitrage
ETF price deviates from its underlying basket due to temporary liquidity shortage.
Trader buys the cheaper asset and sells the overvalued counterpart, profiting as prices converge once liquidity returns.
Example 4: Stop-Loss Liquidity Pool Hunting
Large institutional stops often cluster near round numbers.
Smart traders identify these clusters and position accordingly, entering slightly before the expected cascade to benefit from the resulting liquidity surge.
8. Advanced Considerations
Hidden Liquidity: Iceberg orders and dark pools hide true market depth. Advanced traders use predictive analytics to estimate hidden volumes.
Liquidity Fragmentation: Markets are fragmented across multiple exchanges and dark pools. Consolidated data helps detect where liquidity is concentrated.
Dynamic Liquidity Modeling: Using AI and machine learning to predict how liquidity responds to price moves, news, and market sentiment.
9. Key Principles for Smart Liquidity Trading
Observe, Don’t Chase: Liquidity dynamics often reveal intentions of larger players. Observing patterns is more effective than aggressive chasing.
Minimize Market Impact: Use algorithms and staggered executions to preserve favorable prices.
Adapt to Market Conditions: Liquidity is dynamic; strategies must adjust intraday.
Leverage Technology: Automation, analytics, and high-speed data feeds are essential.
Integrate Risk Management: Smart liquidity trading combines precision entry, execution efficiency, and rigorous risk controls.
10. Conclusion
Smart liquidity trading strategies focus on understanding and leveraging the flow of market liquidity rather than simply predicting price direction. By analyzing order books, volume, cross-market activity, and behavioral patterns, traders can execute efficiently, reduce slippage, and identify profitable opportunities hidden in the market structure. These strategies require a combination of analytical skill, technological tools, and disciplined risk management. As markets evolve and liquidity becomes more fragmented, mastery of liquidity dynamics increasingly distinguishes professional traders from casual participants. The essence of smart liquidity trading lies in respecting the invisible currents of supply and demand, positioning oneself ahead of major flows, and executing with surgical precision.

Primary Market vs. Secondary Market in Indian Trading1. Introduction
Financial markets can broadly be divided into two categories: the primary market and the secondary market. These markets facilitate the trading of financial instruments such as equities, bonds, and derivatives. The primary market is the venue for raising new capital, whereas the secondary market is where existing securities are traded among investors. Both markets collectively ensure liquidity, capital formation, and price discovery in the Indian economy.
2. Primary Market
2.1 Definition
The primary market, also called the new issue market, is where companies raise capital directly from investors for the first time. This market deals with newly issued securities such as initial public offerings (IPOs), follow-on public offers (FPOs), private placements, and rights issues.
In India, the primary market is regulated by the Securities and Exchange Board of India (SEBI) to ensure transparency and protect investors’ interests.
2.2 Instruments in the Primary Market
Initial Public Offerings (IPOs)
Companies issue shares to the public for the first time to raise capital. For instance, Reliance Industries and Paytm used IPOs to generate significant funds.
Follow-on Public Offers (FPOs)
Companies that are already listed may issue additional shares to raise more capital.
Private Placements
Companies may issue securities to select institutional investors rather than the public.
Rights Issues
Existing shareholders are offered the right to purchase additional shares at a discounted price.
Debentures and Bonds
Debt instruments issued by companies or the government to raise funds for infrastructure, expansion, or operational purposes.
2.3 Functions of the Primary Market
Capital Formation
The primary market enables companies to raise funds for growth, expansion, or new projects.
Investment Opportunities
It provides investors with a chance to invest in new and potentially high-growth companies.
Economic Growth
By facilitating capital flow into productive sectors, the primary market contributes to industrial and economic development.
Government Financing
Government bonds issued in the primary market help fund public projects such as roads, hospitals, and infrastructure.
2.4 Process of Primary Market Transactions
Company Decision: The company decides to raise funds.
Appointment of Intermediaries: Merchant bankers, underwriters, and registrars are appointed.
Drafting Prospectus: A document outlining financials, risks, and objectives is prepared.
SEBI Approval: SEBI reviews the prospectus to ensure compliance.
Marketing and Subscription: Investors apply for securities through brokers or online platforms.
Allotment: Securities are allocated, and funds are transferred to the company.
Example: The 2023 IPO of Nykaa, a prominent e-commerce platform in India, followed this exact process to raise funds from retail and institutional investors.
2.5 Advantages of the Primary Market
Direct funding for companies without depending on loans.
Offers investors early-stage opportunities.
Encourages entrepreneurship and innovation.
Helps governments fund public projects efficiently.
2.6 Disadvantages of the Primary Market
Investment risk is higher due to uncertainty about new companies’ performance.
Time-consuming regulatory procedures.
Limited liquidity until shares are listed on a secondary market.
3. Secondary Market
3.1 Definition
The secondary market is where previously issued securities are traded between investors. Companies do not receive funds in this market; instead, it provides liquidity and enables price discovery for existing shares, bonds, or other financial instruments.
In India, secondary markets include stock exchanges like the NSE (National Stock Exchange) and BSE (Bombay Stock Exchange), where millions of investors trade daily.
3.2 Instruments in the Secondary Market
Equities (Shares of listed companies)
Debentures (Corporate and government bonds)
Mutual Funds
Derivatives (Options, futures, swaps)
Exchange-Traded Funds (ETFs)
3.3 Functions of the Secondary Market
Liquidity
Investors can easily buy and sell securities, providing an exit route from investments made in the primary market.
Price Discovery
Market forces of demand and supply determine the price of securities.
Investor Confidence
A transparent and regulated secondary market builds trust, encouraging more investment in the primary market.
Economic Indicator
The performance of stock exchanges reflects the economic health of the country.
3.4 Participants in the Secondary Market
Retail Investors
Individual investors trading through brokers or online platforms.
Institutional Investors
Mutual funds, insurance companies, banks, and foreign institutional investors (FIIs).
Brokers and Dealers
Facilitate trading and provide liquidity to the market.
Market Makers
Ensure constant buying and selling of securities to stabilize markets.
3.5 Advantages of the Secondary Market
Provides liquidity and flexibility to investors.
Encourages wider participation in capital markets.
Helps companies monitor investor sentiment.
Supports fair pricing of securities through continuous trading.
3.6 Disadvantages of the Secondary Market
Market volatility can lead to financial loss.
Prices may be influenced by speculation rather than fundamentals.
Requires active monitoring and knowledge to trade effectively.
4. Interaction Between Primary and Secondary Markets
The two markets are complementary. Funds raised in the primary market are invested in productive assets, while the secondary market ensures liquidity and provides investors with an avenue to exit their investments. A well-functioning secondary market encourages more participation in IPOs and other primary market instruments, creating a virtuous cycle of investment and growth.
Example in India: The IPO of Zomato in 2021 saw significant investor interest because investors knew they could sell shares on the NSE or BSE after listing.
5. Regulatory Framework in India
SEBI (Securities and Exchange Board of India) regulates both markets. Its responsibilities include:
Ensuring transparency and disclosure.
Protecting investors’ interests.
Approving IPOs and monitoring listings.
Regulating trading practices in the secondary market.
The Companies Act 2013 also governs corporate governance and disclosure norms for firms raising capital.
6. Current Trends in Indian Markets
Digital Platforms: Online trading and mobile apps have increased retail participation in both markets.
IPO Frenzy: High-growth startups are increasingly opting for public listings to raise funds.
Institutional Dominance: FIIs and domestic institutional investors drive volumes in secondary markets.
Derivatives Growth: Futures and options trading have become significant in India’s NSE and BSE markets.
Conclusion
The primary and secondary markets are essential pillars of the Indian financial system. The primary market enables companies to raise capital and supports economic growth, while the secondary market provides liquidity, facilitates price discovery, and instills investor confidence. Both markets are interconnected, and their smooth functioning is crucial for the stability and development of India’s capital market.
A robust understanding of these markets helps investors make informed decisions and allows companies to leverage capital efficiently, driving India toward sustained financial and economic growth.
