BTC 1 Week Time Frame 📊 1-Week Timeframe: Key Support & Resistance Levels
🔼 Resistance Levels
1st Resistance: $114,106
2nd Resistance: $117,201
3rd Resistance: $120,485
🔽 Support Levels
1st Support: $107,728
2nd Support: $104,445
3rd Support: $101,349
These levels are derived from Barchart's technical analysis.
Trend Lines
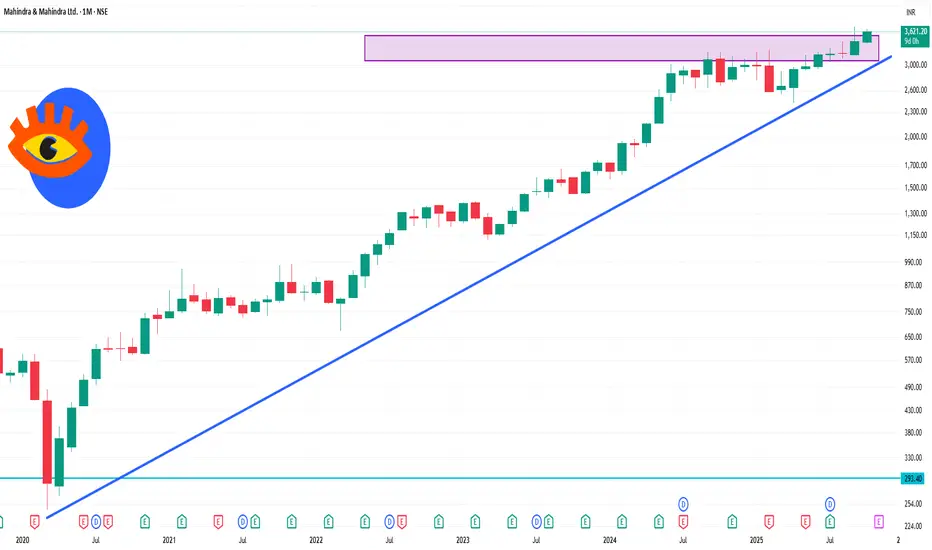
M&M 1 Month Time Frame 📊 Monthly Technical Overview
Current Price: ₹3,621.20
52-Week Range: ₹2,425.00 – ₹3,723.80
Recent High: ₹3,723.00 (September 9, 2025)
📈 Market Sentiment
The recent GST tax cut on SUVs with engines over 1500 cc has positively impacted Mahindra's sales, particularly for models like the Scorpio and XUV700. September 2025 saw a 10% year-on-year increase in SUV sales to dealers, and the first nine days of the Navratri festival recorded a more than 60% year-on-year sales increase.
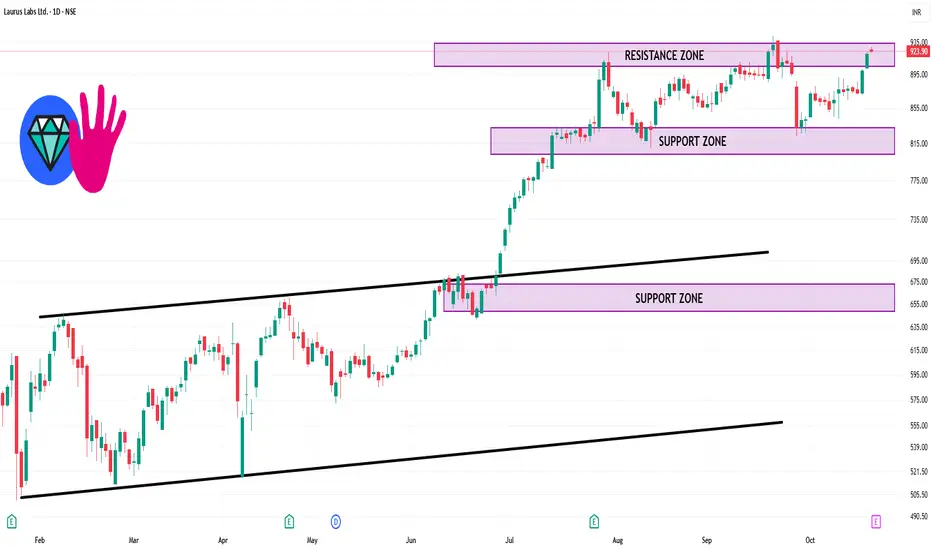
LAURUSLABS 1 Day Time Frame 📈 Intraday Price Overview
Current Price: ₹923.90
Day’s Range: ₹921.15 – ₹929.80
Opening Price: ₹925.85
Previous Close: ₹920.65
Volume: 522,764 shares
VWAP: ₹925.80
Market Cap: ₹49,874 crore
52-Week Range: ₹440.45 – ₹944.00
Beta: 1.29 (indicating higher volatility compared to the market)
P/E Ratio (TTM): 97.97
Book Value: ₹82.85 per share
Dividend Yield: 0.13%
Earnings Report: Expected on October 23, 2025
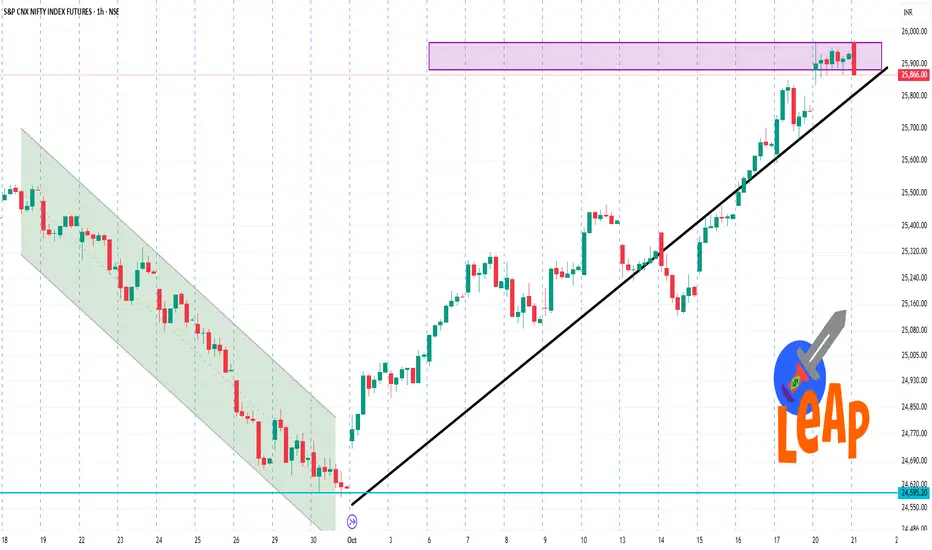
NIFTY1! 1 Hour Time Frame 🔄 Key Levels to Watch
Support Levels: Approximately ₹25,600. A bounce from this area could indicate a potential upward movement.
Resistance Levels: Around ₹25,900. A breakout above this level may signal a continuation of the upward trend.
📌 Pivot Points for Reference
Based on daily and weekly pivot calculations, key levels include:
Daily Pivot: ₹25,709.67
Weekly Pivot: ₹25,974.00
These levels can serve as potential support or resistance zones.
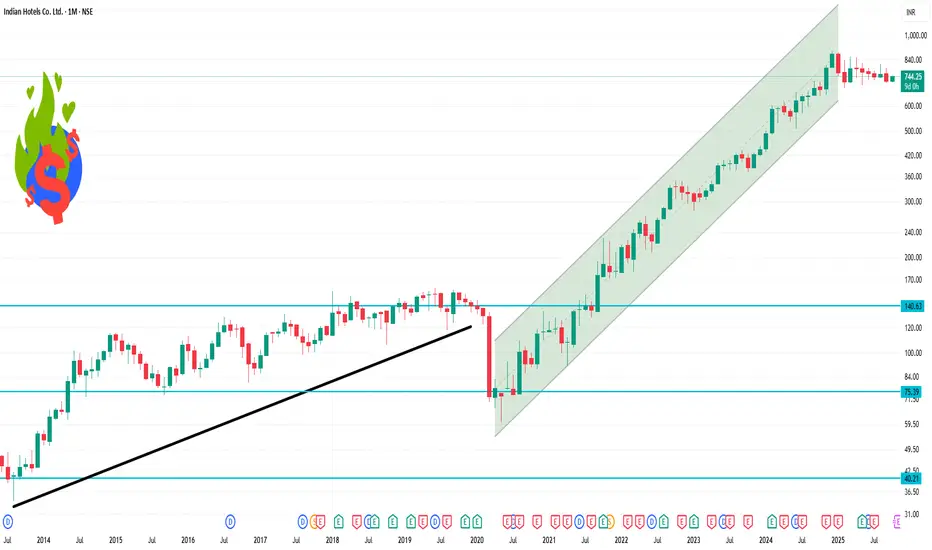
INDHOTEL 1 Month Time Frame 📊 1-Month Stock Performance
Current Price: ₹744.25
1-Month Change: Approximately -3.43% decline
52-Week Range: ₹649.00 – ₹894.90
🔍 Key Insights
Recent High: ₹748.00 on October 21, 2025
Recent Low: ₹741.00 on October 21, 2025
Analyst Sentiment: Analysts have recommended shares of companies with strong fundamentals and long-term growth potential, advising investors to hold these stocks till next Diwali for bumper returns
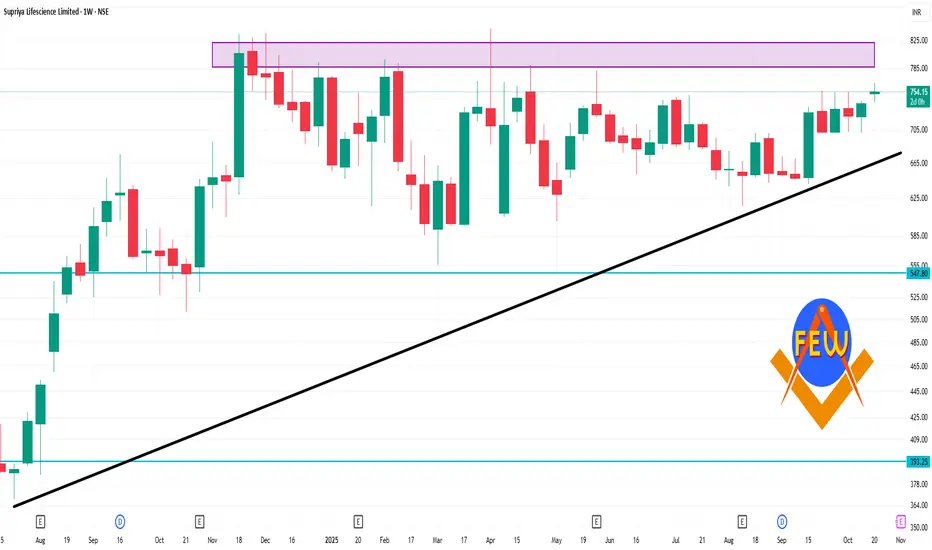
SUPRIYA 1 Week Time Frame 📈 1-Week Performance (October 14–21, 2025)
Opening Price (Oct 14, 2025): ₹710.60
Closing Price (Oct 21, 2025): ₹754.15
Weekly Gain: +6.14%
📊 Key Technical Levels
1-Week High: ₹764.65 (Oct 20, 2025)
1-Week Low: ₹749.85 (Oct 21, 2025)
Current Price (Oct 22, 2025): ₹754.15
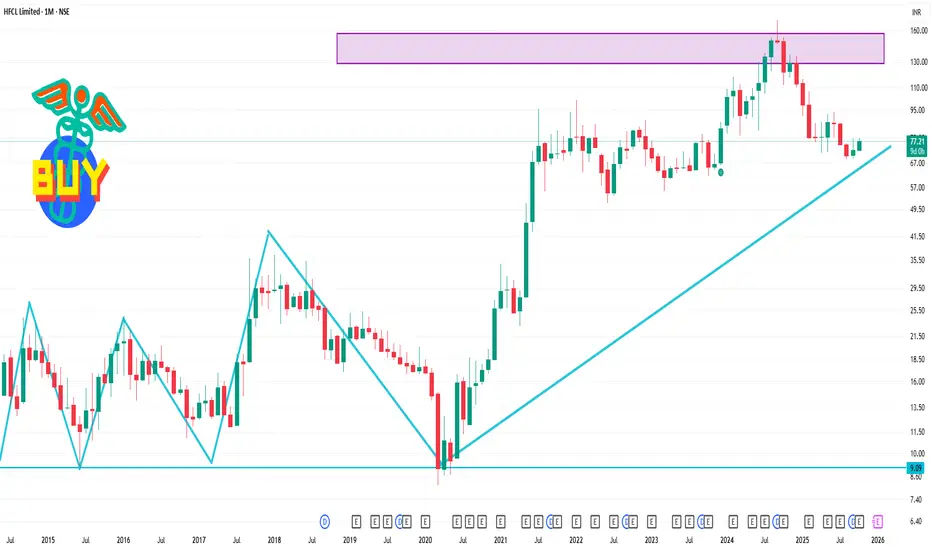
HFCL 1 Month Time Frame 📊 Monthly Technical Indicators
RSI (14-day): 57.91 — Neutral
Stochastic RSI: 72.52 — Neutral
MACD: 0.64 — Slightly bullish
ADX (14): 18.80 — Weak trend strength
Commodity Channel Index (CCI): 26.28 — Neutral
Rate of Change (ROC): 4.63% — Positive momentum
Williams %R: -51.95 — Neutral
Ultimate Oscillator: 48.33 — Neutral
Average True Range (ATR): ₹2.67 — Moderate volatility
📈 Moving Averages
Short-Term (5, 10, 20-day): Bullish
Medium-Term (50-day): Bullish
Long-Term (100, 200-day): Bearish
🧭 Key Support & Resistance Levels
Support Levels: ₹76.43 (S1), ₹75.73 (S2), ₹74.86 (S3)
Resistance Levels: ₹78.12 (R1), ₹79.06 (R2), ₹80.00 (R3)
Part 1 Ride The Big Moves American vs. European Options
Options can be American-style or European-style. American options can be exercised any time before expiry, while European options can be exercised only on the expiry date. In India, stock options are American, while index options are European.
In-the-Money, At-the-Money, and Out-of-the-Money
These terms describe an option’s relationship to the current market price:
In-the-Money (ITM): Option has intrinsic value.
At-the-Money (ATM): Strike price equals the current price.
Out-of-the-Money (OTM): Option has no intrinsic value yet.

PCR Trading Strategies Option Greeks – Risk Indicators
“Greeks” like Delta, Gamma, Theta, Vega, and Rho measure how sensitive an option’s price is to factors such as the underlying asset’s price, volatility, time decay, and interest rates. They help traders assess risk precisely.
Strategies and Combinations
Traders combine calls and puts to create option strategies such as straddles, strangles, spreads, and iron condors. These allow profit from different market conditions—rising, falling, or even sideways trends.

Part 1 Support and Resistance Option Buyers vs. Sellers
Buyers have limited risk (only the premium paid) but unlimited profit potential.
Sellers (writers) have limited profit (the premium received) but potentially unlimited loss, especially in uncovered positions.
Leverage and Capital Efficiency
Options allow traders to control large positions with a small investment. This leverage magnifies both profits and losses, making options powerful but risky tools for speculation or hedging.

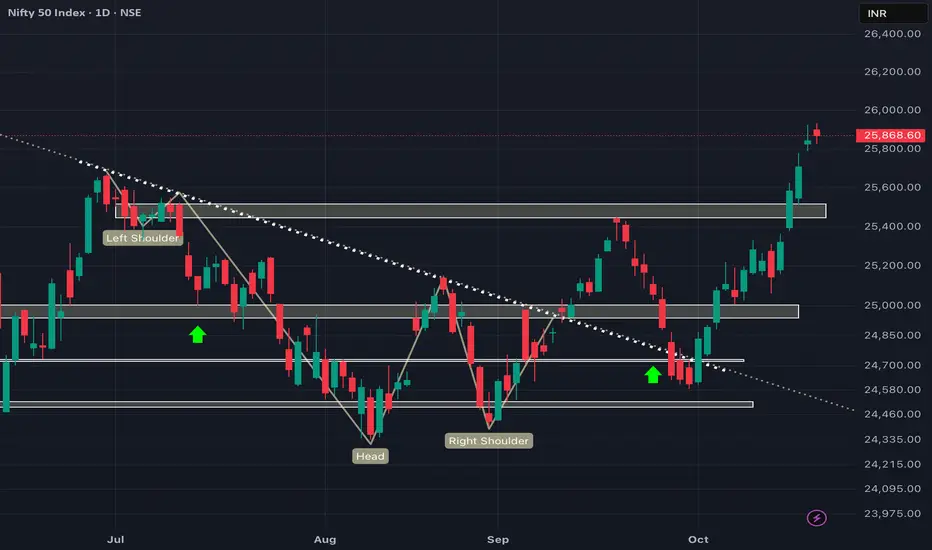
NIFTY looks strong but not STRONG ENOUGH!!?As we can see NIFTY has finally breached its previous swing but is showing signs of rejection around 25900-26000 levels as it is now trading at important GAP which has been filled and cam act as a resistance as long as NIFTY doesn't sustains itself above 25900-26000 psychological level every rise can be sold as it could be a possible trap leading to sharp fall. Moreover one who had been rallying this uptrend from our zones should start booking partially and wait for signs of reversal or sustainment above 26000 level for confirmation so plan your trades accordingly and keep watching everyone.
Part 2 Support and Resistance Intrinsic and Time Value
An option’s price consists of two parts:
Intrinsic Value: The actual profit if exercised now.
Time Value: The extra value based on time left until expiry and volatility expectations.
Hedging and Risk Management
Investors use options to hedge against adverse price movements. For example, holding puts can protect a stock portfolio from market declines—similar to buying insurance.

Part 2 Candle Stick PatternStrike Price and Expiry Date
Every option has a strike price (the agreed-upon price for buying/selling) and an expiry date (the last date the option can be exercised). These two factors determine an option’s time value and overall profitability.
Premium – The Cost of the Option
The premium is the price paid by the buyer to the seller (writer) of the option. It represents the maximum loss for the buyer and potential profit for the seller if the option expires worthless.

Part 1 Candle Stick PatternDefinition of Options
Options are financial contracts that give traders the right, but not the obligation, to buy or sell an underlying asset (like stocks, indices, or commodities) at a predetermined price within a specific time frame. They are a type of derivative since their value depends on the price of another asset.
Types of Options – Call and Put
There are two main types:
Call Option: Gives the right to buy the asset at a fixed price.
Put Option: Gives the right to sell the asset at a fixed price.
Traders use calls when expecting prices to rise and puts when expecting prices to fall.

The Role of Futures Trading in India:Futures Trading Role in India
Futures trading, a vital component of financial markets, has gradually carved a significant niche in India’s economic landscape. It is a type of derivative instrument where two parties agree to buy or sell an asset at a predetermined price at a specified future date. These instruments play an essential role in risk management, price discovery, and enhancing market liquidity. India, being a rapidly growing economy with increasing integration into global financial markets, has seen substantial evolution in its futures trading segment over the last two decades.
1. Historical Context of Futures Trading in India
Futures trading in India dates back to the pre-independence era, primarily focused on agricultural commodities. Traditional forward contracts existed informally among farmers, traders, and merchants. However, with modernization and regulatory oversight, formal commodity futures markets emerged. The establishment of the Forward Markets Commission (FMC) in 1953 marked the beginning of a regulated framework for futures trading. Initially, trading was largely concentrated in agricultural commodities like cotton, jute, and grains.
The 1990s economic liberalization in India marked a turning point. Financial sector reforms, introduction of electronic trading, and liberal policies facilitated the growth of derivative instruments, particularly stock and index futures. The Securities and Exchange Board of India (SEBI) allowed the introduction of futures and options (F&O) on equities in 2000, providing investors and traders new avenues to hedge risk and speculate on price movements. Today, both commodity and financial futures markets are integral parts of India’s capital markets ecosystem.
2. Structure of Futures Markets in India
India has a well-defined framework for futures trading governed by SEBI for financial derivatives and previously FMC for commodity derivatives (now merged with SEBI in 2015). Futures contracts are traded on recognized exchanges like:
National Stock Exchange (NSE)
Bombay Stock Exchange (BSE)
Multi Commodity Exchange (MCX)
National Commodity & Derivatives Exchange (NCDEX)
Futures contracts in India cover various asset classes including equities, indices, commodities (metals, energy, agricultural products), and currencies. Standardized contracts ensure uniformity in terms of quantity, quality, delivery dates, and settlement procedures. Such regulation reduces counterparty risk, a critical factor in promoting investor confidence.
3. Functions and Role of Futures Trading
Futures trading serves several important functions in India’s financial ecosystem:
a. Risk Management and Hedging
One of the primary roles of futures trading is risk management. Businesses, farmers, manufacturers, and investors face price volatility in commodities and financial instruments. Futures contracts allow them to hedge against adverse price movements. For instance:
Agricultural Producers: Farmers can lock in a price for crops such as wheat or soybean months before harvest to protect against price drops.
Industrial Users: Companies reliant on raw materials (like metals or oil) use futures contracts to manage cost fluctuations.
Investors and Portfolio Managers: Equity futures allow investors to hedge stock positions against market downturns.
Hedging through futures reduces uncertainty, stabilizes income, and enables better planning for businesses and investors alike.
b. Price Discovery
Futures markets play a critical role in price discovery. The interaction of buyers and sellers, reflecting supply-demand dynamics, expectations, and global trends, helps establish a transparent market price for assets. Indian futures markets, particularly for commodities like crude oil, gold, and agricultural produce, provide real-time pricing signals, enabling market participants to make informed decisions.
c. Liquidity Provision
Futures trading enhances market liquidity. By attracting a wide array of participants—including speculators, hedgers, and arbitrageurs—the volume and turnover increase. This liquidity ensures smoother transactions and narrower bid-ask spreads. It also allows smaller traders to enter markets without impacting prices significantly.
d. Investment and Speculation
While hedging is a primary motive, futures markets also attract speculators seeking profit from price movements. Speculators, by providing liquidity and taking on risk, play a crucial role in market efficiency. Their participation ensures continuous trading and contributes to price discovery mechanisms.
e. Economic Significance
Futures trading has broader economic implications. It encourages capital formation, efficient allocation of resources, and reduces wastage in commodities markets by providing reliable pricing mechanisms. For agricultural commodities, futures markets help minimize distress sales by farmers, leading to better income stability.
4. Key Futures Products in India
a. Equity and Index Futures
Equity futures are contracts to buy or sell shares of companies at a predetermined price on a future date. Index futures, on the other hand, are based on market indices like Nifty 50 or Sensex, allowing investors to hedge or speculate on the broader market movement. These derivatives have grown exponentially, with NSE being one of the largest derivative exchanges globally by volume.
b. Commodity Futures
Commodity futures in India cover agricultural products (like wheat, soybean, cotton), metals (gold, silver, copper), and energy (crude oil, natural gas). Exchanges like MCX and NCDEX facilitate transparent trading, helping farmers, traders, and industries manage risks associated with price volatility.
c. Currency Futures
Currency futures involve trading in INR against major currencies like USD, EUR, GBP, and JPY. These contracts are crucial for exporters, importers, and multinational companies to hedge foreign exchange risk. NSE and BSE provide active platforms for currency derivatives trading.
5. Regulatory Framework
The Securities and Exchange Board of India (SEBI) oversees all financial futures and commodity derivatives markets, ensuring investor protection, transparency, and integrity. Key regulatory measures include:
Mandatory margin requirements to reduce counterparty risk.
Strict position limits to avoid market manipulation.
Settlement guarantee mechanisms to ensure contract fulfillment.
Surveillance and monitoring to prevent insider trading and speculative excesses.
This robust regulatory framework has increased investor confidence and contributed to the growth of India’s futures markets.
6. Advantages of Futures Trading in India
Risk Mitigation: Futures provide a tool to hedge against price volatility and protect investments.
Transparent Price Discovery: Open trading ensures fair market prices, reflecting real-time supply-demand conditions.
Market Efficiency: High liquidity and participation reduce inefficiencies and arbitrage opportunities.
Economic Planning: Predictable pricing helps businesses and policymakers make informed decisions.
Investment Opportunities: Futures markets allow both institutional and retail investors to diversify portfolios and potentially earn profits from short-term price movements.
7. Challenges and Risks
Despite its benefits, futures trading carries certain risks:
Leverage Risk: Futures involve high leverage, which can amplify both profits and losses.
Speculative Excess: Excessive speculation may cause volatility, particularly in commodity markets.
Limited Awareness: Many retail investors lack proper understanding of derivative instruments, leading to potential losses.
Regulatory Complexity: Compliance and monitoring requirements can be challenging for new entrants and small traders.
8. Recent Developments and Technological Impact
The last decade has witnessed significant modernization in Indian futures markets. Electronic trading platforms, algorithmic trading, and mobile trading apps have made futures more accessible to retail investors. Advanced risk management tools, real-time analytics, and margin calculators have increased transparency and reduced operational risks. Moreover, SEBI’s initiatives to promote commodity futures among small farmers have enhanced market participation and economic inclusion.
9. Future Outlook
India’s futures trading market is poised for substantial growth due to:
Economic Growth: Expanding industrialization and agricultural modernization increase demand for hedging instruments.
Global Integration: Rising participation in global markets necessitates efficient derivatives to manage cross-border risks.
Financial Literacy: Awareness campaigns and investor education programs encourage participation from retail investors.
Technological Advancement: AI-driven analytics, blockchain-based settlement, and improved trading platforms will increase efficiency and trust.
Policy Support: Government initiatives to promote agricultural and industrial hedging are likely to expand futures market adoption.
Futures trading, therefore, is expected to play an even larger role in stabilizing prices, managing risk, and contributing to India’s economic growth in the coming years.
10. Conclusion
Futures trading in India has evolved from a small, commodity-focused market to a sophisticated ecosystem encompassing equities, indices, commodities, and currencies. Its primary roles—hedging, risk management, price discovery, and liquidity provision—make it an indispensable component of modern financial markets. With growing investor awareness, technological innovation, and regulatory support, futures markets are expected to continue expanding, driving efficiency and stability in India’s economy. While risks and challenges remain, the benefits—both for individual investors and the broader economy—underscore the critical role of futures trading in shaping India’s financial landscape.
News Impact on Trading Decisions1. Introduction to News-Based Trading
News-based trading, often referred to as event-driven trading, is a strategy where market participants react to new information to anticipate and profit from price movements. News can include economic releases, corporate announcements, geopolitical developments, central bank communications, or even unexpected global events such as natural disasters or pandemics. The rationale behind news trading is simple: markets tend to adjust quickly when new information alters the perceived value of an asset.
Traders often categorize news into two main types: scheduled news and unscheduled news.
Scheduled News: These are events known in advance, such as central bank interest rate decisions, quarterly earnings reports, employment data, inflation figures, and GDP releases. Since the timing and nature of these releases are anticipated, traders can prepare strategies in advance, such as setting stop-loss levels, entry points, or hedging positions.
Unscheduled News: These are unexpected events that can have immediate and dramatic market consequences. Examples include political upheavals, terrorist attacks, regulatory announcements, or sudden corporate scandals. Because these events are unanticipated, they often trigger rapid market reactions and higher volatility.
2. The Psychological and Behavioral Impact of News
Market reactions to news are not always purely rational. Behavioral finance suggests that human psychology, including emotions like fear, greed, and overconfidence, heavily influences trading decisions. News can amplify these psychological responses in several ways:
Fear and Panic: Negative news, such as economic recessions or corporate scandals, often triggers panic selling. Traders may exit positions quickly to limit losses, causing sharp downward price movements.
Greed and Optimism: Positive news, such as strong earnings or favorable government policies, can create FOMO (Fear of Missing Out), prompting traders to buy aggressively. This can push prices above their intrinsic value in the short term.
Herd Behavior: Traders often mimic the actions of others during major news events. If influential market players act decisively on news, others tend to follow, amplifying the market reaction.
Understanding these psychological responses allows traders to anticipate short-term price movements and manage their positions more effectively.
3. Types of News and Their Market Impact
News can influence trading decisions differently depending on its type and significance:
a) Economic News
Economic indicators such as inflation, unemployment rates, consumer confidence, and industrial production affect traders’ perception of a country’s economic health. For example, higher-than-expected inflation might trigger fears of interest rate hikes, causing bond prices to fall and the local currency to strengthen. Traders often use economic calendars to track such announcements and position themselves accordingly.
b) Corporate News
Corporate announcements, including earnings reports, dividend declarations, mergers and acquisitions, or management changes, directly impact individual stocks. A company reporting higher-than-expected profits may see its stock rise, while a profit warning could lead to rapid sell-offs. Institutional traders often analyze these reports in detail, considering not only the headline numbers but also guidance and forward-looking statements.
c) Political and Geopolitical News
Elections, government policy changes, trade negotiations, and conflicts can influence market sentiment. For instance, news of favorable trade agreements may boost market optimism, while geopolitical tensions may increase risk aversion, benefiting safe-haven assets like gold or government bonds.
d) Market Rumors and Speculative News
Even unverified news can influence markets, especially in the short term. Social media and financial news portals often disseminate rumors that create temporary price swings. Traders using algorithmic systems may react within milliseconds, leading to sudden spikes or drops.
4. News Trading Strategies
Traders adopt various strategies to capitalize on news events. These strategies range from reactive to proactive, depending on the trader’s risk appetite and time horizon.
a) Event-Driven Trading
Event-driven traders specifically target scheduled or unscheduled events that are likely to create significant market volatility. For example, a trader may position themselves ahead of a central bank meeting, expecting a certain interest rate outcome.
b) Momentum Trading
News often initiates momentum trends. Traders may follow the initial price movement triggered by news, entering positions in the direction of the trend. The idea is to ride the wave of market sentiment until signs of reversal appear.
c) Contrarian Trading
Contrarian traders take positions opposite to the initial market reaction to news. They may believe that markets overreact to certain news, creating opportunities to profit from price corrections.
d) Algorithmic and High-Frequency Trading
Modern trading relies heavily on technology to react to news at lightning speed. Algorithms scan news feeds, social media, and economic releases to execute trades in milliseconds. High-frequency traders capitalize on the brief windows of price inefficiencies caused by news.
5. Challenges of Trading Based on News
While news trading can be profitable, it comes with significant challenges:
Market Volatility: News events often create rapid price fluctuations, increasing the risk of slippage and triggering stop-loss orders.
Information Overload: Traders face an overwhelming amount of news daily. Distinguishing between material and trivial news is critical.
Unpredictable Reactions: Market responses are not always intuitive. Positive news may lead to selling if investors had anticipated even better outcomes, and vice versa. This phenomenon is often referred to as “buy the rumor, sell the news.”
Time Sensitivity: News impact is usually short-lived. Traders must act quickly to capitalize on opportunities, which requires constant monitoring and decision-making.
Manipulation Risks: Some market participants may attempt to manipulate prices through false or misleading news, making it essential for traders to verify information before acting.
6. Case Studies Illustrating News Impact
a) Economic Announcements
For example, in 2023, when the U.S. Federal Reserve unexpectedly signaled a pause in interest rate hikes, the stock market surged, while bond yields fell. Traders who anticipated or quickly reacted to this news profited from the immediate price movements.
b) Corporate Earnings
Apple Inc.’s quarterly earnings often move not only its stock but also the broader technology sector. A higher-than-expected revenue report can create a ripple effect across indices, influencing related stocks and ETFs.
c) Geopolitical Events
During the Russia-Ukraine conflict, oil and gas prices surged due to supply concerns. Traders who positioned themselves correctly benefited from rapid price appreciation, while those unprepared faced substantial losses.
7. Tools and Techniques for News-Based Trading
Successful news trading relies on timely and reliable information. Traders use a combination of tools:
News Feeds: Services like Bloomberg, Reuters, and Dow Jones provide real-time news updates.
Economic Calendars: Platforms like Forex Factory list scheduled economic releases, allowing traders to prepare.
Social Media Monitoring: Twitter, Reddit, and financial forums often disseminate early information, which some traders use for short-term positioning.
Sentiment Analysis Tools: Algorithms and AI-driven tools analyze market sentiment from news articles, social media, and press releases to gauge potential market reactions.
Trading Platforms: Advanced platforms allow for instant order execution, essential for capitalizing on news-driven price moves.
8. Risk Management in News Trading
Given the volatility associated with news, risk management is crucial. Traders use several techniques:
Stop-Loss Orders: Automatically exit positions when prices reach a predefined level to limit losses.
Position Sizing: Adjusting the size of trades to reduce exposure during high-volatility events.
Hedging: Using options, futures, or other derivatives to offset potential losses.
Diversification: Avoid concentrating on a single asset or market to spread risk.
9. The Future of News Impact on Trading
As technology evolves, the impact of news on trading will continue to grow. Artificial intelligence, machine learning, and natural language processing allow traders to parse news faster and more accurately than ever before. Algorithmic trading systems that respond in milliseconds are likely to dominate, making timely access to verified news an even more critical factor. Additionally, social media platforms are becoming increasingly influential, amplifying the speed and reach of news-driven market reactions.
However, human judgment will remain vital. Understanding context, market psychology, and the nuances of geopolitical and corporate developments can give traders an edge that pure automation may not fully replicate.
10. Conclusion
News is a powerful force in financial markets, shaping investor behavior, influencing asset prices, and creating both opportunities and risks for traders. Understanding the types of news, market psychology, and appropriate trading strategies is essential for capitalizing on information-driven price movements. While technology and algorithms provide speed and efficiency, successful news trading requires careful analysis, risk management, and a nuanced understanding of market dynamics.
Ultimately, traders who can effectively interpret news and act decisively are better positioned to navigate the ever-changing landscape of financial markets. Whether trading equities, currencies, commodities, or derivatives, recognizing the profound impact of news is a cornerstone of informed and strategic trading.
Controlling Trading Risk Factors1. Understanding Trading Risk
Before discussing control measures, it is crucial to understand what trading risk is. Trading risk refers to the potential for financial loss arising from market movements, operational errors, or external factors. Risk can be divided into several types:
Market Risk – The possibility that the market moves against your position. For example, a sudden drop in stock prices affects long positions.
Liquidity Risk – The risk of not being able to exit a trade at a desired price due to insufficient market activity.
Leverage Risk – Using borrowed funds amplifies both potential gains and potential losses.
Operational Risk – Mistakes in trade execution, technology failures, or system errors.
Psychological Risk – Emotional trading due to fear or greed can lead to impulsive decisions.
Event Risk – Unexpected events, such as geopolitical issues, economic crises, or corporate announcements, can create volatility.
Understanding these risks helps traders implement strategies to mitigate potential losses.
2. Establishing a Risk Management Plan
A risk management plan is a trader’s blueprint for controlling exposure to risk. Without a plan, trading becomes speculative gambling rather than a calculated activity. A well-defined risk management plan should include the following elements:
a. Define Your Risk Tolerance
Risk tolerance refers to the amount of loss a trader is willing to accept on a trade or overall portfolio. Factors influencing risk tolerance include:
Financial capacity: How much capital can you afford to lose without affecting your livelihood?
Trading style: Day traders generally accept smaller losses per trade, while long-term investors may tolerate temporary volatility.
Psychological resilience: Emotional strength is key to sticking with a strategy during losing streaks.
Practical Tip: Limit risk per trade to a small percentage of total capital—commonly 1-2%. This ensures that a few bad trades do not wipe out your account.
b. Set Clear Objectives
Traders must define their financial goals and time horizon. Risk control strategies vary based on whether you aim for short-term profits, steady income, or long-term wealth accumulation. Clear objectives help avoid overtrading and speculative behavior.
c. Use Position Sizing
Position sizing is the method of determining how much capital to allocate to a particular trade based on your risk tolerance. Proper position sizing reduces the risk of catastrophic losses.
Example:
If a trader has $50,000 and is willing to risk 2% per trade ($1,000), and the stop-loss distance is $5 per share, the position size = $1,000 ÷ $5 = 200 shares.
Position sizing ensures that losses are proportional to your risk tolerance.
3. Stop-Loss and Take-Profit Orders
The most fundamental tools in risk management are stop-loss and take-profit orders.
Stop-Loss: Automatically closes a trade when it reaches a specified loss level. This prevents small losses from turning into catastrophic ones.
Take-Profit: Automatically closes a trade when it reaches a target profit. This locks in gains and prevents greed-driven reversals.
Best Practices:
Place stop-loss orders at strategic technical levels, such as support or resistance, rather than arbitrary amounts.
Adjust stop-loss levels as the trade moves in your favor to lock in profits (trailing stops).
4. Diversification
Diversification is a core principle in reducing risk. It involves spreading capital across multiple assets, sectors, or markets to avoid exposure to a single source of loss.
Examples of diversification strategies:
Investing in different asset classes: stocks, bonds, commodities, and currencies.
Trading multiple industries or sectors to reduce company-specific risks.
Combining long and short positions to hedge market movements.
Caution: Over-diversification may dilute profits. Balance diversification with focus.
5. Leverage Management
Leverage magnifies both profits and losses. Excessive leverage is one of the fastest ways traders destroy their capital. Controlling leverage is critical to risk management.
Guidelines:
Use conservative leverage ratios, especially for beginners.
Calculate potential loss before opening a leveraged position.
Understand margin requirements and liquidation risks.
Leverage is a double-edged sword; disciplined use can enhance gains, but careless use can wipe out accounts.
6. Monitoring and Controlling Market Volatility
Market volatility increases risk, as prices may swing dramatically within short periods. Traders can control volatility risk through:
Volatility Stop-Loss: Adjust stop-loss distances according to market volatility. Higher volatility requires wider stops.
Avoid Trading During Extreme Events: Avoid trading during major announcements, elections, or geopolitical crises unless part of a specific high-risk strategy.
Use Options and Hedging: Options contracts and futures can hedge positions against unexpected price swings.
Volatility management is about balancing opportunity with protection.
7. Regular Risk Assessment
Risk is dynamic; it evolves with changing market conditions. Traders should continuously assess exposure to risk using:
Value at Risk (VaR): Estimates the maximum potential loss in a portfolio over a specified period.
Stress Testing: Simulates extreme market conditions to evaluate how positions perform under stress.
Risk/Reward Ratio: Aims for trades with favorable ratios, e.g., 1:2 risk/reward, meaning potential gains exceed potential losses.
Regular assessment ensures traders adapt strategies before losses escalate.
8. Controlling Psychological Risk
Emotions are among the most dangerous risk factors. Fear and greed often override rational analysis, leading to impulsive trading.
Techniques to control psychological risk:
Follow a Trading Plan: Predefined rules for entry, exit, and risk prevent emotional decisions.
Maintain a Trading Journal: Document trades, decisions, and emotional state to identify patterns of bias.
Accept Losses: Avoid revenge trading to recover losses; stick to risk limits.
Mindfulness and Discipline: Practices like meditation, exercise, and scheduled breaks can improve decision-making under stress.
Emotional control is as important as technical analysis in trading.
9. Technology and Risk Management
Modern trading relies heavily on technology, but it introduces operational risks. Traders should mitigate these risks by:
Using reliable trading platforms with robust backup systems.
Regularly updating software and security protocols.
Setting alerts for significant market moves.
Implementing automated risk controls, such as algorithmic stop-loss or position size adjustments.
Technology, when used responsibly, enhances risk control.
10. Continuous Education and Market Awareness
Markets evolve constantly. Regulatory changes, technological developments, and global events impact risk. Traders should:
Stay informed about macroeconomic indicators and news.
Continuously learn new risk management techniques.
Review past trades and strategies to identify mistakes and successes.
Education reduces the risk of being blindsided by unforeseen market events.
11. Advanced Risk Control Techniques
For experienced traders, advanced techniques can further reduce risk exposure:
Hedging: Using derivative instruments like options, futures, or CFDs to offset potential losses.
Correlation Analysis: Understanding how assets move relative to each other to avoid unintended concentration of risk.
Scaling In and Out: Entering or exiting positions in stages to manage exposure.
Algorithmic Risk Controls: Automated trading systems can enforce discipline and minimize human error.
These strategies require knowledge and practice but can significantly enhance risk management.
12. Building a Risk-Resilient Trading Mindset
The ultimate defense against trading risk is a resilient mindset. A trader must:
Accept that losses are inevitable; success comes from managing them.
Focus on long-term consistency rather than short-term wins.
Combine technical and fundamental analysis with disciplined risk strategies.
View risk management as a proactive process, not a reactionary one.
The mindset shift from “maximizing profits” to “minimizing losses” is key to sustainable trading.
Conclusion
Trading risk is unavoidable, but it is controllable. Effective risk management encompasses strategic planning, disciplined execution, emotional control, and continuous learning. By defining risk tolerance, using stop-losses, managing leverage, diversifying portfolios, and applying advanced techniques, traders can protect their capital while pursuing profits.
Ultimately, controlling trading risk is not about eliminating it—this is impossible—but about managing it in a calculated, disciplined manner. Traders who master risk control enjoy longevity in the markets, preserve capital, and create a foundation for consistent, sustainable growth.
Retail vs. Institutional Trading1. Definitions
Retail trading refers to trading activities conducted by individual investors using their personal capital. Retail traders typically operate through brokers or online trading platforms and are often motivated by personal financial goals such as wealth accumulation, retirement planning, or short-term profits. Retail traders generally have smaller capital compared to institutional traders and face different challenges in market access and resources.
Institutional trading, on the other hand, refers to trades executed by large organizations such as hedge funds, mutual funds, pension funds, insurance companies, and investment banks. Institutional traders operate with substantial capital, professional teams, and sophisticated technologies to influence market prices and execute high-volume transactions. They are considered major market movers due to the size and frequency of their trades.
2. Participants in Retail and Institutional Trading
Retail Traders
Retail traders are often individual investors who trade for personal financial goals. They include:
Day traders who buy and sell securities within a single trading day.
Swing traders who hold positions for several days to weeks.
Long-term investors who invest for years, such as those saving for retirement.
Retail traders usually access the market through:
Online brokerages (e.g., Zerodha, Robinhood, E*TRADE)
Mobile trading apps
Advisory services for trade recommendations
Institutional Traders
Institutional traders are professional entities managing large pools of capital. They include:
Hedge funds: Seek high returns through aggressive and often leveraged strategies.
Mutual funds: Invest on behalf of retail or institutional clients, focusing on long-term growth.
Pension funds: Invest large sums to meet future obligations.
Investment banks: Engage in proprietary trading and market-making.
Insurance companies: Manage investment portfolios to match policyholder obligations.
Institutional traders have access to:
Proprietary trading algorithms
Direct market access
Extensive research teams
High-frequency trading systems
3. Capital and Market Influence
A defining difference between retail and institutional traders is the size of capital. Retail traders typically operate with small to moderate amounts of personal money. While individual trades rarely impact the market, retail sentiment can create short-term volatility in smaller stocks, particularly in emerging sectors or thinly traded securities.
Institutional traders, however, manage millions to billions in assets. A single trade from a large hedge fund or mutual fund can move stock prices, especially in mid- or small-cap markets. Their trades often influence market trends and liquidity, making them crucial participants in price discovery.
Example:
In 2021, retail traders coordinated via online platforms like Reddit’s r/WallStreetBets to push stocks like GameStop (GME) dramatically higher. However, institutional hedge funds still held significant influence, with short positions and market-making abilities that shaped the ultimate outcomes.
4. Access to Resources and Information
Retail Traders
Retail traders are limited by:
Smaller research budgets
Dependence on publicly available news and analysis
Standard trading tools provided by brokers
Despite these limitations, technological advancements have empowered retail traders with:
Real-time market data
Technical analysis software
Community-driven insights through social media and forums
Institutional Traders
Institutional traders enjoy extensive resources:
Proprietary research teams analyzing market fundamentals and technical indicators
Real-time news feeds and analytics (e.g., Bloomberg Terminal, Refinitiv)
Advanced trading algorithms for high-frequency and quantitative strategies
Access to dark pools for executing large trades without moving market prices visibly
This resource gap often gives institutional traders a significant edge in identifying opportunities and managing risk.
5. Trading Strategies
Retail Trading Strategies
Retail traders typically rely on:
Technical analysis: Using charts, indicators, and patterns to predict price movements.
Fundamental analysis: Evaluating company earnings, balance sheets, and macroeconomic data.
Momentum trading: Riding trends in popular stocks or sectors.
Swing trading: Capturing medium-term price fluctuations.
Scalping: Executing frequent, small-profit trades during intraday market movements.
Retail traders may also follow copy trading or social trading platforms to mimic strategies of more experienced traders.
Institutional Trading Strategies
Institutional traders employ advanced strategies, often inaccessible to retail traders:
Arbitrage: Exploiting price differences across markets or securities.
Algorithmic trading: Automated execution of trades based on complex models.
High-frequency trading (HFT): Making thousands of trades per second to exploit tiny price differentials.
Hedging and derivatives strategies: Using options, futures, and swaps to mitigate risk or leverage positions.
Portfolio optimization: Balancing risk and returns across a massive portfolio of assets.
Block trades: Executing large-volume trades to minimize market impact.
Institutional strategies often rely on risk management systems and liquidity analysis, which are generally beyond the reach of individual traders.
6. Costs and Fees
Retail traders face:
Broker commissions
Exchange fees
Bid-ask spreads (cost of buying at the ask and selling at the bid)
Taxes and capital gains liabilities
Institutional traders benefit from:
Lower per-trade costs due to bulk negotiations
Reduced spreads through direct market access
Sophisticated tax optimization strategies
Lower funding costs for leveraged positions
This cost advantage allows institutional traders to execute high-volume strategies that would be inefficient or prohibitively expensive for retail participants.
7. Risk Exposure and Management
Retail traders:
Often face higher relative risk due to smaller portfolios
May lack advanced risk management tools
Can be significantly affected by market volatility
Are more susceptible to emotional trading and behavioral biases
Institutional traders:
Implement risk management frameworks using Value at Risk (VaR), stress testing, and hedging
Diversify across asset classes and geographies
Can absorb short-term losses due to long-term investment horizons
Manage liquidity risk, counterparty risk, and operational risk
8. Regulatory Environment
Both retail and institutional traders are subject to regulatory oversight, though the rules differ:
Retail traders are primarily governed by rules protecting investors, such as mandatory disclosures, anti-fraud regulations, and investor education requirements.
Institutional traders face stricter compliance, including capital adequacy requirements, reporting large trades, insider trading laws, and fiduciary duties toward clients.
Regulators monitor institutional trading more closely due to the potential systemic impact of large trades.
9. Advantages and Disadvantages
Retail Trading
Advantages:
Flexibility to choose strategies and trading styles
Ability to invest based on personal goals
Lower minimum capital requirements
Freedom from complex reporting obligations
Disadvantages:
Limited access to advanced tools and research
Higher relative costs
Greater exposure to behavioral biases
Smaller influence on market trends
Institutional Trading
Advantages:
Access to advanced research, data, and technology
Lower costs per trade and favorable execution
Ability to execute large-volume trades
Professional risk management systems
Disadvantages:
Highly regulated, limiting some strategies
High operational costs
Market impact of large trades can be a challenge
Subject to public scrutiny and fiduciary obligations
10. Impact on Market Dynamics
Retail and institutional traders interact in ways that shape markets:
Liquidity: Institutions provide deep liquidity, allowing retail traders to enter and exit positions efficiently.
Volatility: Retail traders can sometimes cause short-term volatility, particularly in thinly traded stocks, while institutional trades generally smooth price movements due to hedging and diversification.
Price Discovery: Institutional traders often lead in establishing fair market value due to superior research, but retail sentiment can temporarily influence pricing.
Innovation: Retail traders increasingly adopt online platforms and community-driven insights, influencing how institutions engage with markets.
11. The Evolving Relationship
The line between retail and institutional trading is blurring:
Retail democratization: Platforms like Robinhood, Zerodha, and eToro give retail traders access to markets and tools once exclusive to institutions.
Institutional retail influence: Institutions now monitor social media trends, sentiment analysis, and retail behavior to anticipate market movements.
Hybrid strategies: Some individuals participate in institutional-style strategies via ETFs, mutual funds, or algorithmic trading platforms.
12. Conclusion
The distinction between retail and institutional trading lies in capital, resources, access, strategy, and market influence. Retail traders represent the individual investor, motivated by personal goals and operating with smaller capital and fewer resources. Institutional traders are professional, resource-rich, and wield considerable influence on market dynamics.
Despite these differences, both groups coexist symbiotically. Retail traders benefit from institutional liquidity and price efficiency, while institutions monitor retail trends to gauge sentiment. Technological advancements continue to narrow the gap, offering retail traders tools and opportunities that were once the exclusive domain of institutions. Understanding these differences is crucial for developing effective trading strategies, managing risks, and navigating financial markets successfully.
In summary, retail and institutional trading are distinct yet interconnected parts of the financial ecosystem. Their differences shape market behavior, risk profiles, and opportunities, making financial markets both dynamic and inclusive.
Trading Volume Spiking: Understanding Market Dynamics1. Causes of Trading Volume Spikes
Trading volume spikes are generally triggered by market-moving events, investor psychology, or technical market dynamics. These causes can be grouped into several categories:
a) Fundamental News Events
Fundamental news is one of the primary reasons for sudden spikes in trading volume. Market participants react to new information about a company, industry, or economy, leading to increased buying and selling activity. Key examples include:
Earnings Reports: When a publicly traded company releases quarterly or annual earnings, deviations from market expectations can trigger heavy trading. A strong earnings beat may cause buying volume to surge, while disappointing earnings can provoke panic selling.
Corporate Announcements: Mergers, acquisitions, dividends, or stock splits can trigger spikes as traders adjust positions based on anticipated impacts.
Economic Data Releases: Broader economic indicators such as unemployment rates, GDP growth, or inflation numbers can impact trading volume across sectors.
Policy Changes: Central bank rate announcements, government regulations, or geopolitical developments can also induce sudden spikes.
b) Technical Triggers
Many traders rely on technical analysis, using charts, indicators, and historical price patterns to make decisions. Certain price movements or indicator signals often trigger high-volume trades:
Breakouts and Breakdowns: When the price breaks through significant resistance or support levels, it often triggers a rush of orders from both retail and institutional traders.
Moving Averages and Indicators: Crossing key technical levels, such as the 50-day or 200-day moving average, can prompt automated or algorithmic trading to enter or exit positions.
Volume Confirmation Signals: Traders often look for volume spikes as confirmation of trend strength. A price move accompanied by unusually high volume is considered more reliable.
c) Market Sentiment and Psychology
Human behavior plays a large role in volume spikes. Fear, greed, and herd behavior can amplify trading activity:
Panic Selling or Buying Frenzy: Market participants may act collectively during periods of fear or exuberance, creating sudden surges in volume.
Speculation and Rumors: Even unverified news or market rumors can prompt significant spikes, as traders try to capitalize on potential opportunities.
d) Algorithmic and High-Frequency Trading
Modern markets are heavily influenced by algorithmic trading, which can amplify volume spikes. High-frequency trading (HFT) algorithms react in milliseconds to market signals, leading to bursts of buying or selling activity that may not reflect fundamental changes.
2. Interpreting Trading Volume Spikes
Volume spikes are not merely numerical anomalies; they carry deep implications for market participants. Understanding what a volume spike signifies is crucial for strategy development.
a) Confirmation of Price Movement
A spike in volume often confirms the strength of a price movement. For example:
A price surge with high volume indicates strong buying interest, suggesting the uptrend may continue.
Conversely, a price drop with high volume reflects strong selling pressure and can indicate a genuine downtrend.
Without significant volume, price movements may lack conviction and can be more prone to reversals.
b) Potential Trend Reversals
While high volume can confirm trends, extreme spikes can sometimes indicate trend exhaustion:
A rapid surge in volume after a prolonged price move may suggest that the market is overextended.
In some cases, this leads to a reversal, as traders take profits and new participants step in to bet against the trend.
c) Liquidity Insights
Volume spikes provide insight into market liquidity:
Higher volume generally improves liquidity, allowing larger trades to execute without significant price slippage.
Low volume during a spike, however, may indicate market thinness and volatility, making it riskier to trade large positions.
d) Institutional Activity
Unusually high volume often reflects institutional participation, such as hedge funds, mutual funds, or pension funds entering or exiting positions. These large trades can significantly influence price levels, especially in less liquid stocks.
3. Strategies for Traders During Volume Spikes
Traders and investors can use volume spikes strategically. Here are key approaches:
a) Momentum Trading
Momentum traders thrive on high-volume moves. A sudden increase in volume coupled with a breakout or breakdown can signal a strong directional trade opportunity. Traders often enter in the direction of the volume surge, expecting follow-through.
b) Volume-Based Confirmation
Technical analysts often use volume spikes as confirmation tools. For example:
Breakout Confirmation: A breakout above resistance accompanied by higher-than-average volume is more likely to sustain.
Trend Validation: Sustained trends confirmed by rising volume tend to be stronger and more reliable.
c) Contrarian Approach
Contrarian traders may interpret extreme volume spikes as signals of market exhaustion. After intense buying or selling, the market may be ripe for a pullback. This approach requires careful risk management.
d) Risk Management Adjustments
Volume spikes often coincide with higher volatility. Traders should adjust stop-loss levels, position sizes, and entry points to accommodate rapid price swings. Ignoring volume-related risk can result in significant losses.
4. Tools and Indicators for Monitoring Volume Spikes
Modern trading platforms provide a range of volume indicators to detect spikes and guide decisions:
Volume Bars: Basic histogram bars show volume per period and highlight anomalies relative to average volume.
On-Balance Volume (OBV): OBV measures cumulative buying and selling pressure, helping identify accumulation or distribution trends.
Volume Moving Averages: Traders often compare current volume against a 10-day or 20-day average to spot unusual spikes.
Volume-Price Trend (VPT): VPT combines volume and price changes to assess whether volume supports the direction of the trend.
These tools help traders distinguish between meaningful volume spikes and random market noise.
5. Case Studies of Trading Volume Spikes
Historical examples illustrate the significance of volume spikes:
Tech Stocks during Earnings Season: Companies like Apple or Microsoft often experience 3–5x average daily volume on earnings days, reflecting investor reaction to profits, guidance, or product announcements.
Market Crashes: During the 2020 COVID-19 market crash, trading volumes surged as investors panicked, providing liquidity but also amplifying volatility.
Cryptocurrency Market Events: Cryptocurrencies like Bitcoin often experience volume spikes during regulatory news or large institutional trades, resulting in rapid price swings.
6. Potential Pitfalls and Misinterpretations
While volume spikes are useful, traders must avoid over-reliance:
False Signals: Not all spikes indicate a trend continuation; some are caused by short-term speculative activity.
Thin Markets: Volume spikes in low-liquidity markets can exaggerate price moves and mislead traders.
Algorithmic Distortions: HFT can generate temporary spikes without any fundamental significance.
Proper analysis requires combining volume with other indicators such as price action, moving averages, and market news.
7. Conclusion
A trading volume spike is a key market signal reflecting a surge in trading activity, often triggered by fundamental events, technical movements, market sentiment, or institutional participation. For traders, volume spikes provide vital insights into the strength, liquidity, and sustainability of price movements. High volume confirms trends, signals potential reversals, and highlights institutional activity. However, spikes also bring risks due to higher volatility and potential market noise.
By integrating volume analysis into trading strategies, using technical indicators, and monitoring market news, traders can make more informed, strategic decisions. Whether you are a momentum trader, contrarian investor, or risk-conscious portfolio manager, understanding volume spikes is essential for navigating modern financial markets effectively.
Exploring Financial Market Types1. Money Market
The money market is a segment of the financial market that deals with short-term borrowing and lending of funds, usually with maturities of one year or less. It is primarily used by corporations, financial institutions, and governments to manage short-term liquidity needs.
Key Instruments in the Money Market:
Treasury Bills (T-Bills): Short-term debt instruments issued by governments to raise funds. They are considered risk-free and highly liquid.
Commercial Papers (CPs): Unsecured promissory notes issued by corporations to meet short-term funding needs. They generally have maturities ranging from a few days to nine months.
Certificates of Deposit (CDs): Time deposits issued by banks that pay a fixed interest upon maturity.
Repurchase Agreements (Repos): Short-term borrowing agreements where securities are sold and later repurchased at a predetermined price.
Functions:
Liquidity Management: Provides short-term funds to banks, corporations, and governments.
Efficient Allocation: Facilitates smooth functioning of the banking system.
Monetary Policy Transmission: Central banks use the money market to implement monetary policy through instruments like repos and T-bills.
The money market is characterized by low risk and relatively lower returns compared to long-term markets. Its efficiency ensures that the economy maintains liquidity and stability.
2. Capital Market
Capital markets deal with long-term funds, generally with maturities exceeding one year. They are crucial for economic growth as they enable corporations and governments to raise funds for investments in infrastructure, expansion, and other productive activities. Capital markets are broadly divided into primary markets and secondary markets.
a. Primary Market:
Also known as the new issue market, it is where new securities are issued and sold to investors.
Initial Public Offerings (IPOs): Companies raise equity by offering shares to the public for the first time.
Bond Issuance: Governments and corporations raise debt funds by issuing bonds.
b. Secondary Market:
Once securities are issued in the primary market, they are traded in the secondary market. Examples include stock exchanges like the New York Stock Exchange (NYSE), NASDAQ, and Bombay Stock Exchange (BSE).
Functions of Capital Markets:
Capital Formation: Enables businesses to raise funds for long-term growth.
Investment Opportunities: Provides a platform for individuals and institutions to invest their savings in productive assets.
Price Discovery: Helps determine the market value of securities through supply-demand dynamics.
Liquidity: Secondary markets allow investors to buy and sell securities easily, ensuring liquidity.
Participants in Capital Markets:
Retail investors
Institutional investors (mutual funds, pension funds)
Investment banks and brokers
Regulatory authorities (SEBI, SEC)
Capital markets are more volatile than money markets but offer higher potential returns due to the long-term nature of investments.
3. Derivative Markets
Derivative markets are financial markets where instruments derived from underlying assets are traded. The underlying assets can include stocks, bonds, currencies, commodities, or market indices. Common derivatives include futures, options, forwards, and swaps.
Purpose of Derivatives:
Hedging: Investors use derivatives to manage or mitigate risk associated with price fluctuations.
Speculation: Traders aim to profit from price movements in the underlying asset.
Arbitrage: Derivatives allow traders to exploit price differences across markets.
Types of Derivative Instruments:
Futures: Contracts obligating the purchase or sale of an asset at a predetermined price on a specific future date.
Options: Contracts that give the buyer the right, but not the obligation, to buy or sell an asset at a set price within a certain period.
Forwards: Customized contracts between two parties to buy or sell an asset at a specified future date and price.
Swaps: Agreements to exchange cash flows or other financial instruments between parties.
Derivative markets play a vital role in financial risk management but are complex and may involve significant leverage, making them riskier than money or capital markets.
4. Foreign Exchange Market (Forex)
The foreign exchange market, or Forex, is where currencies are bought and sold. It is the largest financial market globally, with trillions of dollars traded daily. Forex facilitates international trade, investment, and tourism by providing liquidity in different currencies.
Key Features:
Decentralized Market: Operates 24/7 without a central exchange.
Participants: Banks, corporations, central banks, hedge funds, and retail traders.
Major Instruments: Spot transactions, forwards, futures, and options in currencies.
Functions:
Currency Conversion: Enables businesses to transact internationally.
Hedging Exchange Rate Risk: Companies can hedge against fluctuations in currency values.
Speculation: Traders profit from currency movements.
Global Liquidity: Supports global trade and investment flows.
The Forex market is highly liquid and volatile, influenced by macroeconomic factors, geopolitical events, and central bank policies.
5. Commodity Markets
Commodity markets are where raw materials and primary products are traded. These markets include energy, metals, and agricultural commodities. Trading can occur through physical markets or financial instruments such as futures and options.
Types of Commodities:
Agricultural Products: Wheat, rice, coffee, sugar.
Metals: Gold, silver, copper, platinum.
Energy: Crude oil, natural gas, coal.
Functions of Commodity Markets:
Price Discovery: Determines the fair market value of commodities through supply and demand.
Risk Management: Producers and consumers hedge against price volatility.
Investment Opportunities: Investors diversify portfolios by including commodities.
Economic Indicator: Commodity prices reflect economic trends and inflation expectations.
Commodity markets can be highly volatile due to weather conditions, geopolitical events, and global demand-supply dynamics.
6. Other Financial Market Segments
In addition to the major market types, several specialized financial markets exist:
Insurance Market: Provides risk management solutions against unforeseen events.
Pension Funds Market: Manages retirement savings and invests in long-term securities.
Credit Market: Focuses on lending and borrowing of debt instruments.
Venture Capital and Private Equity Markets: Provides funding to startups and private companies.
These specialized markets complement traditional markets by addressing specific financial needs and enhancing overall market efficiency.
Conclusion
Financial markets are diverse, dynamic, and interconnected. They are crucial for economic growth, providing platforms for capital formation, liquidity, risk management, and investment. Each market type—money, capital, derivatives, forex, and commodities—serves unique functions and caters to different investor needs. Participants range from retail investors to multinational corporations and central banks, collectively shaping the global financial ecosystem. Understanding these markets enables investors, policymakers, and businesses to make informed decisions, manage risks effectively, and optimize returns. As the world becomes increasingly globalized and technologically driven, financial markets continue to evolve, creating new opportunities and challenges in the pursuit of economic growth and financial stability.
How to Grow Your Business in the Trading Market1. Understanding the Trading Market Landscape
Before attempting to grow a trading business, it is crucial to understand the market dynamics. The trading market operates in a global ecosystem influenced by economic trends, geopolitical events, corporate performance, and investor sentiment. Key segments include:
Equities (Stocks): Companies raise capital through stock markets, offering investors a chance to participate in profits.
Commodities: Trading in raw materials such as gold, oil, and agricultural products, which are highly sensitive to global supply and demand.
Forex: The largest and most liquid market, involving currency pairs, influenced by interest rates, inflation, and macroeconomic data.
Derivatives: Financial contracts such as options and futures that derive value from underlying assets, useful for hedging and speculation.
Cryptocurrencies: Emerging digital assets driven by decentralized technologies, regulatory uncertainty, and market volatility.
Understanding these market segments allows a business to identify opportunities, anticipate trends, and tailor its offerings.
2. Establishing a Clear Business Model
Growth begins with a well-defined business model. There are several models in the trading sector:
Brokerage Services: Acting as intermediaries between buyers and sellers, earning through commissions or spreads.
Trading Platforms/Software: Providing technology infrastructure for traders, including analytics, charts, and automated trading systems.
Investment Advisory: Offering research, insights, and portfolio management services for retail or institutional clients.
Proprietary Trading: Using internal capital to trade, aiming to generate profits directly rather than earning commissions.
Choosing the right model depends on resources, expertise, and target clientele. Many successful businesses combine models, for instance, offering a trading platform along with educational and advisory services.
3. Building a Strong Technological Infrastructure
In modern trading, technology is a critical enabler of growth. Key technological elements include:
Trading Platforms: A reliable, fast, and secure platform attracts and retains clients. It should support multiple asset classes, real-time data, and customizable interfaces.
Algorithmic Trading: Automated strategies using algorithms can optimize execution, reduce human error, and handle large volumes efficiently.
Data Analytics: Access to market data and predictive analytics helps in decision-making, risk management, and personalized client services.
Mobile Access: With the rise of retail trading, mobile-friendly platforms ensure clients can trade anytime, anywhere, boosting engagement and revenue.
Investment in technology not only enhances operational efficiency but also differentiates a business in a highly competitive market.
4. Risk Management and Compliance
Trading inherently involves risk, and sustainable growth requires robust risk management practices:
Financial Risk: Hedging strategies, stop-loss orders, and portfolio diversification minimize losses.
Operational Risk: Internal processes, cybersecurity measures, and reliable infrastructure prevent disruptions.
Regulatory Compliance: Adhering to local and international regulations is critical. Non-compliance can result in fines, reputational damage, or license revocation.
Client Protection: Ensuring transparent policies, segregated accounts, and secure transactions builds trust and long-term client loyalty.
A business that prioritizes risk management gains credibility and positions itself as a trusted market participant.
5. Marketing and Client Acquisition
Growth in trading relies heavily on attracting and retaining clients. Effective strategies include:
Digital Marketing: SEO, social media, and content marketing can generate leads and enhance brand visibility.
Educational Programs: Hosting webinars, workshops, and tutorials not only educates potential clients but also establishes authority in the field.
Referral Programs: Incentivizing existing clients to refer new users accelerates growth organically.
Partnerships: Collaborations with financial influencers, fintech firms, or institutional investors expand reach and credibility.
Customer Experience: Seamless onboarding, responsive support, and intuitive interfaces improve client retention and lifetime value.
In a saturated market, marketing combined with trust-building is a key differentiator.
6. Diversification of Products and Services
Relying on a single revenue source can limit growth. Diversifying offerings allows businesses to tap into multiple market segments:
New Asset Classes: Expanding from stocks to derivatives, commodities, or crypto attracts a wider audience.
Portfolio Management: Offering managed accounts or robo-advisory services caters to clients seeking convenience.
Research and Insights: Subscription-based research reports, trading signals, or educational content create additional revenue streams.
Margin and Leverage Services: For experienced traders, providing margin trading enhances engagement and profitability.
Diversification mitigates risk while opening new channels for revenue generation.
7. Leveraging Strategic Partnerships and Networking
Networking and partnerships play a crucial role in scaling a trading business:
Institutional Partnerships: Collaborating with banks, funds, or brokerage houses provides access to large client bases and advanced trading infrastructure.
Technology Vendors: Partnerships with tech providers ensure the platform remains competitive and secure.
Educational Institutions: Partnering with universities and financial schools can attract aspiring traders and interns.
Global Expansion: Strategic alliances in other countries enable entry into new markets while navigating regulatory challenges.
Building a strong network creates opportunities for business growth and market penetration.
8. Continuous Learning and Market Adaptation
The trading market is dynamic, with constant technological, regulatory, and behavioral changes. Successful businesses embrace continuous learning:
Market Trends: Monitoring global economic indicators, industry reports, and emerging sectors helps anticipate opportunities.
Technological Innovation: Adopting blockchain, AI-driven analytics, and machine learning can improve trading performance and operational efficiency.
Customer Feedback: Understanding client needs, pain points, and preferences allows iterative improvements.
Competitor Analysis: Observing competitors’ strategies ensures the business remains competitive and innovative.
Adaptability is essential; firms that fail to evolve risk obsolescence.
9. Branding and Reputation Management
In trading, trust is currency. A strong brand communicates reliability and expertise:
Transparency: Open communication about fees, risks, and performance builds credibility.
Corporate Social Responsibility: Ethical trading, community engagement, and sustainable practices enhance reputation.
Thought Leadership: Publishing market analysis, insights, and white papers positions the firm as an industry authority.
Client Testimonials and Case Studies: Showcasing success stories reinforces trust and attracts new clients.
A reputable brand fosters loyalty, encourages referrals, and differentiates a business from competitors.
10. Scaling Operations Efficiently
Finally, as the business grows, operational efficiency ensures sustainability:
Automated Processes: Automating back-office operations, trade reconciliation, and reporting reduces costs.
Talent Acquisition: Hiring skilled traders, analysts, and technology experts strengthens core capabilities.
Scalable Infrastructure: Cloud-based systems and modular platforms accommodate growth without major overhauls.
Performance Metrics: Monitoring KPIs such as client acquisition cost, trading volume, and retention rate helps identify improvement areas.
Efficient scaling transforms incremental growth into long-term success.
Conclusion
Growing a business in the trading market requires a multifaceted approach combining strategy, technology, risk management, marketing, and operational excellence. Understanding market dynamics, building a robust platform, diversifying offerings, and prioritizing client trust are fundamental steps. Strategic partnerships, continuous learning, and reputation management further accelerate growth. By implementing these strategies thoughtfully and consistently, a trading business can not only survive but thrive in the competitive and ever-evolving financial markets.
In essence, growth in the trading market is not just about making profits—it is about creating a sustainable, innovative, and trusted ecosystem that adapts to change, attracts clients, and leverages technology effectively. Those who succeed are the ones who balance strategic foresight with operational discipline, constantly evolving to meet the demands of a dynamic global market.
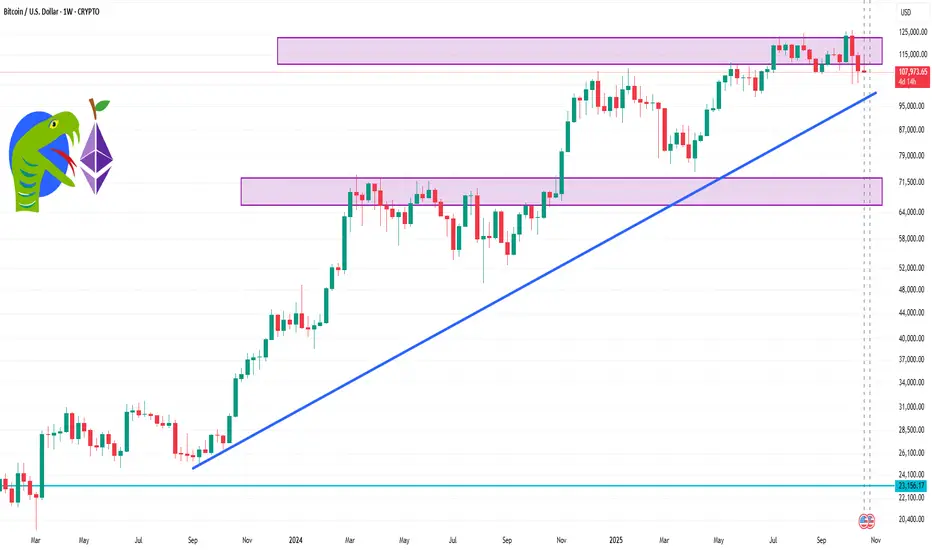
BTCUSD SHOWING A GOOD UP MOVE WITH 1:10 RISK REWARD BTCUSD SHOWING A GOOD
UP MOVE WITH 1:10 RISK REWARD
DUE TO THESE REASON
A. its following a rectangle pattern that stocked the market
which preventing the market to move any one direction now it trying to break the strong resistant lable
B. after the break of this rectangle it will boost the market potential for break
C. also its resisting from a strong neckline the neckline also got weeker ald the price is ready to break in the outer region
all of these reason are indicating the same thing its ready for breakout BREAKOUT trading are follws good risk reward
please dont use more than one percentage of your capitalfollow risk reward and tradeing rules
that will help you to to become a bettertrader
thank you

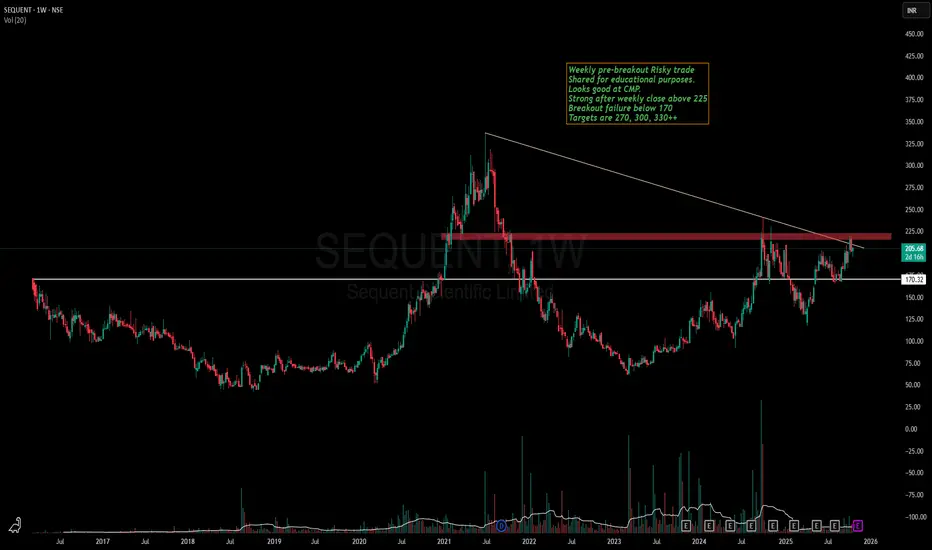
Sequent Scientific - Is it ready for a run towards ATH now?Sequent has been in my watchlist since the breakout of 170 levels.
Stock is making a good Higher high , Higher low pattern in weekly time frame and VCP in lower time frame.
Recently stock gave breakout of a strong resistance zone of 190-200 and is currently consolidating above the same.
If the breakout of 225 happens, we might see stock making a new ATH soon.
Keep this stock in watchlist and lets learn together how the patterns unveils.
This is not a recommendation and idea shared only for educational purposes
I am a NISM Certified RA & not SEBI registered.