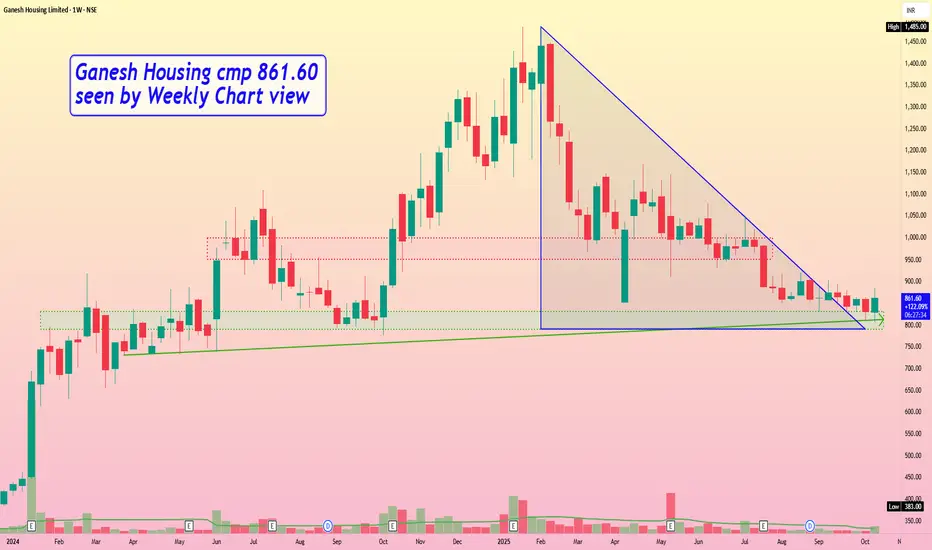
Ganesh Housing cmp 861.60 by Weekly Chart viewGanesh Housing cmp 861.60 by Weekly Chart view
- Support Zone 790 to 830 Price Band
- Resistance Zone 950 to 1000 Price Band
- Descending Triangle Breakout in the making process
- Support Zone seems tested retested over the past few weeks
- Volumes are flat, need to increase for fresh upside price movement
Trend Lines
#BTCUSD #CRYPTOA classical Descending Triangle breakout on hourly chart of BTCUSD
Executed fresh shorts few hours ago posting a bit late due network issues.

25500++ is here!!! heading towards new ATH!!??As we can see NIFTY finally achieved our target and also broke above the important supply zone and psychological level of 25500 with ease and managed to close above. Moreover, it has formed a strong bullish candle with volume and if tomorrow it manages to close above 25550, we will see a strong weekly candle too hence tomorrows day and closing can be crucial for deciding upcoming rally in market so plan your trades accordingly and keep watching everyone.

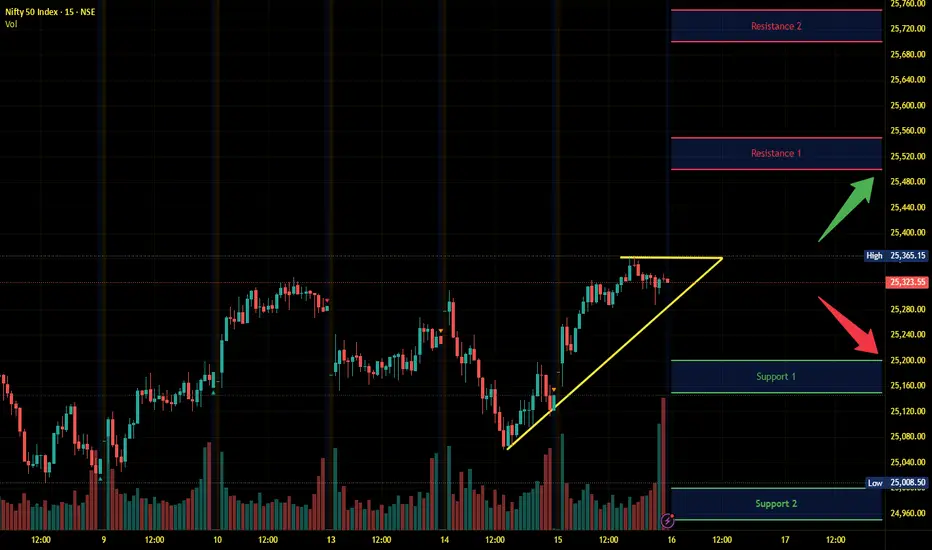
Nifty Intraday Analysis for 16th October 2025NSE:NIFTY
Momentum is shifting upward.
Index has resistance near 25500 – 25550 range and if index crosses and sustains above this level then may reach near 25700 – 25750 range.
Nifty has immediate support near 25200 – 25150 range and if this support is broken then index may tank near 25000 – 24950 range.
Banknifty Intraday Analysis for 16th October 2025NSE:BANKNIFTY
Momentum is shifting upward.
Index has resistance near 57200 – 57300 range and if index crosses and sustains above this level then may reach near 57700– 57800 range.
Banknifty has immediate support near 56400 - 56300 range and if this support is broken then index may tank near 55900 - 55800 range.

Finnifty Intraday Analysis for 16th October 2025NSE:CNXFINANCE
Momentum is shifting upward.
Index has resistance near 27250 - 27300 range and if index crosses and sustains above this level then may reach near 27450 - 27500 range.
Finnifty has immediate support near 26925– 26875 range and if this support is broken then index may tank near 26725 – 26675 range.

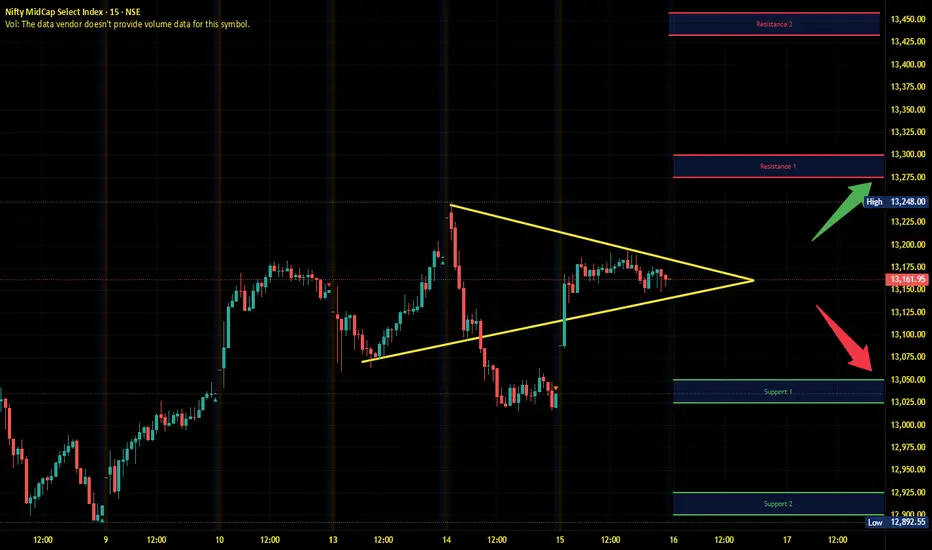
Midnifty Intraday Analysis for 16th October 2025NSE:NIFTY_MID_SELECT
Momentum is shifting upward.
Index has immediate resistance near 13275 – 13300 range and if index crosses and sustains above this level then may reach 13425 – 13450 range.
Midnifty has immediate support near 13050 – 13025 range and if this support is broken then index may tank near 12925 – 12900 range.
NIFTY The Nifty has moved up nicely after opening strong above the trend line. The first resistance is at 25,650, and the second is near the all-time high. Let's see what happens tomorrow, as it's Friday. Hopefully, Donald Trump isn't upset or planning any actions that could turn the market bearish.

The Rise of the Indian Stock MarketIntroduction
The Indian stock market has undergone a phenomenal transformation over the past three decades, evolving from a largely unregulated and paper-based trading system into one of the most dynamic and technologically advanced financial markets in the world. Once perceived as volatile and opaque, India’s equity market has now become a pillar of the nation’s economic growth, attracting both domestic and global investors. This rise is not just a reflection of corporate profitability or market capitalization—it symbolizes India’s journey toward financial maturity, economic resilience, and global competitiveness.
The rise of the Indian stock market is a story shaped by reforms, innovation, globalization, and a growing culture of financial participation. From the establishment of modern stock exchanges like the NSE to the adoption of cutting-edge technology and the inclusion of millions of retail investors, India’s capital market has become a robust ecosystem that supports entrepreneurship, infrastructure, and economic expansion.
Historical Evolution of the Indian Stock Market
The origins of the Indian stock market can be traced back to the Bombay Stock Exchange (BSE), established in 1875, making it one of the oldest stock exchanges in Asia. However, for much of its early history, the market was dominated by a small group of brokers and traders, with limited transparency and accessibility. The real transformation began in the 1990s, when India embarked on a series of economic liberalization reforms.
The 1991 economic reforms, spearheaded by then Finance Minister Dr. Manmohan Singh, marked a turning point. India opened its economy to global competition, reduced trade barriers, and modernized financial systems. These reforms created the foundation for a modern capital market structure.
In 1992, the establishment of the Securities and Exchange Board of India (SEBI) as the market regulator played a crucial role in enforcing transparency, protecting investors, and curbing malpractices. The same year saw the Harshad Mehta scam, which exposed systemic weaknesses but also accelerated regulatory modernization. The subsequent launch of the National Stock Exchange (NSE) in 1994 brought technological innovation and electronic trading, replacing the traditional open outcry system.
Technological Advancements and Market Modernization
Technology has been the single most important driver of efficiency in the Indian stock market. The introduction of electronic trading systems by NSE revolutionized how securities were bought and sold. It eliminated the physical share certificates and enabled dematerialization, making trading faster, safer, and more transparent.
The establishment of National Securities Depository Limited (NSDL) in 1996 and Central Depository Services Limited (CDSL) in 1999 allowed investors to hold securities in electronic form. This move significantly reduced the risks of forgery, delays, and settlement failures.
With the advent of online trading platforms, mobile applications, and discount brokers, the stock market became more accessible to retail investors. Platforms like Zerodha, Groww, and Upstox have democratized participation by allowing individuals to trade at minimal cost with just a smartphone. The rise of algorithmic trading and high-frequency trading (HFT) further enhanced liquidity and market depth.
Today, the Indian stock market operates on a T+1 settlement cycle, one of the fastest globally, showcasing its efficiency and readiness for the digital age.
Growth in Market Capitalization and Global Standing
The Indian equity market has grown exponentially in terms of market capitalization. As of 2025, India’s total market capitalization exceeds USD 5 trillion, making it the fifth-largest stock market in the world, surpassing major economies like the UK and France.
Indices such as the Nifty 50 and Sensex have delivered substantial long-term returns, reflecting strong corporate performance and economic growth. The Sensex, which stood at around 1,000 points in 1990, has now crossed 80,000 points, symbolizing the massive wealth creation potential of the Indian market.
India’s rise has also been fueled by inclusion in global investment indices such as the MSCI Emerging Markets Index, which has drawn billions in Foreign Institutional Investor (FII) inflows. Despite global volatility, India’s market remains one of the most resilient, backed by a strong domestic investor base.
The Role of Domestic Investors
One of the most defining features of the Indian stock market’s rise has been the growing participation of domestic investors. Traditionally, Indian households preferred gold, real estate, and fixed deposits as investment avenues. However, over the last decade, a financial literacy wave and increased access to digital investment platforms have encouraged millions to invest in equities and mutual funds.
The number of Demat accounts in India has surged from around 2 crore in 2014 to over 15 crore by 2025. Systematic Investment Plans (SIPs) have become a cultural phenomenon, with monthly inflows surpassing ₹20,000 crore in 2025. This consistent domestic participation provides a stable base of liquidity and reduces dependency on foreign capital.
The rise of retail investors has also changed market dynamics. Retail participation now accounts for over 40% of total trading volume, bringing diversification and depth to the equity market. This broad-based engagement makes the Indian market less vulnerable to foreign outflows during global shocks.
Policy Reforms and Regulatory Strength
The rise of India’s stock market is inseparable from the country’s robust regulatory framework. SEBI, as the watchdog of capital markets, has implemented reforms to ensure transparency, fairness, and investor protection. Key policy initiatives include:
Implementation of Disclosure Norms: Companies are required to disclose financial and operational details regularly to ensure transparency.
Corporate Governance Reforms: The introduction of independent directors, audit committees, and stricter compliance mechanisms has improved trust in listed companies.
Market Surveillance: Advanced monitoring systems detect suspicious trading patterns and insider trading.
Investor Education Programs: SEBI conducts workshops and campaigns to promote financial literacy.
Ease of Listing: The introduction of the SME Platform and Innovators Growth Platform (IGP) enables startups and small enterprises to raise capital efficiently.
Additionally, tax incentives, liberalization of FDI norms, and the establishment of the GIFT City (Gujarat International Finance Tec-City) as an international financial hub have strengthened India’s global appeal.
Integration with Global Markets
India’s integration with global capital markets has been a vital catalyst for its stock market growth. The liberalization of foreign investment norms in the early 1990s allowed Foreign Institutional Investors (FIIs) and Foreign Portfolio Investors (FPIs) to participate actively in Indian equities. Today, FIIs hold a significant share in top Indian companies, contributing to liquidity and global visibility.
Global financial institutions like Goldman Sachs, BlackRock, and Vanguard have a major presence in India. The introduction of GIFT Nifty, an international version of Nifty trading in USD at GIFT City, has further strengthened India’s connection with global investors, allowing round-the-clock trading linked to global time zones.
This global integration not only brings foreign capital but also instills best practices in governance, risk management, and compliance.
Sectoral Growth and Corporate Expansion
The Indian stock market’s rise has been powered by the growth of multiple sectors. The IT sector, led by companies like Infosys, TCS, and Wipro, established India as a global technology hub. The banking and financial services sector has seen massive expansion, driven by private banks and NBFCs. The pharmaceutical, automobile, and energy sectors have also played crucial roles.
The emergence of new-age companies in e-commerce, fintech, and renewable energy—such as Zomato, Paytm, and Adani Green Energy—has diversified the market landscape. India’s start-up ecosystem, now the world’s third-largest, increasingly taps equity markets for funding, reflecting the market’s role in supporting innovation and entrepreneurship.
Impact of Macroeconomic Factors
India’s sustained GDP growth, demographic dividend, and policy stability have all contributed to the stock market’s rise. The country’s young population, rising middle-class consumption, and growing digital economy fuel long-term corporate earnings growth. Additionally, fiscal measures like Goods and Services Tax (GST) and Production Linked Incentive (PLI) schemes have boosted formalization and manufacturing competitiveness.
Even during global crises such as the COVID-19 pandemic, India’s markets rebounded sharply due to monetary support from the Reserve Bank of India (RBI), government stimulus, and strong retail investor confidence. This resilience highlights India’s growing independence from external shocks.
Challenges and Risks Ahead
Despite its remarkable progress, the Indian stock market faces several challenges:
Market Volatility: Global economic uncertainties and geopolitical tensions can trigger sharp fluctuations.
Corporate Governance Issues: While regulations have improved, lapses in governance occasionally erode investor trust.
Valuation Concerns: At times, high valuations raise concerns of speculative bubbles.
Dependence on Policy Support: Excessive reliance on government incentives could distort market efficiency.
Financial Literacy Gap: A significant section of the population still lacks understanding of market risks and diversification.
Addressing these issues is essential to sustain long-term growth and stability.
The Road Ahead
The future of the Indian stock market looks promising. With projections indicating that India could become the third-largest economy by 2030, the equity market is poised to expand further. The government’s continued focus on infrastructure development, digital transformation, and manufacturing growth under initiatives like Make in India will provide significant momentum.
Emerging trends such as sustainable investing (ESG), AI-driven trading analytics, and financial inclusion will define the next phase of growth. Moreover, the deepening of bond markets, REITs, and InvITs will diversify India’s capital market landscape.
If reforms continue and investor education expands, the Indian stock market could well emerge as a global powerhouse, rivaling mature markets in the U.S. and Europe.
Conclusion
The rise of the Indian stock market is a testament to the country’s economic resilience, policy vision, and technological innovation. From a fragmented system in the 1980s to a digital-first, globally integrated marketplace in 2025, India’s equity market has come a long way. It has empowered investors, funded industries, and contributed significantly to national growth.
As India stands on the cusp of becoming a global economic leader, its stock market will continue to play a crucial role—not only as a barometer of economic health but as a driver of wealth creation and innovation. The journey of the Indian stock market is far from over; it is entering a new phase of maturity, global relevance, and inclusiveness that promises a bright financial future for millions of investors and the nation as a whole.
Why Traders Prefer Momentum Strategies1. Understanding Momentum Trading
Momentum trading involves identifying securities that are moving significantly in one direction with high volume and capitalizing on the continuation of that trend. Unlike value investing, which focuses on fundamental valuation, momentum trading is primarily price action driven. Traders do not necessarily care about the intrinsic value of a stock; rather, they seek trends and patterns that indicate future price movement.
Momentum strategies can be applied across various time frames—from intraday scalping to long-term swing trading, making it versatile for traders with different risk appetites.
2. Behavioral Basis of Momentum
One reason traders prefer momentum strategies is that they align with human behavioral tendencies in financial markets. Two key behavioral biases drive momentum:
Herd Behavior: Investors tend to follow the crowd, buying assets that are trending upward or selling assets that are trending downward.
Overreaction and Underreaction: Markets often overreact to news or earnings, creating short-term trends that momentum traders exploit.
Momentum strategies allow traders to capitalize on these predictable psychological patterns, rather than attempting to forecast exact valuations or market turning points.
3. Technical Simplicity
Momentum trading is often technically straightforward to implement. Traders rely on indicators like:
Moving Averages (MA): Identifies the direction of the trend.
Relative Strength Index (RSI): Highlights overbought or oversold conditions.
MACD (Moving Average Convergence Divergence): Tracks momentum shifts.
Volume Indicators: Confirm trend strength.
These tools enable traders to quickly analyze market behavior, which makes momentum strategies appealing even to traders with limited experience.
4. High Profit Potential
One of the primary reasons traders prefer momentum strategies is the potential for high returns in short time frames. When a trend is strong, the profit potential can exceed what might be possible through traditional buy-and-hold strategies. By entering a trend early and exiting before it reverses, traders can maximize gains while limiting exposure to long-term market uncertainties.
5. Flexibility Across Market Conditions
Momentum strategies can be adapted to various market environments:
Bull Markets: Traders ride upward trends in growth stocks, indices, or sectors.
Bear Markets: Momentum traders can short-sell declining assets, profiting from negative trends.
Sideways Markets: Even in range-bound markets, momentum traders can use oscillators like RSI to capture mini-trends.
This adaptability makes momentum trading attractive in both rising and falling markets, unlike strategies that depend solely on market appreciation.
6. Speed and Agility
Modern traders have access to high-speed trading platforms and real-time market data, which makes momentum strategies feasible and efficient. Momentum traders can enter and exit positions within minutes or hours, exploiting price inefficiencies as they occur. This speed is particularly appealing to active traders who want rapid feedback on their strategies.
7. Empirical Evidence Supporting Momentum
Research in financial markets consistently shows that momentum strategies can produce positive abnormal returns over time. Studies by Jegadeesh and Titman (1993) and others indicate that:
Stocks that perform well over the past 3–12 months tend to outperform in the following months.
Momentum effects are observed globally across equities, commodities, and even cryptocurrencies.
The empirical evidence reinforces traders’ confidence in using momentum strategies as a reliable approach to capitalizing on trends.
8. Reduced Reliance on Fundamental Analysis
Momentum strategies appeal to traders who prefer technical over fundamental analysis. Instead of analyzing balance sheets, cash flows, or macroeconomic indicators, momentum traders focus on price and volume behavior, enabling:
Quicker decision-making
Simplified trade execution
Reduced exposure to complex financial statements
For traders who value speed and simplicity, this approach is far more practical.
9. Integration with Risk Management
Momentum trading can be systematically combined with risk management techniques, making it attractive for professional traders. Common methods include:
Stop-loss orders: Automatically exit losing trades.
Position sizing: Adjusting trade size according to volatility.
Trailing stops: Lock in profits as trends continue.
By pairing momentum strategies with disciplined risk control, traders can maximize upside potential while limiting downside risk.
10. Psychological Advantages
Momentum trading provides clear, objective entry and exit signals, which helps traders avoid emotional decision-making—a common pitfall in trading. Knowing when to buy or sell based on predefined criteria can reduce anxiety and hesitation, which is particularly valuable in fast-moving markets.
Additionally, successful momentum trades can reinforce trader confidence, creating a positive feedback loop that encourages disciplined execution of strategies.
11. Scalability Across Asset Classes
Momentum strategies are not limited to equities. Traders often apply momentum principles to:
Commodities (gold, oil)
Forex markets
Cryptocurrencies
ETFs and indices
This versatility makes momentum trading a universal tool, appealing to traders with diverse portfolios.
12. Drawbacks and Considerations
While momentum strategies are popular, traders must also be aware of potential pitfalls:
Trend Reversals: Momentum can fade abruptly, resulting in losses.
High Transaction Costs: Frequent trading can lead to increased brokerage and slippage.
Overcrowding: Popular momentum trades can attract many participants, reducing profitability.
Successful momentum traders mitigate these risks through strict discipline, risk management, and continuous monitoring.
13. Momentum in Algorithmic Trading
The rise of algorithmic and quantitative trading has amplified the appeal of momentum strategies. Algorithms can:
Detect micro-trends faster than humans
Execute trades in milliseconds
Adapt to changing market conditions
This has made momentum strategies even more efficient and profitable, particularly in high-frequency and institutional trading environments.
14. Conclusion
Traders prefer momentum strategies because they offer a combination of high-profit potential, technical simplicity, and adaptability across market conditions. Momentum trading aligns with human behavioral tendencies, leverages empirical evidence of trend persistence, and can be integrated with robust risk management practices. While not without challenges, the speed, scalability, and psychological clarity of momentum trading make it one of the most attractive strategies for traders ranging from retail investors to large institutional funds.
In essence, momentum trading capitalizes on the market’s natural tendencies to trend in patterns, allowing traders to ride waves of price action with discipline, precision, and profitability.
Option Greeks and Advanced Hedging Strategies1. Introduction to Option Greeks
Options are derivative instruments that derive their value from an underlying asset, such as stocks, indices, commodities, or currencies. Unlike equities, the price of an option depends on several factors, including the underlying asset's price, volatility, time to expiration, and interest rates. Option Greeks quantify how sensitive an option’s price is to these variables, offering actionable insights into risk management.
There are five primary Greeks: Delta, Gamma, Theta, Vega, and Rho. Each provides a unique perspective on the risks and potential rewards associated with holding an option. Understanding these Greeks is critical for designing hedging strategies, structuring trades, and managing portfolio exposure.
2. Delta (Δ): Price Sensitivity to the Underlying
Delta measures the sensitivity of an option’s price to a $1 change in the price of the underlying asset. It ranges from 0 to 1 for call options and -1 to 0 for put options.
Call Options: Delta ranges from 0 to +1. A delta of 0.5 implies that if the underlying asset rises by $1, the option’s price will increase by $0.50.
Put Options: Delta ranges from -1 to 0. A delta of -0.5 indicates that a $1 increase in the underlying asset decreases the put option’s price by $0.50.
Delta also represents the probability of an option expiring in-the-money (ITM). For example, a delta of 0.7 suggests a 70% chance of finishing ITM. Traders use delta to gauge directional exposure, and delta can also serve as a foundational element in hedging strategies such as delta-neutral hedging, which will be discussed later.
3. Gamma (Γ): Rate of Change of Delta
Gamma measures the rate of change of delta in response to a $1 change in the underlying asset. While delta provides a linear approximation, gamma accounts for the curvature of option pricing.
High gamma indicates that delta can change significantly with small movements in the underlying asset, which is common for at-the-money (ATM) options nearing expiration.
Low gamma implies more stable delta, typical of deep-in-the-money (ITM) or far-out-of-the-money (OTM) options.
Gamma is crucial for traders managing delta-neutral portfolios. A high gamma position requires frequent rebalancing to maintain neutrality, as the delta shifts rapidly with price movements.
4. Theta (Θ): Time Decay of Options
Theta measures the sensitivity of an option’s price to the passage of time, assuming all other factors remain constant. Time decay is especially significant for options traders, as options lose value as expiration approaches.
Long options (buying calls or puts) have negative theta, meaning they lose value over time.
Short options (selling calls or puts) have positive theta, benefiting from the erosion of time value.
Theta is a critical factor in strategies such as calendar spreads or short straddles, where time decay can be exploited to generate profit.
5. Vega (ν): Sensitivity to Volatility
Vega measures an option’s sensitivity to changes in the volatility of the underlying asset. Volatility reflects market uncertainty; higher volatility increases the probability that an option will expire ITM, thus raising its premium.
Long options benefit from rising volatility (positive vega).
Short options benefit from declining volatility (negative vega).
Understanding vega is essential for strategies like straddles, strangles, and volatility spreads, where traders aim to profit from changes in implied volatility rather than directional price movements.
6. Rho (ρ): Sensitivity to Interest Rates
Rho measures the sensitivity of an option’s price to changes in the risk-free interest rate. While often overlooked in equity options due to low short-term interest rate fluctuations, rho becomes important for long-dated options (LEAPS) or currency options.
Call options increase in value with rising interest rates (positive rho).
Put options decrease in value with rising interest rates (negative rho).
Rho is generally less significant for short-term trading but critical for interest rate-sensitive instruments.
7. Combining Greeks for Holistic Risk Management
Individually, each Greek provides insight into one risk factor. However, professional traders consider them collectively to understand an option's total risk profile.
Delta addresses directional risk.
Gamma adjusts for changes in delta.
Theta manages time decay exposure.
Vega quantifies volatility risk.
Rho handles interest rate risk.
By monitoring these Greeks, traders can develop robust hedging strategies that dynamically adjust to market conditions.
8. Advanced Hedging Strategies
Hedging in options trading involves taking positions that offset risk in an underlying asset or portfolio. Advanced strategies often combine multiple Greeks to achieve delta-neutral, gamma-neutral, or vega-sensitive hedges, minimizing exposure to adverse market movements.
8.1 Delta-Neutral Hedging
Delta-neutral strategies aim to neutralize the directional exposure of a portfolio. Traders adjust their positions in the underlying asset or options to achieve a net delta of zero.
Example: Holding a long call option (delta = 0.6) and shorting 60 shares of the underlying stock (delta = -1 per share) results in a delta-neutral position.
Benefits: Protects against small price movements, ideal for traders who want to profit from volatility or time decay.
Limitations: Requires frequent rebalancing, especially with high gamma positions.
8.2 Gamma Hedging
Gamma hedging focuses on controlling the rate of change of delta. High gamma positions can result in delta swings, exposing traders to unexpected losses.
Traders achieve gamma neutrality by combining options with offsetting gamma values.
Example: A long ATM call (high gamma) may be hedged with OTM calls or puts to stabilize delta changes.
Benefits: Provides stability for delta-neutral portfolios.
Limitations: Complex to implement and can involve high transaction costs.
8.3 Vega Hedging
Vega hedging mitigates volatility risk. Traders who expect volatility to fall may sell options (short vega) while hedging long options (positive vega) to offset exposure.
Example: A trader long on an option may sell a different option with similar vega exposure to create a neutral vega position.
Benefits: Protects against unexpected spikes or drops in implied volatility.
Limitations: Requires deep understanding of options pricing and volatility behavior.
8.4 Theta Management and Calendar Spreads
Theta management involves leveraging time decay to generate income while maintaining a controlled risk profile.
Calendar spreads involve buying long-dated options and selling short-dated options on the same underlying asset.
Traders profit as the short-term option decays faster than the long-term option, benefiting from positive theta differential.
Benefits: Generates steady income and exploits time decay patterns.
Limitations: Sensitive to volatility changes, requiring careful vega management.
8.5 Multi-Greek Hedging
Professional traders often hedge portfolios using combinations of Greeks to achieve a multi-dimensional hedge.
Delta-Gamma-Vega Hedging: Neutralizes directional risk, delta swings, and volatility exposure simultaneously.
Useful for institutional traders managing large, complex portfolios where single-Greek hedges are insufficient.
Requires continuous monitoring and dynamic rebalancing to adapt to changing market conditions.
9. Practical Considerations in Hedging
While advanced Greek-based hedging strategies offer theoretical precision, practical implementation involves challenges:
Transaction Costs: Frequent rebalancing and multiple trades can reduce profitability.
Liquidity Risk: Some options may lack sufficient market liquidity, complicating execution.
Model Risk: Greeks are derived from mathematical models like Black-Scholes; real-world deviations can affect hedging effectiveness.
Market Gaps: Sudden, large price moves may bypass delta or gamma adjustments, leading to losses.
Traders must weigh the trade-offs between hedge precision and operational feasibility.
10. Real-World Applications
Option Greeks and hedging strategies are widely used in various contexts:
Institutional Portfolios: Delta-gamma-vega hedges protect large portfolios from market shocks.
Volatility Trading: Traders exploit implied vs. realized volatility differences using vega strategies.
Income Generation: Theta-positive strategies like covered calls and credit spreads provide steady cash flows.
Risk Management: Corporations with exposure to commodity prices or foreign exchange rates use option hedges to stabilize earnings.
11. Conclusion
Option Greeks are indispensable tools for understanding and managing the risks inherent in options trading. They provide a quantitative framework for measuring price sensitivity to underlying asset movements, time decay, volatility changes, and interest rates. Advanced hedging strategies leverage these Greeks to create positions that mitigate directional, volatility, and time-related risks.
While Greek-based hedging can be complex, the benefits are substantial: enhanced risk control, improved portfolio stability, and the ability to profit in diverse market conditions. Success requires a deep understanding of each Greek, continuous monitoring of market dynamics, and a disciplined approach to portfolio management. By mastering Option Greeks and advanced hedging strategies, traders gain a powerful edge in navigating the sophisticated world of derivatives trading.
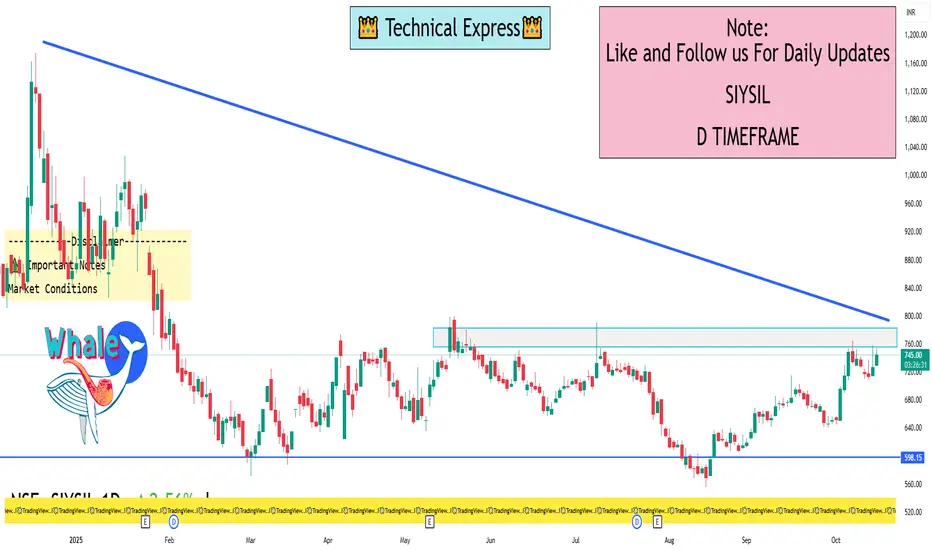
SIYSIL 1 Day View 📊 Intraday Support and Resistance Levels
Support Levels:
708.53 (Classic Pivot S1)
690.67 (Classic Pivot S2)
666.33 (Classic Pivot S3)
Resistance Levels:
750.73 (Classic Pivot R1)
775.07 (Classic Pivot R2)
792.93 (Classic Pivot R3)
These levels are based on the previous day's price range and are commonly used by traders to identify potential entry and exit points.
Understanding Equity Market Structure in IndiaIntroduction
The equity market, often called the stock market, serves as the backbone of a country’s financial ecosystem. In India, it represents the vibrant and ever-evolving marketplace where companies raise capital and investors participate in wealth creation. Understanding the equity market structure in India is essential for anyone involved in trading, investing, or policymaking. It provides insight into how the market operates, who its participants are, how securities are traded, and how regulation ensures transparency and fairness.
India’s equity market has come a long way—from physical trading floors in the 1980s to a fully electronic, globally integrated system today. The structure comprises various layers, institutions, and participants, each performing specific roles to ensure the efficient functioning of the capital market.
1. Evolution of the Indian Equity Market
The Indian stock market has a rich history dating back to the 19th century when the Bombay Stock Exchange (BSE) was established in 1875. Initially, trading was informal, conducted under banyan trees in Mumbai by a group of brokers. However, with the liberalization of the Indian economy in 1991, the market witnessed modernization and rapid growth.
The introduction of the National Stock Exchange (NSE) in 1992 brought electronic trading, transparency, and efficiency. The Securities and Exchange Board of India (SEBI), formed in 1988 and granted statutory powers in 1992, became the principal regulator ensuring investor protection and market discipline. Today, India boasts one of the most advanced and liquid equity markets among emerging economies.
2. Structure of the Indian Equity Market
The Indian equity market operates through a two-tier structure:
Primary Market – where companies issue new shares to raise capital.
Secondary Market – where existing shares are traded among investors.
Let’s explore each in detail.
(a) The Primary Market
The primary market facilitates capital formation. Companies issue securities for the first time through Initial Public Offerings (IPOs), Follow-on Public Offers (FPOs), or Rights Issues. Investors purchase shares directly from the issuing company, and the proceeds are used for business expansion, debt repayment, or diversification.
Key participants include:
Issuing companies
Merchant bankers
Underwriters
Registrars
Investors
Regulation of the primary market is handled by SEBI, which ensures full disclosure of financial information, proper valuation, and transparent allotment processes. The IPO process in India involves book-building, anchor investors, and electronic bidding through platforms like ASBA (Application Supported by Blocked Amount).
(b) The Secondary Market
Once shares are listed on exchanges, they become tradable in the secondary market. Here, investors buy and sell shares through brokers on recognized exchanges such as NSE and BSE. The secondary market ensures liquidity and continuous price discovery.
Trades occur electronically through order-matching systems, with prices determined by demand and supply. This digital infrastructure has enhanced speed, accuracy, and transparency.
3. Major Stock Exchanges in India
India’s equity trading primarily occurs on two major exchanges:
(a) Bombay Stock Exchange (BSE)
Founded in 1875, BSE is Asia’s oldest exchange and one of the fastest in the world. Its benchmark index, SENSEX, tracks the performance of 30 top companies representing key sectors of the Indian economy. The BSE provides a wide range of products including equities, mutual funds, derivatives, and debt instruments.
(b) National Stock Exchange (NSE)
Established in 1992, NSE revolutionized Indian trading by introducing a fully automated, screen-based trading system. Its benchmark index, NIFTY 50, reflects the performance of the top 50 companies listed on the exchange. NSE is the largest exchange in India by trading volume and market capitalization.
Other regional exchanges such as Calcutta Stock Exchange (CSE) and Metropolitan Stock Exchange (MSE) exist but play a minor role compared to NSE and BSE.
4. Key Participants in the Indian Equity Market
The structure of the equity market is defined by the roles of various participants who ensure smooth operations.
(a) Investors
Investors are the backbone of the equity market and include:
Retail investors – individuals investing small amounts.
High Net-Worth Individuals (HNIs) – individuals with significant investable wealth.
Institutional investors – such as Mutual Funds, Pension Funds, Insurance Companies, and Foreign Portfolio Investors (FPIs).
(b) Brokers and Sub-brokers
Brokers are SEBI-registered members of exchanges who facilitate trading on behalf of clients. Sub-brokers operate under registered brokers to provide localized access to investors.
(c) Market Makers and Dealers
Market makers ensure liquidity by providing continuous buy and sell quotes. Dealers, on the other hand, trade securities on their own account.
(d) Depositories and Depository Participants (DPs)
India has two main depositories:
NSDL (National Securities Depository Limited)
CDSL (Central Depository Services Limited)
These institutions hold securities in dematerialized (Demat) form and facilitate the electronic transfer of ownership. DPs act as intermediaries between investors and depositories.
(e) Clearing Corporations
Entities like the National Securities Clearing Corporation Limited (NSCCL) and Indian Clearing Corporation Limited (ICCL) manage trade settlement, ensuring that funds and securities are exchanged efficiently and securely.
(f) Regulators
The Securities and Exchange Board of India (SEBI) regulates the equity market, ensuring transparency, investor protection, and compliance. The Reserve Bank of India (RBI) and Ministry of Finance also play supportive regulatory roles.
5. Trading Mechanism and Settlement Process
The Indian equity market uses an order-driven, automated trading system where buyers and sellers place orders through brokers using trading terminals.
Steps in the Trading Process:
Placing the order – The investor instructs the broker to buy or sell shares.
Order matching – The exchange’s electronic system matches buy and sell orders based on price and time priority.
Trade confirmation – Once matched, the trade is confirmed and recorded.
Clearing and settlement – Managed by clearing corporations.
India follows a T+1 settlement cycle (trade plus one business day).
Shares are credited to the buyer’s Demat account, and funds are transferred to the seller’s account.
This efficient system ensures minimal counterparty risk and prompt settlement.
6. Market Segments within the Equity Market
The equity market in India can be divided into various segments:
(a) Cash Market
Here, stocks are bought and sold for immediate delivery. The buyer gains ownership immediately after settlement.
(b) Derivatives Market
This includes trading in Futures and Options (F&O) contracts, where traders speculate on price movements or hedge risk. The derivative market in India has grown exponentially, making NSE one of the largest F&O exchanges globally.
(c) Institutional Trading Platforms (ITPs)
These allow unlisted companies, particularly startups, to raise capital and trade shares among institutional investors before going for a full IPO.
7. Indices and Market Benchmarks
Indices serve as barometers for market performance. The two most tracked indices are:
BSE SENSEX – tracks 30 large, financially sound companies.
NSE NIFTY 50 – represents 50 top companies across sectors.
Other sectoral and thematic indices include:
NIFTY Bank, NIFTY IT, NIFTY FMCG, etc.
These help investors gauge performance in specific industries.
8. Regulatory Framework
(a) Role of SEBI
SEBI’s mission is to protect investors, regulate intermediaries, and promote market development. Its major functions include:
Ensuring fair practices in IPOs and secondary market trading.
Monitoring insider trading and market manipulation.
Registering and supervising intermediaries like brokers, merchant bankers, and portfolio managers.
Implementing investor grievance mechanisms.
(b) Other Regulatory Bodies
RBI regulates capital inflows and outflows.
Ministry of Corporate Affairs (MCA) oversees corporate governance.
Stock Exchanges enforce listing obligations and compliance norms.
9. Technological Advancements and Digitalization
Technology has transformed the Indian equity market, making it more accessible and efficient.
Key innovations include:
Online trading platforms like Zerodha, Groww, and Upstox democratized investing for retail participants.
Algorithmic trading and High-Frequency Trading (HFT) increased liquidity and efficiency.
Mobile-based trading enabled real-time market participation.
Blockchain and AI tools are emerging for risk analysis and settlement processes.
The transition to a T+1 settlement cycle and the potential move toward instant settlement (T+0) further demonstrate India’s leadership in market modernization.
10. Foreign Participation and Global Integration
India’s equity market attracts global investors due to its growth potential, regulatory transparency, and robust infrastructure. Foreign Portfolio Investors (FPIs) play a key role, bringing in capital and global best practices.
FPIs invest in listed equities and debt instruments, regulated by SEBI.
Foreign Direct Investment (FDI), on the other hand, involves long-term investments in companies.
Global indices such as MSCI and FTSE include Indian equities, enhancing international visibility and liquidity.
11. Challenges in the Indian Equity Market
Despite its progress, the Indian equity market faces challenges such as:
Market volatility due to global economic uncertainty.
Low financial literacy among retail investors.
Corporate governance issues in some listed firms.
Regulatory complexity for foreign investors.
High concentration of trading in a few large-cap stocks.
Efforts by SEBI, stock exchanges, and financial institutions aim to address these challenges through education, transparency, and inclusive market policies.
12. Future Outlook of the Indian Equity Market
The future of India’s equity market looks promising. Several trends indicate robust growth potential:
Increased retail participation fueled by digital access and financial awareness.
Integration with global markets through international listings and GIFT City initiatives.
Expansion of derivative and SME platforms enhancing depth and liquidity.
Sustainable and ESG investing gaining traction among institutional investors.
AI-driven analytics reshaping trading strategies and investment decisions.
With India projected to become the world’s third-largest economy, its equity market will play a pivotal role in channeling capital to productive sectors and driving economic growth.
Conclusion
The Indian equity market is a dynamic and well-regulated system that has evolved into a cornerstone of the country’s financial stability and economic expansion. Its structure—comprising the primary and secondary markets, diverse participants, robust exchanges, and stringent regulatory oversight—ensures efficient capital allocation, investor protection, and continuous innovation.
From the traditional trading floors of the Bombay Stock Exchange to the algorithm-driven platforms of the modern era, India’s equity market reflects a journey of progress, resilience, and transformation. As digitalization, globalization, and financial inclusion continue to advance, the market’s structure will further strengthen, making it a global benchmark for transparency and growth in emerging economies.
Introduction to High Time Frame (HTF) Trading1. Understanding the Concept of High Time Frame (HTF) Trading
High Time Frame (HTF) trading is an approach where traders base their decisions on higher-duration charts such as the daily (1D), weekly (1W), or monthly (1M) time frames. Unlike short-term traders who focus on intraday fluctuations or minute-to-minute changes, HTF traders analyze the broader market structure to identify long-term trends, key support and resistance levels, and major reversals.
The goal of HTF trading is to align trades with the dominant market trend while minimizing the impact of short-term volatility and noise. It is a strategy favored by swing traders, position traders, and long-term investors who prefer a more patient, structured, and disciplined approach to market participation.
In essence, HTF trading is not about predicting short-term price movements but about understanding the bigger picture of market direction and trading with higher conviction.
2. The Importance of Time Frames in Trading
In trading, time frames determine how data is visualized on a chart. Each candlestick or bar represents a specific duration of price activity. For instance, in a 1-hour chart, each candle shows the open, high, low, and close within that hour. Similarly, in a weekly chart, each candle represents the price action of an entire week.
The choice of time frame shapes the trader’s strategy:
Low Time Frames (LTFs) – like 1-minute, 5-minute, or 15-minute charts – are used by scalpers and intraday traders for quick trades and small profits.
Medium Time Frames (MTFs) – such as 1-hour or 4-hour charts – help swing traders capture short-term trends.
High Time Frames (HTFs) – such as daily, weekly, or monthly charts – provide a broader perspective and are used for long-term decision-making.
HTF charts filter out random market noise and reveal the true structure of market trends. They act as a foundation for all forms of trading because even intraday traders benefit from understanding the dominant HTF trend.
3. Why Traders Choose High Time Frame Trading
HTF trading appeals to many traders for several reasons:
a) Clearer Market Structure
High time frames help traders see the overall direction of the market without being distracted by short-term fluctuations. Trends, consolidations, and reversals are easier to identify, enabling traders to make more informed and less emotional decisions.
b) Reduced Market Noise
Lower time frames are filled with false signals caused by random volatility. HTF trading eliminates much of this noise, allowing traders to focus on significant price action and key technical levels.
c) Stronger Trade Signals
Signals that appear on higher time frames – such as breakouts, moving average crossovers, or candlestick patterns – tend to be more reliable. For example, a bullish engulfing pattern on the daily chart holds more weight than the same pattern on a 5-minute chart.
d) Better Risk-to-Reward Ratios
HTF setups generally offer wider stop-loss levels but also much larger potential profits. Traders can capture multi-day or multi-week trends rather than short bursts of volatility.
e) Less Screen Time
Unlike day traders who need to monitor charts constantly, HTF traders can analyze the market once or twice a day. This suits those with full-time jobs or other commitments, making it a more flexible trading style.
4. The Core Principles of HTF Trading
To trade effectively on higher time frames, traders must follow certain foundational principles:
a) Patience
HTF trading requires patience because setups take time to form. A trader might wait several days or weeks for the ideal entry point, but the reward is typically worth the wait.
b) Trend Alignment
Trading with the trend is crucial in HTF analysis. Identifying whether the market is in an uptrend, downtrend, or consolidation phase helps avoid low-probability trades.
c) Multi-Time Frame Confirmation
Even in HTF trading, traders often combine multiple time frames to confirm trends. For example, a trader might use the weekly chart to identify the main trend and the daily chart to find entry points.
d) Risk Management
Since trades are held for longer durations, position sizing and stop-loss placement become critical. Traders must calculate their risk carefully, as drawdowns can be larger on higher time frames.
e) Emotional Discipline
HTF traders must stay disciplined and avoid overreacting to intraday market fluctuations. Emotional resilience is key because trades can take time to mature.
5. Commonly Used High Time Frames
HTF traders typically analyze the following charts:
Daily Chart (1D): Used to capture trends lasting from a few days to several weeks. It’s the most popular time frame for swing traders.
Weekly Chart (1W): Suitable for position traders who hold trades for weeks or months. It offers insights into long-term market direction.
Monthly Chart (1M): Used by long-term investors and portfolio managers to identify macro trends, economic cycles, and historical price zones.
By analyzing these charts together, traders can identify key confluences – such as when daily support aligns with weekly resistance – which strengthens trade decisions.
6. Technical Tools and Indicators for HTF Trading
HTF traders rely on a mix of price action and technical indicators to validate their setups. Some commonly used tools include:
a) Moving Averages
Moving averages like the 50-day, 100-day, or 200-day MA help identify the overall trend direction. When price stays above the 200-day MA, it generally signals a long-term uptrend.
b) Support and Resistance Zones
These levels mark areas where price has historically reacted. HTF traders often draw zones from weekly or monthly charts since these act as powerful reversal or breakout levels.
c) Trendlines and Channels
Trendlines connect significant highs or lows, showing the direction and strength of a trend. Channels highlight potential areas of support or resistance within the trend.
d) Fibonacci Retracements
Fibonacci levels (e.g., 38.2%, 50%, 61.8%) help HTF traders spot retracement zones where price might reverse within a larger trend.
e) Volume Analysis
Volume on HTFs reflects institutional activity. High volume near support or resistance confirms stronger buying or selling pressure.
f) Candlestick Patterns
Patterns such as engulfing candles, pin bars, or hammers carry more weight on HTF charts. For example, a weekly bullish engulfing candle can indicate the beginning of a strong long-term rally.
7. The Process of HTF Analysis
A systematic approach to HTF trading generally involves these steps:
Step 1: Top-Down Analysis
Traders begin by analyzing the highest relevant time frame (monthly or weekly) to determine the overall trend. They then move down to daily charts to refine entry and exit points.
Step 2: Identify Key Levels
Mark significant zones of support, resistance, and trendlines. These areas act as potential entry or exit points.
Step 3: Wait for Confirmation
Patience is essential. Traders wait for confirmation signals like breakouts, retests, or candlestick reversals before entering a trade.
Step 4: Plan the Trade
Define entry, stop-loss, and target levels before execution. Proper planning reduces emotional decision-making during live market movements.
Step 5: Manage the Trade
Once in a position, traders monitor weekly or daily closes to decide whether to hold or exit. Trailing stops can be used to lock in profits as the trend progresses.
8. Advantages of HTF Trading
Higher Accuracy:
HTF setups filter out false signals, offering more reliable trade opportunities.
Lower Stress Levels:
Traders are not glued to screens all day, reducing emotional fatigue.
Better Trend Participation:
Traders can capture larger moves by following macro trends instead of reacting to short-term volatility.
Easier Decision-Making:
Since HTF signals develop slowly, traders have more time to analyze before entering.
Compatibility with Fundamental Analysis:
HTF trading aligns well with macroeconomic and corporate fundamentals, making it ideal for investors combining technical and fundamental analysis.
9. Disadvantages and Challenges
While HTF trading has many benefits, it is not without drawbacks:
Fewer Trading Opportunities:
High-quality setups take time to form, which can be frustrating for impatient traders.
Larger Stop-Loss Requirements:
Because price movements on HTFs cover more ground, stop losses must be wider, demanding a larger capital base.
Potential for Long Drawdowns:
Trades may stay in negative territory for days or weeks before turning profitable, testing a trader’s patience.
Missed Short-Term Profits:
HTF traders may ignore smaller opportunities visible on lower time frames.
10. Combining HTF with Lower Time Frames
Many experienced traders blend HTF and LTF analysis through a multi-time frame strategy. For example:
Use the weekly chart to define trend direction.
Use the daily chart to spot entry zones.
Use the 4-hour chart to fine-tune entries and stop-loss placement.
This combination allows traders to maintain alignment with the major trend while optimizing entries for better risk-reward ratios.
11. HTF Trading Psychology
Success in HTF trading relies heavily on mindset and discipline. Traders must:
Detach from short-term noise.
Trust their analysis and plan.
Embrace patience – setups take time, and emotional decisions can ruin a good trade.
Accept losses gracefully since even high-probability setups can fail.
Think long-term – focus on consistent growth over time rather than daily results.
12. Case Study: HTF Trading Example
Imagine a trader analyzing Nifty 50 on a weekly chart.
The weekly trend shows higher highs and higher lows — a clear uptrend.
The trader identifies strong support at 21,000 and resistance at 23,000.
On the daily chart, price retraces to 21,200 with a bullish engulfing candle.
The trader enters long with a stop-loss below 20,900 and targets 23,000.
This trade aligns with the weekly trend, uses a daily confirmation for entry, and aims for a large reward relative to the risk — a textbook example of HTF strategy.
13. Ideal Markets for HTF Trading
HTF trading works best in markets with strong trends and liquidity, such as:
Equities (e.g., Nifty, Reliance, TCS, Bajaj Finance)
Commodities (Gold, Crude Oil)
Forex Pairs (USD/INR, EUR/USD)
Cryptocurrencies (Bitcoin, Ethereum)
Since HTF traders rely on macro trends, these instruments’ price movements often reflect economic or geopolitical events, offering consistent long-term opportunities.
14. Key Mistakes to Avoid
Checking Charts Too Frequently:
Over-monitoring causes emotional interference.
Ignoring Risk Management:
Large stop-loss levels require careful position sizing.
Trading Against the Trend:
Fighting the dominant HTF direction leads to unnecessary losses.
Entering Without Confirmation:
Waiting for candle closes on HTFs avoids false breakouts.
15. Conclusion: The Power of the Bigger Picture
High Time Frame trading is a disciplined, patient, and powerful approach to market analysis. It emphasizes clarity over noise, conviction over haste, and trend-following over prediction. By aligning with the dominant market trend, traders can enhance their accuracy, reduce emotional stress, and achieve more consistent long-term results.
While HTF trading requires patience and emotional control, it rewards traders with higher-quality setups, deeper insights into market behavior, and sustainable profitability. Whether applied to stocks, forex, or commodities, mastering HTF analysis allows traders to think like institutions — focusing not on what happens in minutes or hours, but on what truly drives the market in days, weeks, and months.
How GIFT Nifty Strengthens India’s Financial Market PresenceWhy GIFT Nifty matters: key features & advantages
Here are the main reasons why GIFT Nifty is strategically important and how it helps India boost its financial market presence:
1. Extended trading hours & global connectivity
Unlike domestic derivatives markets that operate in Indian local hours, GIFT Nifty contracts are available for many more hours, spanning Asia, Europe, and U.S. trading windows.
That means global investors (institutional, proprietary traders, foreign funds) can trade exposure to Indian equities around the clock or across time zones, which allows hedging, arbitrage, or reacting to global events.
This helps price discovery by letting global information (overnight U.S./Europe developments, commodities, geopolitical events) feed into the derivative price, which in turn influences domestic markets.
2. On-shore jurisdiction & regulatory control
By hosting the derivative contract on Indian soil and in Indian jurisdiction (in GIFT City), regulatory oversight rests with Indian regulators (through IFSCA, related bodies).
That reduces reliance on foreign offshore derivative venues, meaning India retains control over contract design, fees, settlement, data licensing, etc.
This helps capture revenue from derivative trading (brokerage, clearing, settlement fees) that might otherwise go to offshore exchanges.
3. Liquidity, volume growth & market depth
GIFT Nifty has seen explosive growth in turnover. For example, by May 2025, monthly turnover was about US$102.35 billion.
Earlier as of September 2024, since full-scale operations in July 2023, cumulative turnover had reached ~$1.18 trillion across contracts.
The high volumes mean the market gets more liquidity, narrower bid-ask spreads, and better ability for large institutional players to take positions without excessive impact.
4. Benchmarking & market signal
GIFT Nifty also acts as an early indicator for how Indian equity markets might open, since it trades ahead of domestic markets. Traders watch the derivative to gauge global sentiment, overnight moves, global cues feeding into India.
Analysts often refer to futures of GIFT Nifty to anticipate the opening direction of domestic indices such as Nifty 50 or broader markets.
This gives market participants better ability to hedge or adjust positions before the domestic market opens.
5. Attracting foreign institutional investors
Because the contract is denominated in USD (or foreign currency) and traded in a relatively liberal, tax-neutral, special financial hub, foreign investors find it easier to participate without the complexities of onshore currency restrictions or heavy regulatory overhead.
The structure is more friendly to global funds, proprietary traders, hedge funds, etc., helping bring more foreign capital into Indian markets or allow foreign exposure to Indian equities.
This helps deepen the investor base, diversify sources of capital, and reduce dependence on purely domestic flows.
6. Enhancing India’s financial hub ambitions
GIFT City is being pitched as an international financial services centre rivaling global hubs like Dubai, Singapore, etc.
By hosting major derivative contracts for Indian equities in this hub, India raises its financial credibility and shows ability to host global financial infrastructure.
This helps in building ancillary infrastructure (clearing, settlement, foreign exchange, custody, banks, regulatory frameworks) around the hub, strengthening the ecosystem.
7. Improved settlement / FX infrastructure
The hub is working on enabling real-time foreign exchange settlements by domestic banks. Recently there were initiatives to reduce settlement times drastically (from ~24 hours to ~30 seconds for USD clearing inside GIFT City).
This means foreign exchange required for derivative trades or cross-border flows becomes faster, cheaper, and more efficient, making the hub more attractive.
That helps reduce friction for global participants, improving overall efficiency of derivative trades tied to foreign currency exposures.
Implications for Indian financial markets and economy
Here are the implications or effects of all of the above on India’s financial markets and economy:
A. Stronger integration with global capital
Because global participants can trade Indian equity derivatives with fewer regulatory constraints or currency friction, capital flows become more integrated with global markets. That means global shocks or global capital reallocation can feed into Indian markets faster, but also India has more visibility internationally.
B. Improved price discovery & market efficiency
With extended trading hours and global participation, information from foreign markets (U.S., Europe, Asia) gets incorporated earlier into derivative prices. That helps domestic markets start from a more informed base (less gap or surprise).
It improves efficiency, means domestic traders can react earlier, hedging becomes easier, and arbitrage between onshore and offshore markets is reduced.
C. Retaining derivative revenue domestically
Before GIFT Nifty, many offshore derivative products (like the former SGX Nifty in Singapore) allowed foreign trading of Nifty futures outside India. That meant India was losing out on transaction fees, clearing, and data licensing revenue.
Now with derivatives parked in GIFT City, India captures those fees, clearing, and infrastructure income, boosting domestic financial sector revenues.
D. Boosting competitiveness & ecosystem
Setting up global derivatives, FX settlement, custody, clearing houses, market infrastructure in GIFT City helps build a comprehensive ecosystem of financial services: brokers, banks, clearing participants, global fund offices. This increases job creation, knowledge transfer, regulatory sophistication, and financial innovation.
E. Attractive proposition to international investors
Foreign investors see reduced regulatory friction, extended hours, easier access. That can lead to more foreign institutional inflows into Indian equity exposures (both via derivatives and via hedged exposures).
This helps India attract more global capital, which can also support domestic equity valuations, provide more liquidity, reduce volatility, and provide deeper markets.
F. Enhancing India’s reputation globally
By hosting one of the key offshore / international derivative contracts on its soil, India signals that it is capable of being a financial hub, with regulatory infrastructure, transparency, and global linkages. That helps raise the country’s credibility in global financial markets.
Challenges, risks & considerations
Of course, this is not all smooth sailing; there are some risks or challenges that need to be addressed:
Regulatory oversight and risk management
Though GIFT City offers more liberal rules, regulators have to ensure risk controls (especially with derivatives trading) so that volatility or spillovers don’t affect domestic markets excessively.
Derivative positions can be large, and if not managed properly, could create risks for clearing houses or systemic risk.
Arbitrage or basis risk
Differences may still exist between onshore Nifty futures (in domestic exchanges) and derivative prices in the offshore contract. Basis / spread differences must be managed, arbitrageurs will adjust quickly.
Market participants need to watch price differences, settlement semantics, currency exposures.
Foreign investor restrictions
Though many foreign / proprietary / institutional participants are allowed, there still might be rules restricting retail Indian participation in these USD-denominated derivatives. For example, in many cases, resident Indians may not be allowed or have limited participation.
That means some segments may not benefit fully from the product.
Volatility & global shocks
Because it is open across global hours, derivative contracts will reflect global shocks (global equity crash, currency risk, U.S. interest rate changes). Domestic markets may then see overnight / pre-opening shocks that domestic participants aren’t used to.
That might increase volatility or lead to gap moves in domestic markets.
Competition from other hubs
Other financial hubs (Dubai, Singapore, etc.) may still compete for global derivative flows or other financial products. GIFT City needs to maintain competitive regulatory, tax, infrastructure environment.
Evidence / milestones & performance metrics
To back up how significant GIFT Nifty has been in practice:
It has crossed US$100 billion monthly turnover in recent times.
In one month (May 2025) it recorded a turnover of $102.35 billion, reflecting strong adoption and liquidity growth.
Earlier, in September 2024, it had recorded ~$100.7 billion turnover in that month, surpassing previous levels and showing consistent growth in contract volumes.
Also, as part of regulatory reforms, derivatives on Nifty and other indices (Bank Nifty, Nifty IT, etc.) are being offered in the GIFT IFSC (International Financial Services Centre), enhancing product breadth.
Future outlook & recommendations
Here are some thoughts about where things might go and what to watch out for:
Expansion of product range: More derivatives (options, zero-day expiry, multiple expiries) likely to be introduced to increase attractiveness. Indeed there are already plans for daily or more frequent expiries.
Real-time FX settlement: The initiative to enable domestic banks to settle foreign exchange trades in real time (reducing from 24 hours to seconds) will only increase attractiveness and reduce friction for foreign participants.
Improved regulatory clarity: Ensuring that risk management, margin requirements, and clearing infrastructure are robust will reduce risk for participants and improve confidence.
Integration with domestic markets: As derivatives flows feed into domestic markets, spillover effects will be more immediate, helping align offshore and onshore liquidity.
Competition & regulatory benchmarking: GIFT City must maintain competitive regulatory / tax regime to compete with other global hubs; continuous improvements will be needed.
Conclusion
The introduction and growth of GIFT Nifty (in GIFT City / NSE International Exchange) is a landmark step in India’s journey to strengthen its financial market presence on the global stage. It combines extended trading hours, favorable regulatory environment, and high liquidity, making it more attractive to foreign and global institutional investors. It helps India retain derivative trading volumes, improve price discovery, connect with global markets more deeply, and build its aspiration as a global financial hub.
The evidence of increasing turnover (over US$100bn monthly) shows strong adoption; combined with regulatory and infrastructure push (real-time FX settlement, liberal derivatives frameworks), it is helping shape India into a more mature, integrated, and internationally respected financial market.

We are getting closer to our TARGET!As we can see despite closing extremly weak previous day NIFTY managed to reverse sharply exactly as analysed. Hence we always say that we should always stick with our analysis and should not get distracted or lose hope with minor corrections or retracements until it is our structure. So, following our structure, we can still expect NIFTY to remain strong and head towards 25500 in near future so plan your trades accordingly and keep wathcing everyome.

XAUUSD // Liquidity Grab // ATH# Gold Spot / U.S. Dollar - Liquidity Analysis
Market Structure Analysis
Key Liquidity Zones Identified
The chart highlights two critical liquidity zones where significant price action is anticipated:
**Upper Liquidity Zone: $4,212 - $4,219**
This zone represents an area of accumulated buy-side liquidity, typically formed by stop-losses from short positions and buy-stop orders. The red shaded area indicates where institutional players may target for liquidity capture before potential reversals.
**Lower Liquidity Zone: $4,157 - $4,162**
This zone marks the sell-side liquidity area, where stop-losses from long positions and sell-stop orders cluster. This level serves as a potential magnet for price action seeking to capture liquidity before any significant directional move.
Technical Setup
**Channel Pattern**
Gold is currently trading within a well-defined ascending channel on the intraday timeframe. The parallel trend lines show:
- Consistent higher highs and higher lows
- Price currently positioned in the mid-range of the channel
- Recent bounce from the lower channel boundary
**Demand Zone**
A marked demand zone is visible at lower levels, indicating previous buying interest and potential support.
Price Action Scenarios
Bullish Scenario (Green Path):
If price maintains support at current levels or the lower demand zone, we could see:
1. Continuation toward the upper liquidity zone ($4,219)
2. Potential liquidity sweep above this zone
3. Possible rejection after capturing buy-side liquidity
Bearish Scenario (Red Path):
If price fails to hold current structure:
1. Drop toward the lower liquidity zone ($4,162)
2. Liquidity grab below this level
3. Potential reversal after capturing sell-side liquidity
#Liquidity Concept
The annotation "Liquidity !!!!!!" emphasizes the importance of these zones. In institutional trading theory, price often moves to areas of high liquidity (where stop-losses cluster) before making significant directional moves. This is commonly referred to as a "liquidity sweep" or "stop hunt."
Trading Considerations
When price approaches either liquidity zone, traders should watch for:
- Rejection wicks suggesting liquidity capture completion
- Break and retest patterns for confirmation
- Changes in momentum indicators
Risk Management Notes
- The 5-minute timeframe requires precise execution and tight risk management
- Liquidity zones can be quickly swept through in volatile conditions
- Always use appropriate position sizing relative to account risk tolerance
- Consider wider timeframe context for overall trend direction
Disclaimer
This analysis is provided for educational purposes only and represents a technical perspective on price structure and liquidity zones.
It is not financial advice or a recommendation to buy or sell. Gold trading involves substantial risk of loss. Always conduct your own research, use proper risk management, and consider consulting with a qualified financial advisor before making trading decisions.

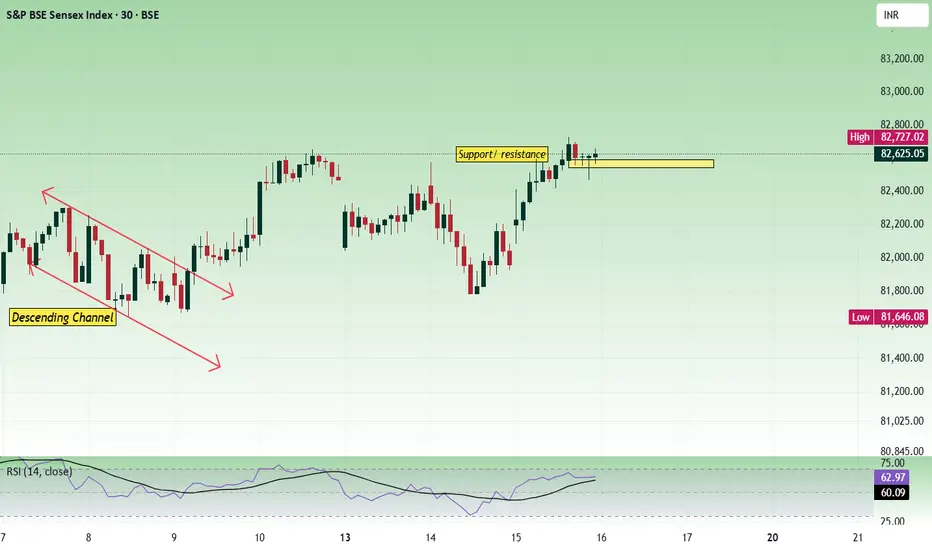
Sensex - Expiry day analysis Oct 16Price has taken support from 82500 and managed to close above it. Price has a higher probability of moving up as long as it sustains above 82500. At the same time, the price is facing trendline resistance in the daily chart.
Price can fall from trendline resistance if it gains bearish strength. Before taking a trade we should know where the nearby support/resistance is waiting for us to give diversion.
Buy above 82560 with the stop loss of 82420 for the targets 82660, 82800, 82920, 83040,83200 and 83320.
Sell below 82300 with the stop loss of 82420 for the targets 82200, 82080, 81940, 81800, 81680 and 81560.
Always do your analysis before taking any trade.
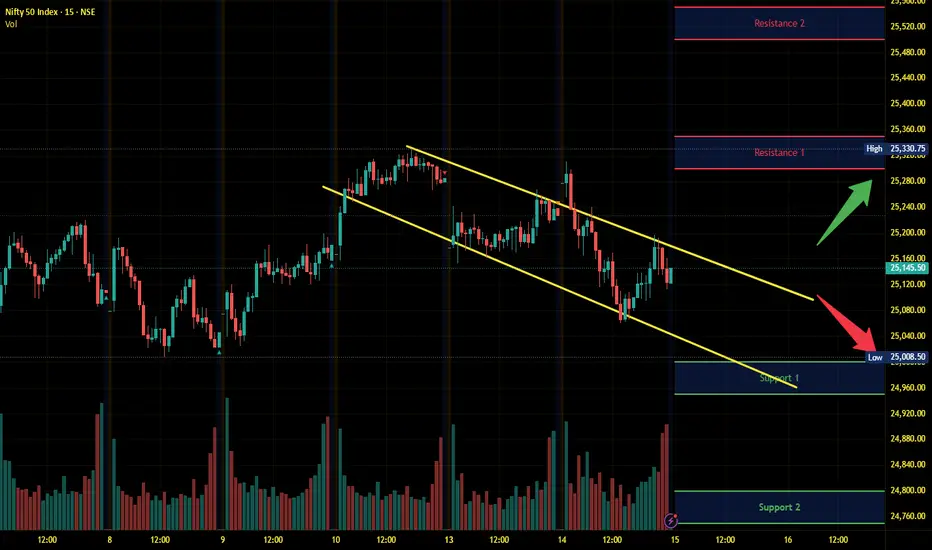
Nifty Intraday Analysis for 15th October 2025NSE:NIFTY
Index has resistance near 25300 – 25350 range and if index crosses and sustains above this level then may reach near 25500 – 25550 range.
Nifty has immediate support near 25000 – 24950 range and if this support is broken then index may tank near 24800 – 24750 range.
Banknifty Intraday Analysis for 15th October 2025NSE:BANKNIFTY
Index has resistance near 56900 – 57000 range and if index crosses and sustains above this level then may reach near 57400– 57500 range.
Banknifty has immediate support near 56000 - 55900 range and if this support is broken then index may tank near 55500 - 55400 range.

Finnifty Intraday Analysis for 15th October 2025NSE:CNXFINANCE
Index has resistance near 27025 - 27075 range and if index crosses and sustains above this level then may reach near 27250 - 27300 range.
Finnifty has immediate support near 26675 – 26625 range and if this support is broken then index may tank near 26450 – 26400 range.

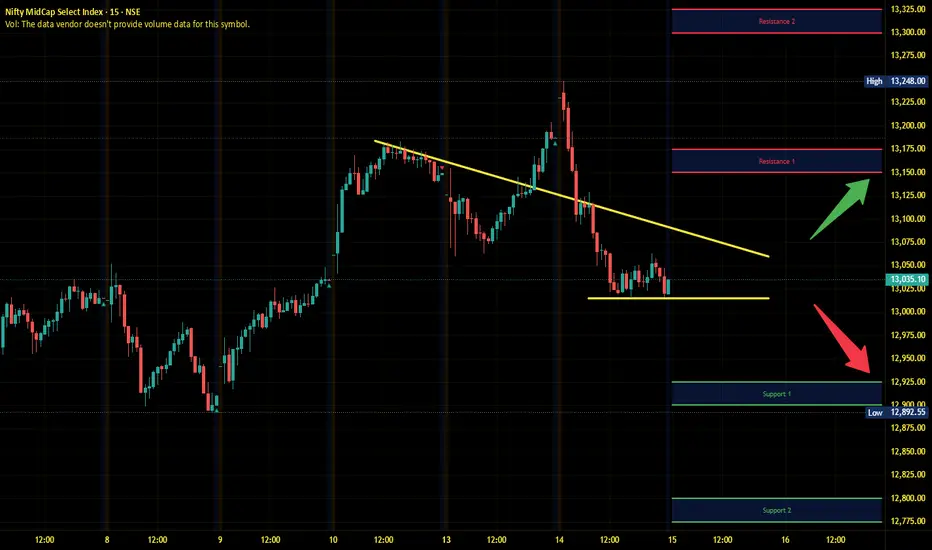
Midnifty Intraday Analysis for 15th October 2025NSE:NIFTY_MID_SELECT
Index has immediate resistance near 13150 – 13175 range and if index crosses and sustains above this level then may reach 13300 – 13325 range.
Midnifty has immediate support near 12925 – 12900 range and if this support is broken then index may tank near 12800 – 12775 range.
XAUUSD – Continues to set ATH XAUUSD – Continues to set ATH, prioritise buying according to POC 4,146–4,148 🟡
Gold continues to make higher highs after a strong rise in the Asian session; the upward channel structure remains intact. On H1, POC ~4,147–4,148 is the nearest support point; above is the resistance cluster according to FE 1.618 ~4,186 and the sell zone 4,221–4,240.
Key levels
Support: 4,146–4,148 (POC) • 4,140 (short-term invalid).
Resistance/targets: 4,166 • 4,186 (FE 1.618) • 4,188–4,200 • 4,221 (sell scalping) • 4,240 (sell zone).
Trading scenarios
Buy 1 – POC pullback
Entry 4,146–4,148 | SL 4,140 | TP 4,166 → 4,188 → 4,200 → 4,245.
If it pulls back to POC and H1 shows a confirmation candle/mid-trendline support, prioritise buying.
Buy 2 – Shallow retest
If the price only dips ~4,160–4,162 then rebounds above POC, additional buying is possible with SL 4,152, TP as above.
Sell reaction (higher risk)
Entry 4,240 | SL 4,250 | TP 4,222 → 4,200 → 4,188 → 4,160.
Only trigger when there is a clear rejection signal at 4,221–4,240; this is a counter-trend trade.
Invalidation & management
Buying bias weakens when H1 closes below 4,140 or breaks the lower channel edge.
After TP1, move SL to entry; avoid chasing price in the 4,18x–4,20x area when volume is thin. 🎯
Quick context
The upward momentum is maintained due to expectations of the Fed ending QT/looser conditions and safe haven flows; however, the 4,221–4,240 area may create a short-term reaction before the uptrend continues.
Trade well with this scenario!
