Trading Volume Spiking: Understanding Market Dynamics1. Causes of Trading Volume Spikes
Trading volume spikes are generally triggered by market-moving events, investor psychology, or technical market dynamics. These causes can be grouped into several categories:
a) Fundamental News Events
Fundamental news is one of the primary reasons for sudden spikes in trading volume. Market participants react to new information about a company, industry, or economy, leading to increased buying and selling activity. Key examples include:
Earnings Reports: When a publicly traded company releases quarterly or annual earnings, deviations from market expectations can trigger heavy trading. A strong earnings beat may cause buying volume to surge, while disappointing earnings can provoke panic selling.
Corporate Announcements: Mergers, acquisitions, dividends, or stock splits can trigger spikes as traders adjust positions based on anticipated impacts.
Economic Data Releases: Broader economic indicators such as unemployment rates, GDP growth, or inflation numbers can impact trading volume across sectors.
Policy Changes: Central bank rate announcements, government regulations, or geopolitical developments can also induce sudden spikes.
b) Technical Triggers
Many traders rely on technical analysis, using charts, indicators, and historical price patterns to make decisions. Certain price movements or indicator signals often trigger high-volume trades:
Breakouts and Breakdowns: When the price breaks through significant resistance or support levels, it often triggers a rush of orders from both retail and institutional traders.
Moving Averages and Indicators: Crossing key technical levels, such as the 50-day or 200-day moving average, can prompt automated or algorithmic trading to enter or exit positions.
Volume Confirmation Signals: Traders often look for volume spikes as confirmation of trend strength. A price move accompanied by unusually high volume is considered more reliable.
c) Market Sentiment and Psychology
Human behavior plays a large role in volume spikes. Fear, greed, and herd behavior can amplify trading activity:
Panic Selling or Buying Frenzy: Market participants may act collectively during periods of fear or exuberance, creating sudden surges in volume.
Speculation and Rumors: Even unverified news or market rumors can prompt significant spikes, as traders try to capitalize on potential opportunities.
d) Algorithmic and High-Frequency Trading
Modern markets are heavily influenced by algorithmic trading, which can amplify volume spikes. High-frequency trading (HFT) algorithms react in milliseconds to market signals, leading to bursts of buying or selling activity that may not reflect fundamental changes.
2. Interpreting Trading Volume Spikes
Volume spikes are not merely numerical anomalies; they carry deep implications for market participants. Understanding what a volume spike signifies is crucial for strategy development.
a) Confirmation of Price Movement
A spike in volume often confirms the strength of a price movement. For example:
A price surge with high volume indicates strong buying interest, suggesting the uptrend may continue.
Conversely, a price drop with high volume reflects strong selling pressure and can indicate a genuine downtrend.
Without significant volume, price movements may lack conviction and can be more prone to reversals.
b) Potential Trend Reversals
While high volume can confirm trends, extreme spikes can sometimes indicate trend exhaustion:
A rapid surge in volume after a prolonged price move may suggest that the market is overextended.
In some cases, this leads to a reversal, as traders take profits and new participants step in to bet against the trend.
c) Liquidity Insights
Volume spikes provide insight into market liquidity:
Higher volume generally improves liquidity, allowing larger trades to execute without significant price slippage.
Low volume during a spike, however, may indicate market thinness and volatility, making it riskier to trade large positions.
d) Institutional Activity
Unusually high volume often reflects institutional participation, such as hedge funds, mutual funds, or pension funds entering or exiting positions. These large trades can significantly influence price levels, especially in less liquid stocks.
3. Strategies for Traders During Volume Spikes
Traders and investors can use volume spikes strategically. Here are key approaches:
a) Momentum Trading
Momentum traders thrive on high-volume moves. A sudden increase in volume coupled with a breakout or breakdown can signal a strong directional trade opportunity. Traders often enter in the direction of the volume surge, expecting follow-through.
b) Volume-Based Confirmation
Technical analysts often use volume spikes as confirmation tools. For example:
Breakout Confirmation: A breakout above resistance accompanied by higher-than-average volume is more likely to sustain.
Trend Validation: Sustained trends confirmed by rising volume tend to be stronger and more reliable.
c) Contrarian Approach
Contrarian traders may interpret extreme volume spikes as signals of market exhaustion. After intense buying or selling, the market may be ripe for a pullback. This approach requires careful risk management.
d) Risk Management Adjustments
Volume spikes often coincide with higher volatility. Traders should adjust stop-loss levels, position sizes, and entry points to accommodate rapid price swings. Ignoring volume-related risk can result in significant losses.
4. Tools and Indicators for Monitoring Volume Spikes
Modern trading platforms provide a range of volume indicators to detect spikes and guide decisions:
Volume Bars: Basic histogram bars show volume per period and highlight anomalies relative to average volume.
On-Balance Volume (OBV): OBV measures cumulative buying and selling pressure, helping identify accumulation or distribution trends.
Volume Moving Averages: Traders often compare current volume against a 10-day or 20-day average to spot unusual spikes.
Volume-Price Trend (VPT): VPT combines volume and price changes to assess whether volume supports the direction of the trend.
These tools help traders distinguish between meaningful volume spikes and random market noise.
5. Case Studies of Trading Volume Spikes
Historical examples illustrate the significance of volume spikes:
Tech Stocks during Earnings Season: Companies like Apple or Microsoft often experience 3–5x average daily volume on earnings days, reflecting investor reaction to profits, guidance, or product announcements.
Market Crashes: During the 2020 COVID-19 market crash, trading volumes surged as investors panicked, providing liquidity but also amplifying volatility.
Cryptocurrency Market Events: Cryptocurrencies like Bitcoin often experience volume spikes during regulatory news or large institutional trades, resulting in rapid price swings.
6. Potential Pitfalls and Misinterpretations
While volume spikes are useful, traders must avoid over-reliance:
False Signals: Not all spikes indicate a trend continuation; some are caused by short-term speculative activity.
Thin Markets: Volume spikes in low-liquidity markets can exaggerate price moves and mislead traders.
Algorithmic Distortions: HFT can generate temporary spikes without any fundamental significance.
Proper analysis requires combining volume with other indicators such as price action, moving averages, and market news.
7. Conclusion
A trading volume spike is a key market signal reflecting a surge in trading activity, often triggered by fundamental events, technical movements, market sentiment, or institutional participation. For traders, volume spikes provide vital insights into the strength, liquidity, and sustainability of price movements. High volume confirms trends, signals potential reversals, and highlights institutional activity. However, spikes also bring risks due to higher volatility and potential market noise.
By integrating volume analysis into trading strategies, using technical indicators, and monitoring market news, traders can make more informed, strategic decisions. Whether you are a momentum trader, contrarian investor, or risk-conscious portfolio manager, understanding volume spikes is essential for navigating modern financial markets effectively.
Trend Lines
Exploring Financial Market Types1. Money Market
The money market is a segment of the financial market that deals with short-term borrowing and lending of funds, usually with maturities of one year or less. It is primarily used by corporations, financial institutions, and governments to manage short-term liquidity needs.
Key Instruments in the Money Market:
Treasury Bills (T-Bills): Short-term debt instruments issued by governments to raise funds. They are considered risk-free and highly liquid.
Commercial Papers (CPs): Unsecured promissory notes issued by corporations to meet short-term funding needs. They generally have maturities ranging from a few days to nine months.
Certificates of Deposit (CDs): Time deposits issued by banks that pay a fixed interest upon maturity.
Repurchase Agreements (Repos): Short-term borrowing agreements where securities are sold and later repurchased at a predetermined price.
Functions:
Liquidity Management: Provides short-term funds to banks, corporations, and governments.
Efficient Allocation: Facilitates smooth functioning of the banking system.
Monetary Policy Transmission: Central banks use the money market to implement monetary policy through instruments like repos and T-bills.
The money market is characterized by low risk and relatively lower returns compared to long-term markets. Its efficiency ensures that the economy maintains liquidity and stability.
2. Capital Market
Capital markets deal with long-term funds, generally with maturities exceeding one year. They are crucial for economic growth as they enable corporations and governments to raise funds for investments in infrastructure, expansion, and other productive activities. Capital markets are broadly divided into primary markets and secondary markets.
a. Primary Market:
Also known as the new issue market, it is where new securities are issued and sold to investors.
Initial Public Offerings (IPOs): Companies raise equity by offering shares to the public for the first time.
Bond Issuance: Governments and corporations raise debt funds by issuing bonds.
b. Secondary Market:
Once securities are issued in the primary market, they are traded in the secondary market. Examples include stock exchanges like the New York Stock Exchange (NYSE), NASDAQ, and Bombay Stock Exchange (BSE).
Functions of Capital Markets:
Capital Formation: Enables businesses to raise funds for long-term growth.
Investment Opportunities: Provides a platform for individuals and institutions to invest their savings in productive assets.
Price Discovery: Helps determine the market value of securities through supply-demand dynamics.
Liquidity: Secondary markets allow investors to buy and sell securities easily, ensuring liquidity.
Participants in Capital Markets:
Retail investors
Institutional investors (mutual funds, pension funds)
Investment banks and brokers
Regulatory authorities (SEBI, SEC)
Capital markets are more volatile than money markets but offer higher potential returns due to the long-term nature of investments.
3. Derivative Markets
Derivative markets are financial markets where instruments derived from underlying assets are traded. The underlying assets can include stocks, bonds, currencies, commodities, or market indices. Common derivatives include futures, options, forwards, and swaps.
Purpose of Derivatives:
Hedging: Investors use derivatives to manage or mitigate risk associated with price fluctuations.
Speculation: Traders aim to profit from price movements in the underlying asset.
Arbitrage: Derivatives allow traders to exploit price differences across markets.
Types of Derivative Instruments:
Futures: Contracts obligating the purchase or sale of an asset at a predetermined price on a specific future date.
Options: Contracts that give the buyer the right, but not the obligation, to buy or sell an asset at a set price within a certain period.
Forwards: Customized contracts between two parties to buy or sell an asset at a specified future date and price.
Swaps: Agreements to exchange cash flows or other financial instruments between parties.
Derivative markets play a vital role in financial risk management but are complex and may involve significant leverage, making them riskier than money or capital markets.
4. Foreign Exchange Market (Forex)
The foreign exchange market, or Forex, is where currencies are bought and sold. It is the largest financial market globally, with trillions of dollars traded daily. Forex facilitates international trade, investment, and tourism by providing liquidity in different currencies.
Key Features:
Decentralized Market: Operates 24/7 without a central exchange.
Participants: Banks, corporations, central banks, hedge funds, and retail traders.
Major Instruments: Spot transactions, forwards, futures, and options in currencies.
Functions:
Currency Conversion: Enables businesses to transact internationally.
Hedging Exchange Rate Risk: Companies can hedge against fluctuations in currency values.
Speculation: Traders profit from currency movements.
Global Liquidity: Supports global trade and investment flows.
The Forex market is highly liquid and volatile, influenced by macroeconomic factors, geopolitical events, and central bank policies.
5. Commodity Markets
Commodity markets are where raw materials and primary products are traded. These markets include energy, metals, and agricultural commodities. Trading can occur through physical markets or financial instruments such as futures and options.
Types of Commodities:
Agricultural Products: Wheat, rice, coffee, sugar.
Metals: Gold, silver, copper, platinum.
Energy: Crude oil, natural gas, coal.
Functions of Commodity Markets:
Price Discovery: Determines the fair market value of commodities through supply and demand.
Risk Management: Producers and consumers hedge against price volatility.
Investment Opportunities: Investors diversify portfolios by including commodities.
Economic Indicator: Commodity prices reflect economic trends and inflation expectations.
Commodity markets can be highly volatile due to weather conditions, geopolitical events, and global demand-supply dynamics.
6. Other Financial Market Segments
In addition to the major market types, several specialized financial markets exist:
Insurance Market: Provides risk management solutions against unforeseen events.
Pension Funds Market: Manages retirement savings and invests in long-term securities.
Credit Market: Focuses on lending and borrowing of debt instruments.
Venture Capital and Private Equity Markets: Provides funding to startups and private companies.
These specialized markets complement traditional markets by addressing specific financial needs and enhancing overall market efficiency.
Conclusion
Financial markets are diverse, dynamic, and interconnected. They are crucial for economic growth, providing platforms for capital formation, liquidity, risk management, and investment. Each market type—money, capital, derivatives, forex, and commodities—serves unique functions and caters to different investor needs. Participants range from retail investors to multinational corporations and central banks, collectively shaping the global financial ecosystem. Understanding these markets enables investors, policymakers, and businesses to make informed decisions, manage risks effectively, and optimize returns. As the world becomes increasingly globalized and technologically driven, financial markets continue to evolve, creating new opportunities and challenges in the pursuit of economic growth and financial stability.
How to Grow Your Business in the Trading Market1. Understanding the Trading Market Landscape
Before attempting to grow a trading business, it is crucial to understand the market dynamics. The trading market operates in a global ecosystem influenced by economic trends, geopolitical events, corporate performance, and investor sentiment. Key segments include:
Equities (Stocks): Companies raise capital through stock markets, offering investors a chance to participate in profits.
Commodities: Trading in raw materials such as gold, oil, and agricultural products, which are highly sensitive to global supply and demand.
Forex: The largest and most liquid market, involving currency pairs, influenced by interest rates, inflation, and macroeconomic data.
Derivatives: Financial contracts such as options and futures that derive value from underlying assets, useful for hedging and speculation.
Cryptocurrencies: Emerging digital assets driven by decentralized technologies, regulatory uncertainty, and market volatility.
Understanding these market segments allows a business to identify opportunities, anticipate trends, and tailor its offerings.
2. Establishing a Clear Business Model
Growth begins with a well-defined business model. There are several models in the trading sector:
Brokerage Services: Acting as intermediaries between buyers and sellers, earning through commissions or spreads.
Trading Platforms/Software: Providing technology infrastructure for traders, including analytics, charts, and automated trading systems.
Investment Advisory: Offering research, insights, and portfolio management services for retail or institutional clients.
Proprietary Trading: Using internal capital to trade, aiming to generate profits directly rather than earning commissions.
Choosing the right model depends on resources, expertise, and target clientele. Many successful businesses combine models, for instance, offering a trading platform along with educational and advisory services.
3. Building a Strong Technological Infrastructure
In modern trading, technology is a critical enabler of growth. Key technological elements include:
Trading Platforms: A reliable, fast, and secure platform attracts and retains clients. It should support multiple asset classes, real-time data, and customizable interfaces.
Algorithmic Trading: Automated strategies using algorithms can optimize execution, reduce human error, and handle large volumes efficiently.
Data Analytics: Access to market data and predictive analytics helps in decision-making, risk management, and personalized client services.
Mobile Access: With the rise of retail trading, mobile-friendly platforms ensure clients can trade anytime, anywhere, boosting engagement and revenue.
Investment in technology not only enhances operational efficiency but also differentiates a business in a highly competitive market.
4. Risk Management and Compliance
Trading inherently involves risk, and sustainable growth requires robust risk management practices:
Financial Risk: Hedging strategies, stop-loss orders, and portfolio diversification minimize losses.
Operational Risk: Internal processes, cybersecurity measures, and reliable infrastructure prevent disruptions.
Regulatory Compliance: Adhering to local and international regulations is critical. Non-compliance can result in fines, reputational damage, or license revocation.
Client Protection: Ensuring transparent policies, segregated accounts, and secure transactions builds trust and long-term client loyalty.
A business that prioritizes risk management gains credibility and positions itself as a trusted market participant.
5. Marketing and Client Acquisition
Growth in trading relies heavily on attracting and retaining clients. Effective strategies include:
Digital Marketing: SEO, social media, and content marketing can generate leads and enhance brand visibility.
Educational Programs: Hosting webinars, workshops, and tutorials not only educates potential clients but also establishes authority in the field.
Referral Programs: Incentivizing existing clients to refer new users accelerates growth organically.
Partnerships: Collaborations with financial influencers, fintech firms, or institutional investors expand reach and credibility.
Customer Experience: Seamless onboarding, responsive support, and intuitive interfaces improve client retention and lifetime value.
In a saturated market, marketing combined with trust-building is a key differentiator.
6. Diversification of Products and Services
Relying on a single revenue source can limit growth. Diversifying offerings allows businesses to tap into multiple market segments:
New Asset Classes: Expanding from stocks to derivatives, commodities, or crypto attracts a wider audience.
Portfolio Management: Offering managed accounts or robo-advisory services caters to clients seeking convenience.
Research and Insights: Subscription-based research reports, trading signals, or educational content create additional revenue streams.
Margin and Leverage Services: For experienced traders, providing margin trading enhances engagement and profitability.
Diversification mitigates risk while opening new channels for revenue generation.
7. Leveraging Strategic Partnerships and Networking
Networking and partnerships play a crucial role in scaling a trading business:
Institutional Partnerships: Collaborating with banks, funds, or brokerage houses provides access to large client bases and advanced trading infrastructure.
Technology Vendors: Partnerships with tech providers ensure the platform remains competitive and secure.
Educational Institutions: Partnering with universities and financial schools can attract aspiring traders and interns.
Global Expansion: Strategic alliances in other countries enable entry into new markets while navigating regulatory challenges.
Building a strong network creates opportunities for business growth and market penetration.
8. Continuous Learning and Market Adaptation
The trading market is dynamic, with constant technological, regulatory, and behavioral changes. Successful businesses embrace continuous learning:
Market Trends: Monitoring global economic indicators, industry reports, and emerging sectors helps anticipate opportunities.
Technological Innovation: Adopting blockchain, AI-driven analytics, and machine learning can improve trading performance and operational efficiency.
Customer Feedback: Understanding client needs, pain points, and preferences allows iterative improvements.
Competitor Analysis: Observing competitors’ strategies ensures the business remains competitive and innovative.
Adaptability is essential; firms that fail to evolve risk obsolescence.
9. Branding and Reputation Management
In trading, trust is currency. A strong brand communicates reliability and expertise:
Transparency: Open communication about fees, risks, and performance builds credibility.
Corporate Social Responsibility: Ethical trading, community engagement, and sustainable practices enhance reputation.
Thought Leadership: Publishing market analysis, insights, and white papers positions the firm as an industry authority.
Client Testimonials and Case Studies: Showcasing success stories reinforces trust and attracts new clients.
A reputable brand fosters loyalty, encourages referrals, and differentiates a business from competitors.
10. Scaling Operations Efficiently
Finally, as the business grows, operational efficiency ensures sustainability:
Automated Processes: Automating back-office operations, trade reconciliation, and reporting reduces costs.
Talent Acquisition: Hiring skilled traders, analysts, and technology experts strengthens core capabilities.
Scalable Infrastructure: Cloud-based systems and modular platforms accommodate growth without major overhauls.
Performance Metrics: Monitoring KPIs such as client acquisition cost, trading volume, and retention rate helps identify improvement areas.
Efficient scaling transforms incremental growth into long-term success.
Conclusion
Growing a business in the trading market requires a multifaceted approach combining strategy, technology, risk management, marketing, and operational excellence. Understanding market dynamics, building a robust platform, diversifying offerings, and prioritizing client trust are fundamental steps. Strategic partnerships, continuous learning, and reputation management further accelerate growth. By implementing these strategies thoughtfully and consistently, a trading business can not only survive but thrive in the competitive and ever-evolving financial markets.
In essence, growth in the trading market is not just about making profits—it is about creating a sustainable, innovative, and trusted ecosystem that adapts to change, attracts clients, and leverages technology effectively. Those who succeed are the ones who balance strategic foresight with operational discipline, constantly evolving to meet the demands of a dynamic global market.
BTCUSD SHOWING A GOOD UP MOVE WITH 1:10 RISK REWARD BTCUSD SHOWING A GOOD
UP MOVE WITH 1:10 RISK REWARD
DUE TO THESE REASON
A. its following a rectangle pattern that stocked the market
which preventing the market to move any one direction now it trying to break the strong resistant lable
B. after the break of this rectangle it will boost the market potential for break
C. also its resisting from a strong neckline the neckline also got weeker ald the price is ready to break in the outer region
all of these reason are indicating the same thing its ready for breakout BREAKOUT trading are follws good risk reward
please dont use more than one percentage of your capitalfollow risk reward and tradeing rules
that will help you to to become a bettertrader
thank you

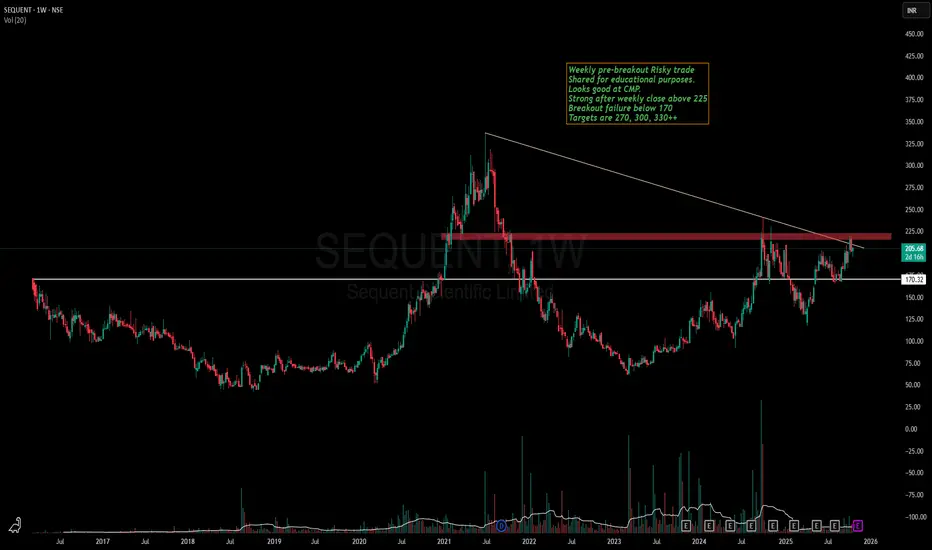
Sequent Scientific - Is it ready for a run towards ATH now?Sequent has been in my watchlist since the breakout of 170 levels.
Stock is making a good Higher high , Higher low pattern in weekly time frame and VCP in lower time frame.
Recently stock gave breakout of a strong resistance zone of 190-200 and is currently consolidating above the same.
If the breakout of 225 happens, we might see stock making a new ATH soon.
Keep this stock in watchlist and lets learn together how the patterns unveils.
This is not a recommendation and idea shared only for educational purposes
I am a NISM Certified RA & not SEBI registered.
NUVOCO | Simple trendline breakout - Looks good for 35-50%NUVOCO | Simple trendline breakout - Looks good for 35-50%
CMP : 422 (Dip : 380)

RBLBANK | Stock is getting re-rated - Looks good for doublingRBLBANK | Stock is getting re-rated - Looks good for doubling
CMP : 325

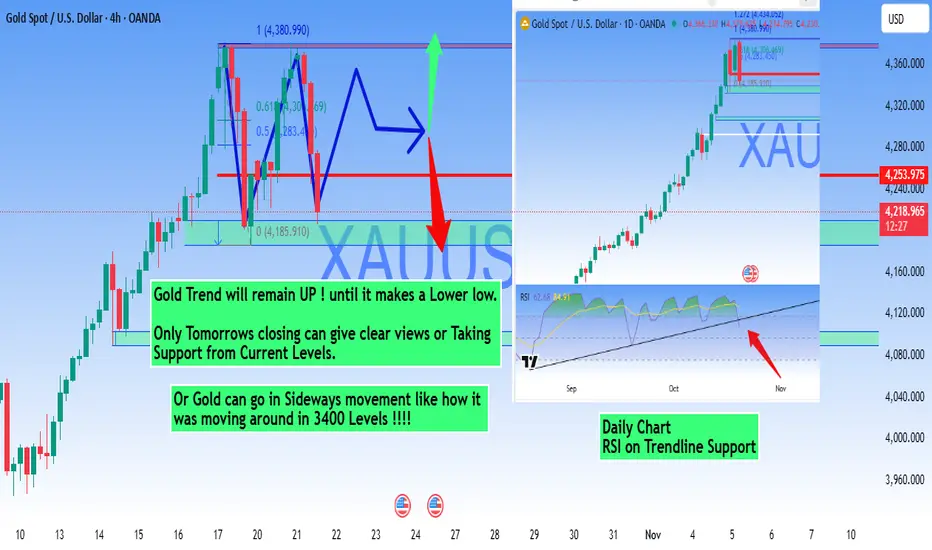
#xuausd Make or Break - Gold Analysis🥇 GOLD (XAU/USD) - Technical Analysis & Outlook
Timeframe: 4H & Daily Charts
Current Price: 2,718.99
Market Structure Analysis
Gold is currently in a **strong uptrend** and will maintain its bullish bias until it forms a clear lower low. The recent consolidation near all-time highs suggests a potential for either continuation or a sideways movement phase.
Key Price Levels
Support Zones
- Immediate Support: 4,218.99 - 4,240.00
- Major Support: 4,185.91 (0 Fibonacci - Recent Low)
- Critical Support: 4,160.00 - 4,180.00 zone
Resistance Zones
- Immediate Resistance: 4,253.97 (Current High)
- Next Resistance: 4,280.00 - 4,300.00
- Target Extension: 4,320.00 - 4,360.00
- Major Target: 4,380.99 (Fibonacci Extension)
Technical Scenarios
- Continuation of the current uptrend expected
- Any pullback to support zones presents buying opportunities
- Target: 4,280 - 4,360 zone
- Extended Target: 4,380+ levels
Consolidation Scenario (Secondary)
Condition: Sideways movement similar to the 3,400 consolidation phase
- Gold may enter a ranging phase at current elevated levels
- Watch for sideways movement between 4,200 - 4,280
- Accumulation pattern before next leg up
- Patience required during this phase
🔴 Bearish Scenario (Alternative)
Condition: Only if price breaks and closes below 4,185
- Bearish only on confirmed break of structure
- Potential retracement to $4,160 or lower
- Wait for clear reversal signals before shorting
RSI Analysis (Daily Chart)
- RSI Position: Near trendline support (around 62)
- Signal: RSI holding above trendline support indicates continued bullish momentum
- Watch For: RSI breakdown below trendline would signal weakening momentum
- Strength: RSI still in bullish territory, no divergence observed
Key Observations
1. **Strong Uptrend Intact:** No lower lows formed yet, trend remains bullish
2. **Fibonacci Levels:** Price respecting key Fibonacci retracement zones
3. **Consolidation Pattern:** Similar behavior to previous $3,400 consolidation
4. **Volume Profile:** Accumulation visible near support zones
5. **Daily RSI:** Holding trendline support, maintaining bullish structure
Critical Points to Monitor
🔸 22/10/2025 Close: Will provide clearer direction
🔸 Support Level: 4,218 - Must hold for bullish continuation
🔸 RSI Trendline: Break would signal momentum shift
🔸 Volume: Watch for increasing volume on moves
🔸 Global Events: Fed policy, geopolitical tensions, USD strength
🎓 #Trading Wisdom
"The #trend is your friend until it bends. #Gold will remain #bullish until it makes a #lowerlow. Stay patient, follow the structure, and let the market show its hand."*
Risk Disclaimer
This analysis is for educational purposes only and should not be considered financial advice. Always manage your risk appropriately, use stop losses, and never risk more than you can afford to lose. Past performance does not guarantee future results.
Like and Follow for Daily Gold Analysis!
#Gold #XAUUSD #GoldTrading #TechnicalAnalysis #ForexTrading #PreciousMetals #TradingView #MarketAnalysis
Option Trading Leverage and Speculation in Option Trading
Options provide leverage, allowing traders to control large positions with small investments. For instance, buying a single call option can represent ownership of 100 shares, magnifying both profits and losses. Speculators use this leverage to capitalize on short-term market moves. However, leverage also increases risk—if the market moves against the position, the entire premium can be lost. Successful speculators use strict risk management, combining analysis of volatility, momentum, and time decay to optimize entries and e

Part 1 Intraday Trading Master ClassOption Premium and Its Components
The premium is the price paid to acquire an option contract. It consists of two parts: intrinsic value and time value. Intrinsic value reflects the actual profitability if exercised immediately, while time value represents the potential for further profit before expiry. Several factors influence premiums—especially implied volatility (IV), time to expiration, and interest rates. Higher volatility generally increases premiums since potential price swings make the option more valuable. Traders analyze these components using models like Black-Scholes to determine fair value. Understanding premium behavior helps in selecting the right option strategy, whether to buy undervalued options or sell overvalued ones.

Part 2 Intraday Master ClassHedging and Risk Management with Options
One of the main uses of options is hedging, or protecting against adverse price movements. For example, a portfolio manager might buy put options on stocks to guard against potential losses during market declines. This acts like insurance—limiting downside while keeping upside potential. Options can also hedge currency, interest rate, or commodity exposure. However, hedging isn’t free; the premium cost reduces overall returns. Smart traders use hedging selectively, balancing risk and cost. In volatile markets, effective hedging with options can prevent significant capital erosion and ensure stability in long-term investment strategies.

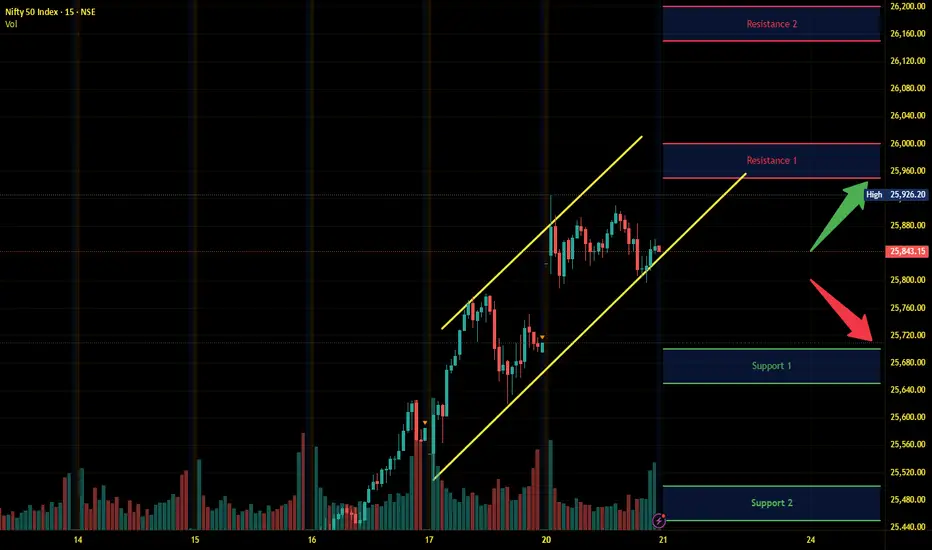
Nifty Intraday Analysis for 21st October 2025NSE:NIFTY
Diwali Muhurat trading day for one hour trading and low volume with narrow range expected.
Index has resistance near 25950 – 26000 range and if index crosses and sustains above this level then may reach near 26150 – 26200 range.
Nifty has immediate support near 25700 – 25650 range and if this support is broken then index may tank near 25500 – 25450 range.
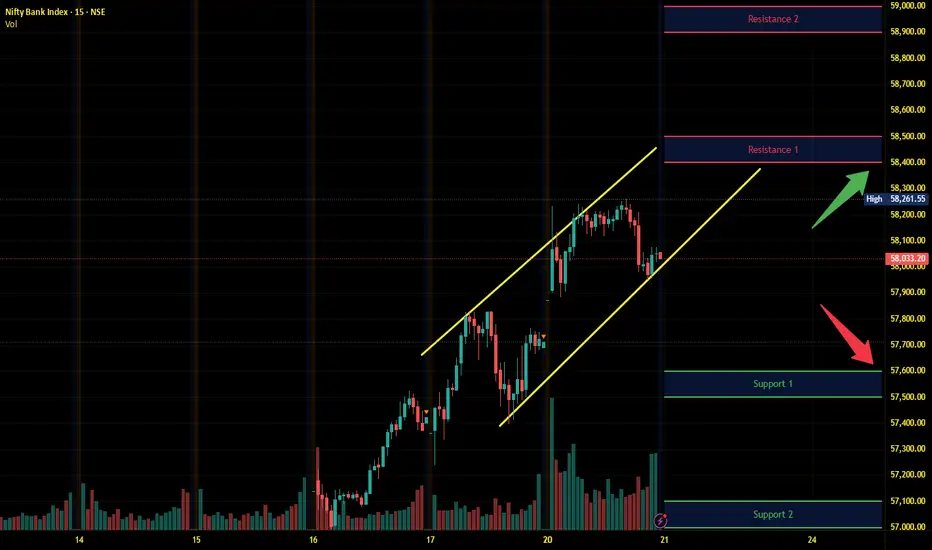
Banknifty Intraday Analysis for 21st October 2025NSE:BANKNIFTY
Diwali Muhurat trading day for one hour trading and low volume with narrow range expected.
Index has resistance near 58400 – 58500 range and if index crosses and sustains above this level then may reach near 58900– 59000 range.
Banknifty has immediate support near 57600 - 57500 range and if this support is broken then index may tank near 57100 - 57000 range.
Finnifty Intraday Analysis for 21st October 2025NSE:CNXFINANCE
Diwali Muhurat trading day for one hour trading and low volume with narrow range expected.
Index has resistance near 27725 - 27725 range and if index crosses and sustains above this level then may reach near 27950 - 28000 range.
Finnifty has immediate support near 27350– 27300 range and if this support is broken then index may tank near 27125 – 27075 range.

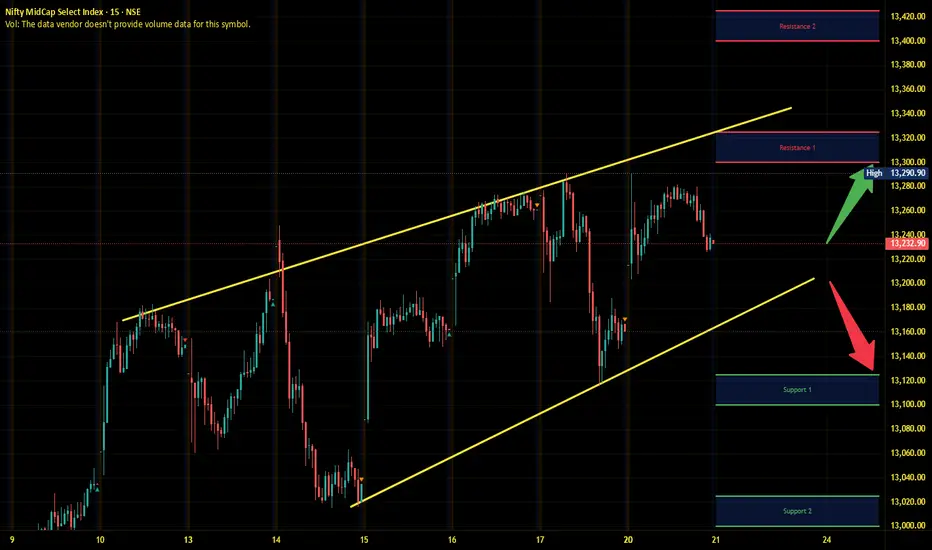
Midnifty Intraday Analysis for 21st October 2025NSE:NIFTY_MID_SELECT
Diwali Muhurat trading day for one hour trading and low volume with narrow range expected.
Index has immediate resistance near 13300 – 13325 range and if index crosses and sustains above this level then may reach 13400 – 13425 range.
Midnifty has immediate support near 13125 – 13100 range and if this support is broken then index may tank near 13025 – 13000 range.
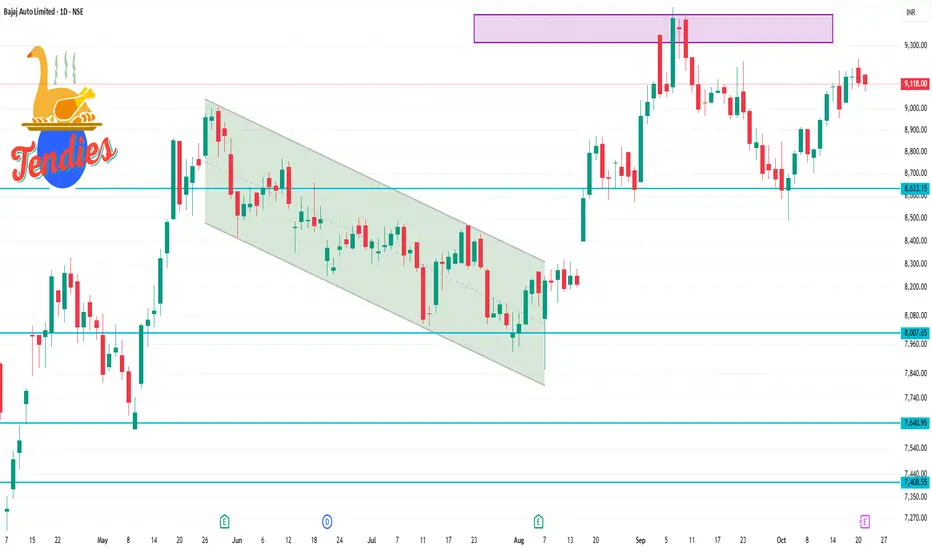
BAJAJ-AUTO ! day time Frame Price & range context
Last close: ~ ₹9,150.50.
Day’s range: approx ₹9,090.50 (low) to ₹9,194.50 (high).
52-week range: from ~ ₹7,089.35 (low) to ~ ₹10,829.85 (high).
Key technical levels (daily pivot / support / resistance)
From sources:
Classic daily pivot: ~ ₹9,145.17.
Immediate support levels: ~ ₹9,095.83, ~ ₹9,041.17, ~ ₹8,991.83.
Immediate resistance levels: ~ ₹9,199.83, ~ ₹9,249.17, ~ ₹9,303.83.
So, roughly speaking:
A support zone around ₹9,040–9,100.
A resistance zone around ₹9,200–9,300.
The pivot is close to the current level (~₹9,145), which suggests the stock is near a “balance” level for the day.