Gujarat Pipavav Port - Heading towards All Time HighGujarat Pipavav Port is heading towards all time high i.e. ~100% return on account of following:
1. Quarter on Quarter best results are coming and last Q showed best returns
2. On charts, it is moving in a parallel channel and making High Highs and Lower Lows that too on weekly time frame.
3. Even only weekly time frame, it has consolidated and now ready to move.
4. Please see 2 green marks, which shows start of HH pattern after touching the lower parallel channel.
Keep following @Cleaneasycharts as we provide Right Stocks at Right Time at Right Price!!
Cheers!!
Trend Lines

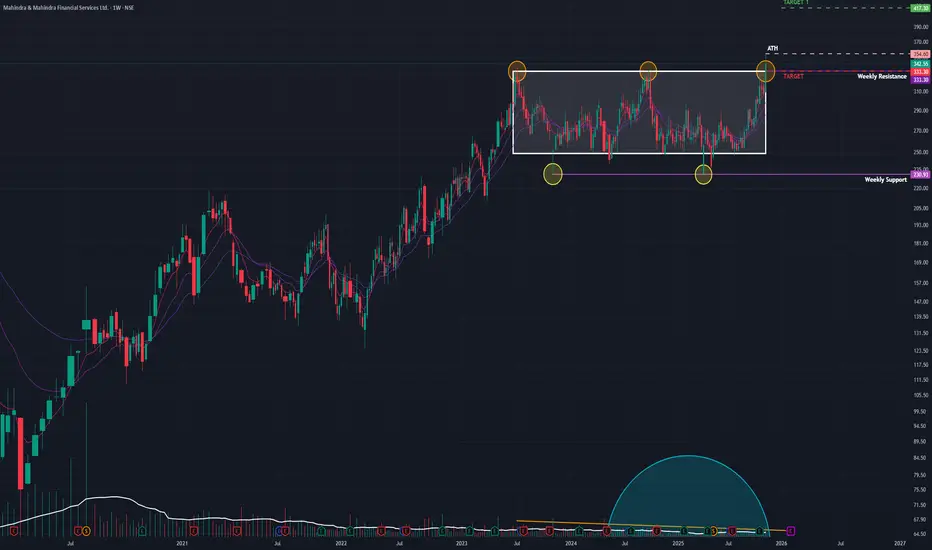
M&M Fin (W): Bullish, Breakout with Short-Term Rejection(Timeframe: Weekly | Scale: Logarithmic)
The stock has confirmed a major multi-year breakout, moving into "Blue Sky" territory. However, the daily price action suggests a temporary pullback (re-test) is imminent before the uptrend resumes.
📈 1. The Breakout Structure (The "Big Picture")
- The Setup: The stock has been trapped in a consolidation phase since its July 2023 peak. The ₹330–₹335 zone acted as a rigid "ceiling" for over two years.
- The Breakout: The week of Nov 17 was decisive. The stock surged 10.98% , closing above this multi-year resistance for the first time.
- Volume: The move was backed by 29.74 Million in volume —a significant expansion compared to the "dry" consolidation phase, confirming institutional participation.
🕯️ 2. The "Shooting Star" Warning (Daily Chart)
- The Pattern: The last daily candle (Friday) formed a Shooting Star . It opened high, rallied to a new peak (~₹354), but faced heavy selling pressure to close near the lows (~₹342).
- Implication: This "long upper wick" shows that sellers are aggressively defending the ₹350+ level. It strongly suggests that the breakout is "tired" and a re-test of the breakout zone is likely next week.
🚀 3. The Fundamental Catalyst (The "Why")
This technical move is supported by strong fundamentals, which adds confidence to the long-term bullish view:
- Earnings: The breakout is a delayed reaction to strong Q2 FY26 results, where Net Profit surged ~54% YoY and asset quality improved.
- Outlook: This fundamental strength suggests that any dip (re-test) will likely be bought by smart money.
📊 4. Indicators & Trend
- RSI & EMAs: RSI is rising (bullish momentum) and EMAs are in PCO state (trend alignment) across Monthly and Weekly charts. This confirms the primary trend is UP.
🎯 5. Future Scenarios & Key Levels
The "Shooting Star" dictates the immediate game plan: Wait for the Re-test.
🐂 The Bullish Case (Buy the Dip)
- The Strategy: Watch for the stock to pull back to the ₹333 – ₹335 zone (the resistance-turned-support).
- Confirmation: If the price stabilizes or forms a bullish candle (like a Hammer) at this level, it is a high-probability entry.
- Target 1: ₹417
- Target 2: ₹475
🐻 The Failure Case (Fakeout)
- Trigger: If the selling pressure from the Shooting Star intensifies and the stock closes back below ₹333.
- Consequence: This would confirm a "fakeout" (bull trap), and the stock could slide back toward the consolidation midpoint around ₹300.
Conclusion
The breakout is genuine, but the Shooting Star signals a short-term pause. The ideal approach is to wait for the re-test at ₹335 to confirm that the "ceiling" has truly become a "floor."
BUY TODAY SELL TOMORROW for 5%DON’T HAVE TIME TO MANAGE YOUR TRADES?
- Take BTST trades at 3:25 pm every day
- Try to exit by taking 4-7% profit of each trade
- SL can also be maintained as closing below the low of the breakout candle
Now, why do I prefer BTST over swing trades? The primary reason is that I have observed that 90% of the stocks give most of the movement in just 1-2 days and the rest of the time they either consolidate or fall
Trendline Breakout in CHENNPETRO
BUY TODAY SELL TOMORROW for 5%

BUY TODAY SELL TOMORROW for 5%DON’T HAVE TIME TO MANAGE YOUR TRADES?
- Take BTST trades at 3:25 pm every day
- Try to exit by taking 4-7% profit of each trade
- SL can also be maintained as closing below the low of the breakout candle
Now, why do I prefer BTST over swing trades? The primary reason is that I have observed that 90% of the stocks give most of the movement in just 1-2 days and the rest of the time they either consolidate or fall
Trendline Breakout in Anuras
BUY TODAY SELL TOMORROW for 5%

BSE Ltd TargetsThe Recent expected Targets from BSE Ltd can be set at 3135 and 3438. If the stock hits resistance at this level then the support levels of this stock can be 2710 and 2600. Held this stock even when it hit lows in Aug and Sept as RSI indicated a reversal and it paid off.

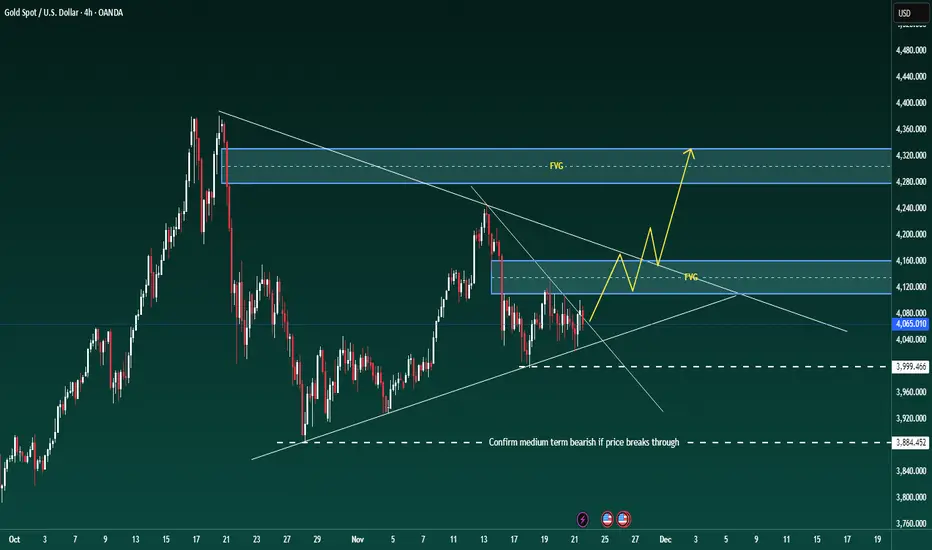
XAUUSD – ACCUMULATION TRIANGLE ON D1💛 XAUUSD – ACCUMULATION TRIANGLE ON D1, AWAITING A NEW BREAKOUT THIS WEEK 🎯
🌤 Overview of the New Week
Hello everyone, Lana here 💬
Gold, after a very strong rise from the 3,500 region to above 4,400, is entering a "resting" phase on the D1 frame: the price continuously tests the upward trendline but has not yet broken it to confirm a downtrend.
The market is clearly waiting for a real breakout before forming a new medium-term wave.
Next week, we have CPI and PPI – important inflation data that could act as a catalyst to push gold out of the current accumulation zone.
💹 Technical Analysis (Daily Triangle)
On the D1 frame, when connecting the descending peaks and ascending bottoms, gold is in a narrowing triangle pattern.
The upward trendline below is still maintained, indicating that the medium-term trend has not reversed.
Below are important zones:
≈ 3,890: if the price closes below this area, it could confirm medium-term weakening.
Fibonacci & psychological resistance zone 3,800–3,900: strong support, confluence with old price structure.
POC Volume Profile around 3,650: if a deep decline scenario occurs, this will be the next price attraction zone.
Above, the old peak zone around 4,300–4,400 remains a large liquidity zone, a natural target if gold breaks the upper edge of the triangle.
In summary: the more compressed the triangle, the stronger the breakout – the direction will depend heavily on CPI/PPI data & Fed expectations.
🎯 Reference Trading Plan (Medium-Term)
💖 Scenario 1 – Maintain Uptrend (priority when the trendline is not broken)
Observe the reaction at the D1 upward trendline (area around 4,000).
If the price continuously bounces from the trendline and stays above the 3,890 area, you can:
Prioritize buying according to the trend at support retests on H4–H1.
Medium-term targets: 4,150 → 4,250 → 4,300–4,400 if the triangle breaks upwards.
💢 Scenario 2 – Triangle Breaks, Shifts to Medium-Term Decline
If D1 closes below 3,890:
Consider this a signal confirming medium-term weakening.
Prioritize selling at newly formed resistance zones.
Step-by-step targets: 3,800 → 3,700 (POC) → 3,500 (strong previous support).
In both scenarios, specific entry points should be refined on smaller frames (H4, H1) based on price action/OB/FVG.
⚠️ Note News & Risk Management
Next week's CPI & PPI could be the "final blow," pushing gold out of the triangle – volatility can be wide and fast, spreads may widen.
Last week's NFP news hardly created big waves for gold after the US government shutdown, indicating the market is holding strength waiting for more important data.
🌷 Conclusion & Interaction with LanaM2
Gold on D1 is in the final stage of the accumulation triangle – this is a time where patient observation is as important as a beautiful entry point 💛
Next week, I will continue to update daily details on smaller frames so everyone can have more specific entry points.

Mastering Technical Analysis1. What Is Technical Analysis?
Technical analysis is a method of forecasting market movement by studying price charts, trading volume, indicators, and patterns. Unlike fundamental analysis—which focuses on earnings, economic data, and intrinsic value—TA assumes that all information is already reflected in the price.
At its core, technical analysis is built on three key assumptions:
1. Market action discounts everything
Every factor—economic data, news, global events—gets absorbed into price.
2. Prices move in trends
Markets do not move randomly. They follow identifiable patterns: uptrends, downtrends, or sideways ranges.
3. History repeats itself
Human behavior, fear and greed, and market psychology create recurring patterns.
These principles allow traders to anticipate moves with probability, not certainty.
2. Understanding Price Structure
a. Dow Theory Basics
Dow Theory forms the foundation of technical analysis:
Market moves in three trends: primary (major), secondary (pullbacks), and minor (small fluctuations).
Trends stay in effect until clear reversal signals appear.
Volume confirms price movement.
b. Market Trends
A trend is the direction in which prices move.
Uptrend: Higher highs (HH) + higher lows (HL)
Downtrend: Lower highs (LH) + lower lows (LL)
Sideways/Range: Price oscillates between support and resistance.
Identifying trends early is one of the biggest advantages for traders.
3. Key Elements of Technical Analysis
a. Support and Resistance
Support is a price level where buying interest dominates. Resistance is where selling pressure appears.
These levels help traders:
Time entries
Set targets
Place stop losses
Breakouts and breakdowns from these levels often indicate major moves.
b. Trendlines and Channels
Trendlines connect the lows in an uptrend and highs in a downtrend. When combined with parallel lines, they form channels, showing strong directional movement.
A break of a trendline often signals trend reversal.
c. Chart Patterns
Patterns form when price movements create recognizable shapes on charts.
Reversal Patterns:
Head and Shoulders
Inverse Head and Shoulders
Double Top / Double Bottom
Triple Tops / Bottoms
Continuation Patterns:
Flags
Pennants
Triangles
Rectangles
Chart patterns reflect collective market psychology and help forecast future direction.
4. Candlestick Patterns
Candlestick charts reveal the emotional story of buyers and sellers. Some common patterns include:
Bullish Patterns:
Hammer
Bullish Engulfing
Morning Star
Piercing Line
Bearish Patterns:
Shooting Star
Bearish Engulfing
Evening Star
Dark Cloud Cover
Combining candlestick signals with support/resistance improves accuracy.
5. Technical Indicators and Oscillators
Indicators help interpret market momentum, strength, and volatility. Although no indicator is perfect, combining a few well-selected ones enhances decision-making.
a. Moving Averages
They smooth out price movement to reveal trends.
Types:
SMA (Simple Moving Average)
EMA (Exponential Moving Average)
Common strategies:
Golden Cross (50-MA above 200-MA)
Death Cross (50-MA below 200-MA)
EMA-based trend trading
b. RSI (Relative Strength Index)
RSI measures momentum and identifies overbought (>70) and oversold (<30) conditions. It also signals divergences, which often precede reversals.
c. MACD (Moving Average Convergence Divergence)
MACD shows the relationship between two EMAs. Signals include:
Bullish or bearish crossovers
Histogram direction
Divergences
d. Bollinger Bands
These measure volatility. Price touching the upper band suggests overbought conditions; touching the lower band suggests oversold conditions. Squeezes indicate big upcoming moves.
e. Volume Indicators
Volume is essential for confirming trends.
Rising price + rising volume = strong trend
Rising price + low volume = weak trend
6. Multi-Time Frame (MTF) Analysis
Professional traders analyze charts across multiple time frames. For example:
Higher time frames (1D, 1W) show the major trend.
Lower time frames (1H, 15m) show entry opportunities.
A trade is strongest when trends align on multiple time scales.
7. Breakout and Breakdown Trading
Breakouts occur when price moves above resistance with strong volume. Breakdowns occur when price falls below support.
Successful breakout trading requires:
Volume confirmation
Retest of breakout zones
Avoiding false breakouts
8. Risk Management and Position Sizing
Mastering technical analysis is not just about reading charts. The biggest key is managing risk.
Essential rules:
Always use a stop loss
Do not risk more than 1–2% of capital per trade
Use risk-reward ratios (e.g., 1:2 or 1:3)
Trade with discipline, not emotion
Good risk management keeps you in the game long enough to experience compounding success.
9. Trading Psychology
Technical analysis is 30% charts and 70% psychology. Recognize these emotional traps:
Fear of missing out (FOMO)
Overconfidence after profit
Revenge trading after loss
Impatience and overtrading
A disciplined trader follows rules and trusts their strategy.
10. Creating Your Own Trading System
To master technical analysis, create a structured trading system:
Components of a strong system:
Market selection (stocks, indices, crypto)
Time frame (intraday, swing, positional)
Indicators (2–3 maximum)
Entry rules (breakout, pullback, pattern)
Exit rules (target, trailing stop)
Risk-reward ratios
Backtesting to validate performance
A system removes emotional decision-making and boosts consistency.
11. Combining Technical and Fundamental Analysis
While TA is powerful, combining it with fundamental catalysts—earnings, macro trends, sector strength—creates high-probability setups. For example:
Volume breakout + strong quarterly results
Trend continuation + positive economic news
This hybrid approach is used by many successful traders.
12. The Path to Mastery
Technical analysis mastery does not come overnight. It requires:
Chart practice
Backtesting historical data
Studying past cycles
Recording trades in a journal
Reviewing mistakes and refining rules
Over time, patterns become clear, and intuition develops.
Conclusion
Mastering technical analysis is a journey of learning price behavior, practicing chart reading, and developing psychological discipline. By understanding trends, patterns, indicators, and risk management, traders gain the ability to anticipate market moves with greater confidence. TA does not guarantee profits—it improves probabilities. Combined with discipline, patience, and a structured approach, it becomes a powerful skill that can transform your trading performance.

Plan your trades and trade your plan1. Why Planning Matters in Trading
Trading without a plan is like entering a battlefield without a strategy. Markets are unpredictable, influenced by global events, economic data, institutional activity, and trader psychology. Without a plan, emotions such as fear, greed, and impatience take over, resulting in poor decisions.
A well-crafted trading plan helps you:
Reduce emotional decision-making
Identify high-probability setups
Manage risks professionally
Improve consistency
Evaluate and improve your performance over time
Planning creates a roadmap. Instead of reacting impulsively, you follow a set of rules designed specifically for your trading style and risk tolerance.
2. Define Your Trading Goals
Every trader must begin with clear goals. Ask yourself:
Do you want steady short-term gains or long-term wealth building?
Are you trading to supplement income or become a full-time trader?
What is your acceptable level of risk?
Setting goals helps determine the market you trade, your strategy, time commitment, and expectations. For example:
Intraday traders focus on daily volatility and need quick decisions.
Swing traders hold trades for days or weeks.
Positional traders rely more on long-term charts and fundamental strength.
Your trading plan should reflect your goals and lifestyle. If you cannot monitor markets all day, intraday trading is unsuitable; swing or positional trading is better.
3. Choose Your Market and Instruments
Planning involves knowing what you will trade:
Stocks
Indices (Nifty, Bank Nifty)
Commodities (Gold, Crude oil)
Forex
Crypto
Futures & Options
Each market behaves differently. For example, Bank Nifty is highly volatile and suits active traders, while large-cap stocks suit long-term positional trades. By focusing on a specific market, you develop familiarity and improve accuracy.
4. Develop a Strategy
Your trading plan must include a clear strategy with defined rules. A strategy answers:
When to enter
When to exit
How to manage risk
How to manage position size
For example, a simple breakout strategy may include:
Setup: Stock consolidates near resistance
Entry: Buy above breakout candle high
Stop-loss: Below consolidation zone
Target: 1:2 or 1:3 risk–reward ratio
Alternatively, a swing strategy might use:
Moving averages
RSI divergence
Candlestick confirmation
Support/resistance zones
The key is not the complexity of the strategy, but consistency in applying it.
5. Set Clear Entry and Exit Rules
No trade should be taken without predefined rules.
Entry Rules
An entry rule should be objective. Example:
Price closes above 20-day high
Volume is above average
RSI crosses above 50
Trend is supported by higher highs and higher lows
Entry should never be based on rumors, tips, or fear of missing out.
Exit Rules
A disciplined trader exits based on:
Pre-set stop-loss
Target levels
Trail stop-losses
Trend reversals
Exit rules prevent emotional decisions. Even if the market reverses, you stick to your plan.
6. Risk Management: The Heart of Planning
Risk management decides whether you survive in the market. Many traders lose money because they ignore this step.
Key Components of Risk Management
a) Stop-Loss
A stop-loss is mandatory for every trade. It limits the loss when the market moves against you.
b) Position Size
Never risk more than 1–2% of your capital on a single trade.
Example:
If your capital is ₹1,00,000, risk per trade should be ₹1,000–₹2,000.
c) Risk–Reward Ratio
A healthy risk–reward ratio (RRR) ensures long-term success.
Minimum acceptable ratio: 1:2
Meaning: If you risk ₹100, aim to earn ₹200
Good traders focus on trades with high RRR instead of trying to win every trade.
7. Market Analysis Before Entering
Before you take a trade, analyze:
a) Trend
Trade with the trend:
Uptrend → Look for long positions
Downtrend → Look for shorts or avoid longs
b) Support and Resistance
Identify levels where price is likely to react.
c) Volume Analysis
Volume confirms the strength of the move.
d) Chart Patterns
Double bottoms, flags, triangles, and head & shoulders provide high-probability setups.
e) Candlestick Patterns
Hammers, engulfing candles, and dojis offer confirmation signals.
8. Maintain a Trading Journal
A trading plan is incomplete without a trading journal. Record:
Date and time
Entry and exit
Stop-loss and targets
Reason for trade
Emotions before and after
Outcome and learnings
A journal reveals patterns in your behaviour—emotional trades, overtrading, revenge trading—and helps improve performance.
9. Avoid Emotional Trading
Emotions destroy consistency. Common emotional mistakes include:
Fear of missing out (FOMO)
Greed (holding too long)
Fear (exiting too early)
Revenge trading
Overconfidence after a winning streak
Your goal is to follow your plan, not your feelings. With a plan, you avoid impulse trades and maintain discipline.
10. Backtest and Practise Your Trading Plan
Before using real money, test your strategy on historical data. Backtesting helps determine:
Profitability
Accuracy
Maximum drawdown
Risk–reward performance
Paper trading (demo trading) strengthens confidence and skill before risking capital.
11. Review and Improve Your Plan Regularly
Markets evolve. A trading plan should be dynamic.
Review monthly or quarterly:
Win-loss ratio
Average return
Maximum loss
Psychological mistakes
Strategy performance
Adjust your plan when necessary. Improvements may include:
Better entries
Tighter stop-loss
Reduced position size
Using trailing stops
Focusing on fewer, higher-quality setups
12. Final Thoughts: Discipline Creates Success
A well-crafted trading plan is your foundation. Everything else—charts, indicators, and setups—comes secondary. A plan helps you stay consistent, disciplined, and focused. Remember:
You cannot control the market
You can control your behaviour
The most successful traders are not those with the most complex indicators, but those who follow their plan with discipline every single day.

Public Sector Banks in the Trading Market1. What Are Public Sector Banks?
Public Sector Banks are commercial banks where the Government of India holds majority ownership, usually above 51%. These banks operate under government oversight and play a vital role in:
Mobilizing public savings
Lending to priority sectors
Executing government welfare schemes
Providing financial inclusion
Supporting economic stability
Some major PSBs include:
State Bank of India (SBI) – India’s largest bank
Bank of Baroda (BoB)
Punjab National Bank (PNB)
Canara Bank
Union Bank of India
Indian Bank
Bank of India (BoI)
UCO Bank, Bank of Maharashtra, Central Bank of India, etc.
These banks collectively hold nearly two-thirds of India’s banking assets, giving them huge influence in stock market behaviour.
2. Importance of PSBs in the Trading Market
a) High Liquidity and Trading Volumes
PSB stocks like SBI, BoB, and PNB consistently appear in the NSE’s most-traded list, making them attractive for:
Intraday traders
Swing traders
Options traders
Institutional investors
Liquidity ensures narrower spreads, faster order execution, and stable price discovery.
b) Macro Indicators
PSBs reflect the health of:
Credit growth in the economy
Corporate borrowing trends
Housing and retail loan demand
Government capital expenditure
Stress in sectors like MSME or agriculture
Thus, traders use PSB performance to gauge broader market trends.
c) Interest Rate Impact
Bank profitability is heavily dependent on the interest rate cycle.
Rising rates → higher net interest margin (NIM) → PSBs rally
Falling rates → lower margins → PSBs correct
Therefore, PSB stocks move quickly after:
RBI monetary policy
Inflation data
Government bond yield changes
This makes them ideal for event-based trading.
3. How Public Sector Bank Stocks Behave
PSB stocks often show cyclical behaviour related to the broader economy.
a) Credit Demand Cycle
When corporate and retail loan demand is strong:
Bank lending grows
NIMs improve
Profitability increases
Stocks rally
During slowdowns, lending slows and PSBs weaken.
b) NPA (Non-Performing Assets) Influence
A major factor that affects PSB valuations is bad loans.
High NPAs = weak valuations
Lower NPAs = strong re-rating and investor confidence
Whenever PSBs report declining NPAs, stocks usually see multi-month rallies.
c) Government Recapitalization
PSBs sometimes require government capital infusion to strengthen balance sheets.
Announcements of recapitalization often cause:
Short-term volatility
Long-term stability
Such events attract traders seeking momentum.
4. Key Factors Traders Track in PSBs
1. RBI Monetary Policy
Interest rate hikes usually have a positive impact on PSBs initially but may impact loan growth later. The reverse is true for rate cuts.
2. Credit Growth Data
Higher loan growth = bullish sentiment.
3. NPA Trends
Quarterly results showing reduced NPAs cause strong buying.
4. Provisioning Coverage Ratio
Higher provisioning means lower future risk.
5. Government Policies
Schemes like:
Jan Dhan Yojana
Mudra loans
PM Kisan
Affordable housing subsidies
impact PSB balance sheets as these banks execute most government programs.
6. Bond Yield Movements
Bond yields impact treasury income. PSBs hold large government bond portfolios, so:
Falling yields → appreciate bond prices → higher profits
Rising yields → mark-to-market losses
This directly affects stock movements.
7. Global Market Sentiment
PSBs often move in line with:
US interest rate trends
Crude oil prices
Global risk appetite
Because they reflect India’s financial stability.
5. Why Traders Prefer PSB Stocks
✔ Volatility and Momentum
PSBs offer clear trending phases and sharp breakouts during periods of:
Economic expansion
NPA reduction
Privatization rumours
Monetary policy shifts
Their volatility works well for both intraday and swing trading.
✔ High Options Activity
PSBs like SBI and PNB have:
Liquid options
Tight premiums
Wide strike selections
This helps option sellers and buyers trade with confidence.
✔ Low Valuation Base
PSBs often trade at low price-to-book (P/B) ratios compared to private banks. So when re-rating happens, rallies are stronger and sustained.
✔ Strong Institutional Participation
FIIs and DIIs frequently invest in PSBs during bullish economic cycles. Their buying creates long uptrends.
6. Risks in Trading Public Sector Banks
PSBs carry unique risks that traders must consider.
1. High Exposure to Government Schemes
While beneficial for society, these schemes sometimes:
Reduce profitability
Increase operational costs
Lead to higher NPAs in certain sectors
2. Slow Decision-Making
Compared to private banks, PSBs may be slower to adapt to:
Digital banking
Fintech competition
Modern risk assessment systems
This can limit valuation expansion.
3. Vulnerability to Economic Stress
PSBs are more exposed to:
MSME distress
Agriculture stress
Infrastructure lending defaults
These risks cause periodic corrections.
7. Trading Strategies for Public Sector Banks
1. Event-Based Trading
Best events for trading PSBs:
RBI monetary policy
Union Budget
Quarterly results
NPA announcements
Government recapitalization news
Privatization rumours
Traders often take positions before or after these events.
2. Trend Following Strategies
PSBs tend to show long, clean trends. Traders use:
20/50/200 EMA crossovers
RSI breakout levels
Price-volume surge patterns
Trendline breakouts
Trending phases provide multi-week or multi-month opportunities.
3. Options Strategies
Popular strategies:
Bull call spread (during NPA improvement cycles)
Short straddle/strangle (during consolidation phases)
Protective put (around volatile policy announcements)
4. Pair Trading
Traders sometimes pair:
SBI vs Bank of Baroda
PNB vs Union Bank
Canara Bank vs Indian Bank
Based on relative strength comparisons.
8. Long-Term View of PSB Stocks
Historically, PSBs have delivered inconsistent long-term returns, but cycles of reform — such as:
Bank mergers
Digital transformation
NPA resolution
Government capital infusion
Interest rate cycles
have created powerful rally phases.
Investors who entered during undervalued periods often gained significantly over the long term.
Conclusion
Public Sector Banks are foundational pillars of India’s financial ecosystem. For traders, they offer a rare combination of:
High liquidity
Strong correlation with macroeconomic trends
Event-driven volatility
Clear trend opportunities
Attractive options trading potential
However, trading PSBs also requires careful monitoring of:
NPAs
RBI policies
Government decisions
Bond yields
Sector-wise economic health
Understanding these factors helps traders navigate PSB stocks effectively in both short-term and long-term market environments.

When Crowd Is Bullish Then Find Sell SetupWhen Crowd Is Bullish Then Find Sell Setup
🧠 Always DYOR (Do Your Own Research)
⚖️ This is not financial advice or suggestion
👉 “Risk Is Real 💸 Stay Practical🚀”
💬 Please feel free to ask any questions (It's Free)
BINANCE:MMTUSDT

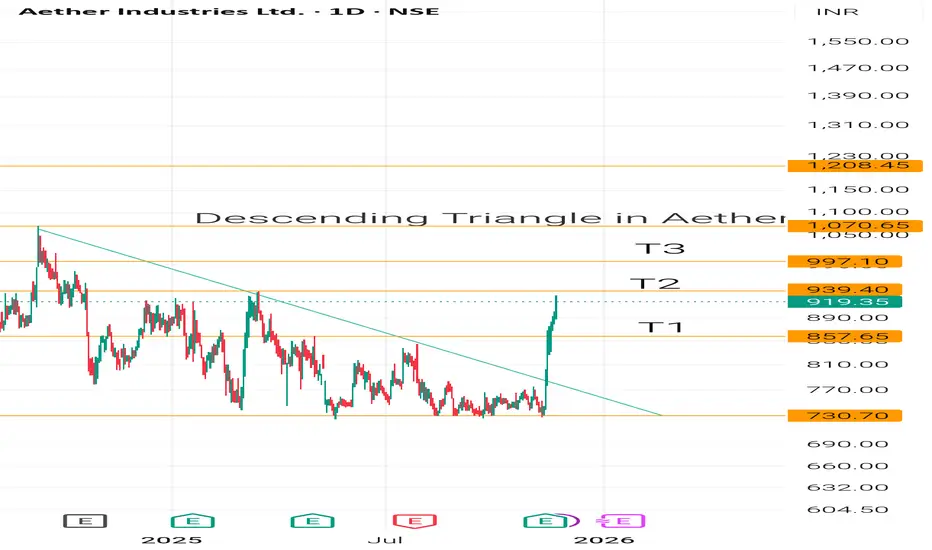
Descending Triangle Breakout Can't believe I missed this trade. I had been tracking this stock since August and the mokent I let it slip through my eyes it blasted off 🚀
BITCOIN NEED BREATHE CRYPTO:BTCUSD
BTC need take relief of selling because selling is continuously happened so one little bounce is possible and that bounce works as retest of channel breakdown.
Reverse Scenario:
Formation of any bottom pattern
V shape recovery
Long consolidation after with volume brake out.
All chances is possible but there are low possibility
🧠 Always DYOR (Do Your Own Research)
⚖️ This is not financial advice or suggestion
👉 “Risk Is Real 💸 Stay Practical🚀”
💬 Please feel free to ask any questions (It's Free)

Gold is compressed; next week’s US data will pick a side.Gold is being compressed, the upcoming US data week will determine which side is squeezed.
Good evening everyone, Brian here with a view on XAUUSD on the H2 and H4 frames for the upcoming week.
Fundamental Analysis – a "tailor-made" week for the USD
Next week is packed with US data, meaning gold will react more to numbers than narratives:
Core PPI, PPI, and Retail Sales
Initial Unemployment Claims
Prelim GDP q/q
Core PCE Price Index m/m – the Fed's preferred inflation measure
If inflation and growth come out weak, the market will lean more towards the slow growth / easing policy narrative. This usually puts pressure on the USD and supports gold, especially when real yields gradually decrease.
Conversely, stronger-than-expected data will strengthen the USD, increase yields, and create short-term downward pressure on gold. In such a context, price and liquidity areas around news release times will be more important than usual – typically, fading emotional spikes back to structural areas is safer than chasing the initial move.
Technical Analysis – triangle, FVG, and key support areas
On the H4 frame, gold is still trading within a broad triangle structure. The previous decline has stalled, with prices continuously reacting at the upward support line and around 4,000, but there has yet to be a clear breakout from the pattern.
When zooming into H1–H2:
The price has broken a short-term downtrend line and closed strongly above – this is an early signal that selling pressure in this move is weakening.
The nearest support is around 4050–4040, deeper is the 4000–3998 support band (marked on the chart as important support). As long as it holds above 4,000, the structure remains positive.
Above, we have a very important confluence area around 4135–4160 including:
Fibo 0.382 of the most recent main decline
An old fair value gap (FVG) and resistance block
Chart note: "Gold will go strong if it passes this price range" – aligns with my view: if the price accepts above this area, the potential for a stronger upward move will open up.
Around 4100 is an area prone to "large liquidity response" – expect strong profit-taking and position restructuring if the price returns to this area.
Currently, I consider the market to be accumulating above 4,000 in a corrective pattern, with a slight upward bias as long as 4,000 is maintained.
Key Price Areas
Resistance:
4100 – first liquidity area
4135–4160 – Fibo 0.382 + FVG + strong resistance
Support:
4050–4040 – nearest intraday support
4000–3998 – large frame support; if broken, the picture changes
3940 area – stronger support if 4k is breached
Trading Scenarios for Next Week
(All are for reference only, not investment advice.)
Scenario 1 – Buy when price corrects above 4,000 (foundation for the next upward wave)
Idea: follow the forming upward bias as the price respects the triangle support and the 4,000 mark.
Entry area: 4050–4040 or any clean retest of the broken downtrend line on smaller frames
Cautious position addition area: 4025–4005 if there is a deep sweep to 4,000 with a strong bounce reaction
Stop loss: below 3990–3988 depending on risk appetite
Targets:
First: 4100 (liquidity area)
Second: 4135–4140 (lower edge of FVG/resistance)
Extended: 4155–4160 if a strong continuation move appears
Signals to wait for: wick rejections from support, bullish engulfing candles, or clear intraday structural phase shifts to higher highs and lows.
Scenario 2 – Break & Retest Long above 4135–4140
If the price doesn't give a deep correction and runs straight up:
Condition: H2/H4 candle closes clearly above 4135–4140 and holds on retest
Entry: when price pulls back in a controlled manner to the 4135–4140 area, turning this area from resistance to support
SL: below 4120
TP: 4180 → 4200+ depending on momentum strength
This is the "gold goes strong" scenario as noted on the chart – viewing the FVG/0.382 area as a launchpad for a larger impulsive upward wave.
Scenario 3 – Bearish scenario if 4,000 is broken
If fundamentals and flows turn against gold, decisively pushing the price below 4,000, the bullish view needs to be set aside.
Condition: daily candle closes clearly below 4000–3998
Plan: wait for the price to retrace up to retest 4000–4020 from below
Entry: short when rejection signals appear at that retest area
TP: 3960 → 3940, then reassess the structure
When below 4,000, the triangle will break down, and the market is likely to hunt deeper liquidity areas before potentially forming a new medium-term upward wave.
In summary: as long as 4,000 holds, I prioritize the buy scenario on corrections, respecting the upward potential to 4135–4160 and beyond. If there is a decisive break below 4,000, the picture will reverse – then retracements up will be opportunities to look for shorts.
Trade according to what the structure shows, not what I hope for. Manage risk tightly around next week's data points and let the major price areas "do the heavy lifting."
If this perspective helps you plan better, don't forget to follow Brian for weekly gold analysis and share your scenarios in the comments to compare.
Part 8 Trading Master Class With ExpertsOptions Trading Styles in Markets
1. Intraday Option Trading
Fast movements
High leverage
Requires quick decision-making
2. Positional Options Trading
Holding for days or weeks
Less stressful than intraday
3. Weekly Expiry Trading (India-specific)
NIFTY & BANK NIFTY weekly options
Very popular among retail traders
Weekly options bring rapid time decay, which benefits option sellers but hurts buyers.

Part 7 Trading Master Class With Experts Non-Directional Strategies
Used when markets are expected to be sideways or volatile.
1. Straddle (Buy Call + Buy Put)
Profit from high volatility in any direction.
2. Strangle
Cheaper version of straddle, using OTM options.
3. Iron Condor
Sell OTM call and put spreads.
Used for stable markets to earn premium.
4. Butterfly Spread
Low-cost strategy for low volatility expectations.
These strategies help traders benefit from volatility, time decay, and neutral price movements.

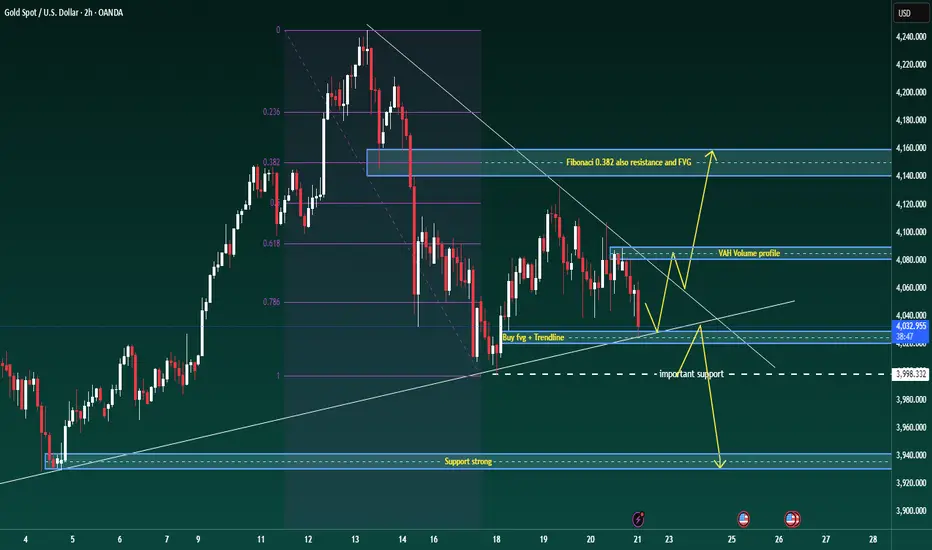
Gold is stuck in a wide range, ready for a decisive break.Good evening traders, Brian here with a fresh look at gold on the 2-hour chart.
Price is compressing in a broad sideways range, building energy for the next leg – the break from this structure will set the tone for the coming sessions.
Fundamental analysis
The core driver remains the Fed’s December decision. The market is effectively split on whether we see a cut or a delay:
A camp of institutions argues that rising unemployment and softer data could still justify a 25-basis-point cut in December, keeping pressure on the dollar and supporting gold on dips.
Others point out that the Fed is short of clean, up-to-date data and may prefer to wait until next year before committing to an easing cycle.
As a result, pricing for a December cut is roughly “fifty–fifty” and highly sensitive to the next run of labour-market and activity data.
In short: the macro backdrop is undecided, so intraday direction will be driven mainly by levels and liquidity until the next data catalyst hits.
Technical analysis
On the H2 chart, gold is in a broad consolidation after the recent sell-off:
Price is trading inside a descending structure, repeatedly respecting the short-term trendline from the recent high.
The Fibonacci retracement of the latest impulse shows the 0.382 level lining up with a prior fair-value gap and horizontal resistance – this forms a key rejection zone overhead.
Below price, there is a confluence of support where the rising trendline meets a small bullish FVG around 4027–4029, followed by a more important horizontal support band near 3998.
The volume profile highlights a Value Area High (VAH) around 4075–4080, which is likely to act as a reaction zone if price rotates back into it.
Until we break convincingly out of this structure, I treat it as a large accumulation range with a slight downside bias: sellers are still defending lower highs, but buyers are stepping in aggressively at trendline support.
Key levels
Resistance zones:
4080–4085 (VAH / short-term supply)
4135–4145 (Fibonacci 0.382 + FVG + structural resistance)
Support zones:
4027–4029 (trendline + FVG confluence buy area)
3995–4000 (important horizontal support)
3940 region (deeper support if the range finally breaks down)
Trade scenarios
1. Primary long – buy the trendline/FVG confluence
Entry: 4027–4029
Stop: 4023
Targets: 4035 – 4050 – 4068 – 4080
Idea: look for price to react at the rising trendline where it overlaps with the small FVG. A clean rejection candle or shift in intraday order flow from that zone sets up a rotation back towards the VAH and potentially the upper boundary of the range.
2. Break-and-retest short – if the trendline fails
Trigger: clear H1/H2 close below the rising trendline and the 4027 area
Plan: wait for price to retest the underside of the broken trendline / prior support
Entry: on rejection of that retest
Initial targets: 4000, then 3940 if momentum accelerates
This scenario treats any breakdown as a structural shift, using the retest as a lower-risk point to join the move rather than chasing the first leg.
3. Intraday scalp zones
These are discretionary, short-term opportunities for active traders:
Reaction sells: around 4085, and higher up if we spike into the 4135–4145 resistance band. Look for exhaustion or rejection patterns back into the range (potential targets 4060 then 4033).
Reaction buys: into 3998–4000 if we see a liquidity sweep below the current range, with tight stops and quick profit-taking back towards the mid-range.
Part 6 Learn Institutional TradingTypes of Options Strategies
Option strategies are divided into two broad categories:
- Directional Strategies
Used when you expect the market to move strongly in one direction.
1. Long Call
Profit from big upward moves.
2. Long Put
Profit from major downward moves.
3. Bull Call Spread
Buy call + Sell call (higher strike)
Reduces cost and risk.
4. Bear Put Spread
Buy put + Sell put (lower strike)

Part 4 Learn Institutional Trading Option Pricing Concepts (Greeks)
Option pricing models use various mathematical tools called Greeks:
1. Delta
Measures how much an option's price moves with the underlying asset.
Call delta: 0 to 1
Put delta: 0 to –1
2. Theta
Measures time decay—how much premium decreases daily.
3. Vega
Measures sensitivity to volatility.
4. Gamma
Indicates how delta changes as the underlying moves.
These Greeks help traders understand risk and adjust their strategies.

Part 3 Learn Institutional Trading 1. Option Buying Risks
High time decay
Entire premium can be lost
Low probability of profit if market does not move fast
2. Option Selling Risks
Unlimited loss potential
Requires high margin
Needs strong risk management skills
3. Volatility Risk
Changes in implied volatility affect premium prices.
4. Liquidity Risk
Low liquidity leads to poor fill prices.
5. Emotional Risk
Options move fast, causing psychological stress for beginners.
Thus, risk management, position sizing, and discipline are essential.

Candle Patterns Candlestick patterns are one of the most widely used tools in technical analysis. Originating from 17th-century Japanese rice trading, they provide visual information about market psychology, price momentum, and potential trend reversals. Each candlestick represents price movement during a specific time period—whether 1 minute, 1 hour, 1 day, or more. By studying candlestick patterns, traders try to anticipate whether buyers or sellers are gaining control and what the next move might be.
A candlestick consists of four key data points: open, high, low, and close. The body of the candle reflects the distance between the open and close, while the wicks (also called shadows) indicate the highs and lows. A bullish candle typically closes higher than it opens, while a bearish candle closes lower. When these candles form specific shapes or sequences, they become candlestick patterns.
Candlestick patterns fall into three major categories: bullish reversal, bearish reversal, and continuation patterns. Understanding each helps traders identify potential turning points and trend confirmations.

Premium Chart Pattern Understanding Chart Patterns
Every chart pattern represents crowd psychology—fear, greed, uncertainty, accumulation, or distribution. Institutional traders leave their footprint on charts, and patterns help retail traders align with their moves.
Patterns are formed across all time frames:
1-minute charts for scalping
5–15 minutes for intraday
1 hour for swing trading
Daily/weekly charts for positional trading
The bigger the time frame, the more reliable the pattern.

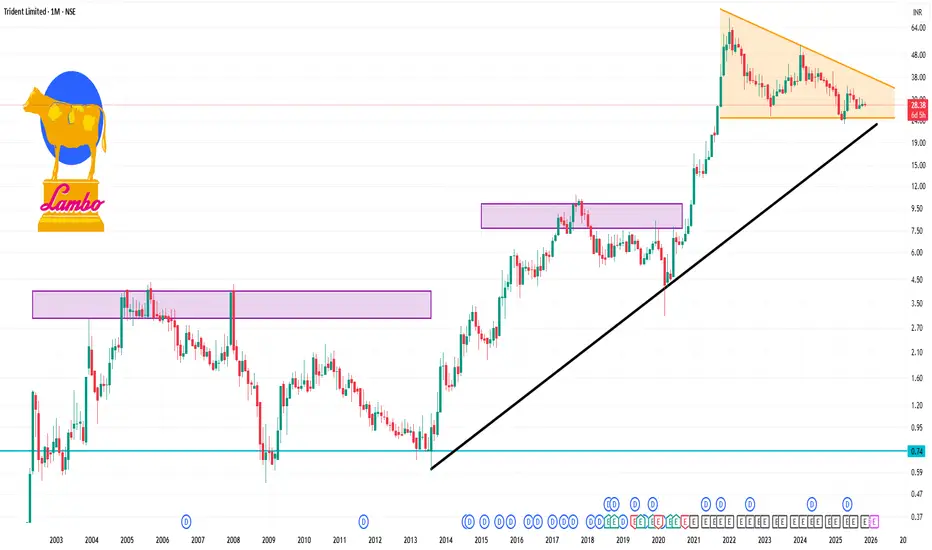
TRIDENT 1 Month Time Frame ✅ What we see
Fundamentals
Current price ~ ₹28.38.
Market cap ~ ₹14,462 cr, P/E ~32.8×, P/B ~3.15×.
ROE quite low (~8-10% range) and growth over past years has been muted.
52-week high ~ ₹40.20, 52-week low ~ ₹23.11.
Recent quarterly figures: sales up modestly; profits under pressure.
Technical / Price context
The share is nearer to its 52-week low than high, which may offer perceived value to some.
Some moving-average crossovers (per reports) flagged “sell signals” in short term.
Short-term return in past month has been very small (~0.64% 1-month return).
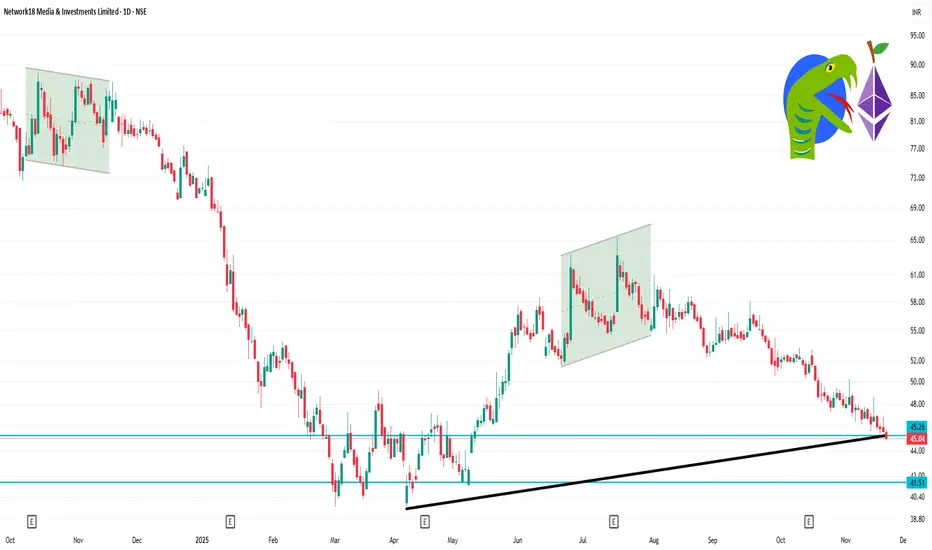
NETWORK18 1 Day Time Frame Current Price: ~ ₹ 45.04.
Day’s Range: ~ ₹ 44.89 (low) to ₹ 45.76 (high)
Key Support Level: Around ₹ 44.50-45.00 — if price breaks below this, further downside may open.
Key Resistance Level: Around ₹ 46.50-47.00 — if price breaks above this with volume, upside potential may resume.
52-week range: Low ~ ₹ 39.66, High ~ ₹ 85.39.