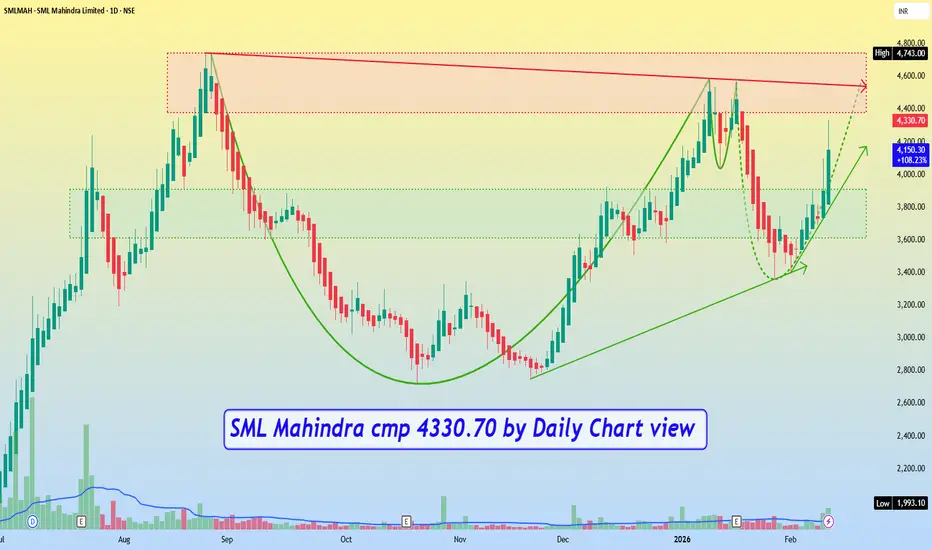
SML Mahindra cmp 4330.70 by Daily Chart viewSML Mahindra cmp 4330.70 by Daily Chart view
- Support Zone 3610 to 3910 Price Band
- Resistance Zone 4380 to ATH 4743 Price Band
- Volumes are spiking above avg traded qty over past few days
- Bullish Cup & Handle with in completion stage Rounding Bottom
- Support Zone is standing ground for up trending price momentum
Trendlineanalysis
Part 1 Institutional Trading VS. Technical Analysis What Is Premium?
The premium is the price of the option contract. It is influenced by several factors:
Current price of the underlying
Strike price
Time remaining till expiry
Volatility
Interest rates
Dividends
Premiums are higher when:
Market is volatile
Expiry is far away
Stock price is near the strike price

Breakdown or Breakout – Gold Compression Phase🔎 Market Context
• Gold is compressing within the 5000 – 5080 range
• Accumulation phase after the previous sharp sell-off
• Volatility is contracting → expansion is likely soon
• CPI & Non-Farm Payrolls are key catalysts
➡ Do not predict direction. Wait for a confirmed breakout.
📌 Strategic Zones
Resistance: 5078–5080 | 5100 | 5148 | 5200 | 5300 | 5345
Support: 5000 | 4980 | 4850 | 4830 | 4600 | 4400
• 5078–5080: Upper boundary of the range
• 5000: Lower boundary of the range
• 4980: Market structure decision level
⚖ Trading Bias
• Above 5080 → Favor upside continuation (Wave C extension)
• Below 4980 → Bullish structure breaks → favor downside
• Inside 5000–5080 → Compression phase, avoid FOMO
⚠ Key Notes
• Major data releases may cause false breakouts
• Wait for candle close confirmation
• Volatility likely to increase → manage risk carefully
• Avoid trading mid-range without clear edge

Part 3 Institutional Option Trading VS. Technical Analysis⭐Why Trade Options? Benefits
Lower capital requirement than futures or stocks.
Unlimited profit potential for buyers (CE/PE).
Limited risk — premium paid is the maximum loss.
Multiply returns because of leverage.
Profit in any market direction — up, down, or sideways.
Hedge portfolio risk (insurance for your positions).
Create income strategies, like selling options.
Combine multiple options for advanced setups.
Manage risk precisely using Greeks.
Control emotions better with predefined risk.

Part 2 Institutional Option Trading VS. Technical Analysis⭐ Types of Options
Two main types:
Call Options (CE)
A call gives you the right to buy.
You buy a call when you expect the market to go up.
If the price rises, your call premium increases.
You can sell the call later and book profit.
You are not required to buy the stock — you only trade the premium.
Put Options (PE)
A put gives you the right to sell.
You buy a put when you expect the market to fall.
If the price falls, your put premium increases.
You sell the put later to book profit.
No obligation to actually sell the stock.

Part 3 Institutional Trading VS. Technical Analysis🔹 Two Types of Options
Call Option (CE) → Right to BUY
Put Option (PE) → Right to SELL
🔹 Two Ways to Trade Them
Buy option (you pay premium)
Sell option (you receive premium)

Jayaswal Neco Inds cmp 78.50 seen by the Daily Chart viewJayaswal Neco Inds cmp 78.50 seen by the Daily Chart view
- Support Zone 64 to 70 Price Band
- Resistance Zone 78.50 to 84.50 Price Band
- Good bottom around Support Zone upper end

Part 2 Intraday Institutional Trading Option Buyers vs Option Sellers
There are two sides to every option contract:
1. Option Buyer (Holder)
Pays a premium
Has limited risk (only premium paid)
Has unlimited profit potential (for calls)
Benefits from volatility
2. Option Seller (Writer)
Receives a premium upfront
Has limited profit (only premium earned)
Has potentially unlimited risk
Benefits when the market remains stable
Buyers look for big moves; sellers look for stability.

Oil India Ltd cmp 488 by Daily Chart viewOil India Ltd cmp 488 by Daily Chart view
- Support Zone 465 to 487 Price Band
- Resistance Zone 52 to 545 Price Band
- Support Zone tested retested for probable reversal
- Volumes spiking intermittently above average traded quantity
- Breakout from 1st Falling Resistance Trendline, 2nd Breakout anticipated
- Bullish Rounding Bottoms around Support Zone and by Resistance Zone neckline

Best Sectors For DIP Buying: Long-Term Investor + Smart TraderUnderstanding DIP Buying at a Sector Level
Sector-based DIP buying works better than stock-only dip buying because:
Sector corrections are often cyclical, not permanent
Money rotates between sectors, not out of markets forever
Institutions buy sectors in phases, not randomly
The goal is to buy quality sectors during pessimism, not hype.
1. Banking & Financial Services
Why banks are prime DIP-buying candidates
Banking is one of the most cyclical sectors in any economy. Corrections often occur due to:
Interest rate uncertainty
Rising NPAs fears
Credit cycle slowdowns
Regulatory tightening
Yet banks are the backbone of economic growth.
Why dips happen
Rate hikes compress short-term margins
Liquidity fears create panic
Temporary credit slowdown
Why dips are opportunities
Strong banks adapt faster to rate cycles
Loan growth rebounds with GDP recovery
Financialization keeps expanding
Best for DIP buying
Large private banks
Strong PSU banks post-cleanup
NBFCs with diversified loan books
📌 DIP logic: When fear peaks, banks trade below historical valuations—this is where institutions quietly accumulate.
2. Information Technology (IT & Tech Services)
Why IT corrects sharply
IT is highly sensitive to:
US recession fears
Dollar volatility
Global tech spending cuts
This makes IT stocks fall fast and deep.
Why it’s a classic DIP sector
Global outsourcing demand never disappears
Cost-cutting cycles actually increase outsourcing
Digital transformation is structural, not optional
Common dip triggers
Weak quarterly guidance
Margin compression
Hiring slowdown
Why recovery is powerful
Currency tailwinds kick in
Deal pipelines revive suddenly
Valuations re-rate quickly
📌 DIP logic: IT rarely dies—it pauses. Dips usually reflect timing issues, not broken business models.
3. Pharmaceuticals & Healthcare
Why pharma is defensive but volatile
Pharma behaves oddly:
Defensive during crises
Volatile due to regulations and approvals
Why dips occur
USFDA warnings
Price erosion in generics
R&D failures
Why it’s great for DIP buying
Healthcare demand is non-cyclical
Aging population supports long-term growth
Innovation cycles create rebounds
Ideal DIP scenarios
Regulatory scare without long-term damage
Temporary margin pressure
Currency-driven corrections
📌 DIP logic: Fear-driven pharma sell-offs often overshoot reality, creating value zones.
4. Capital Goods & Infrastructure
Why this sector crashes hard
Capital goods depend on:
Government spending
Private capex cycles
Interest rate environment
When capex slows, this sector gets punished brutally.
Why dips are golden
Infrastructure cycles last many years
Order books provide long visibility
Government-led spending revives demand
Dip triggers
Election uncertainty
Fiscal deficit concerns
Rate hike cycles
Why rebound is explosive
Operating leverage kicks in
Margins expand rapidly
Earnings surprise on the upside
📌 DIP logic: Buy when nobody believes capex will return—that’s usually the bottom.
5. FMCG & Consumer Staples
Why even defensive sectors dip
FMCG falls during:
Inflation spikes
Rural demand slowdown
Input cost pressure
Why it’s safe for DIP buying
Strong brands have pricing power
Demand never vanishes, only delays
Cash flows remain steady
Ideal DIP conditions
Margin compression due to raw material costs
Temporary volume slowdown
Sentiment-driven derating
📌 DIP logic: FMCG dips don’t last long. Institutions love buying these quietly during pessimism.
6. Energy, Oil & Gas
Why energy is deeply cyclical
Energy stocks swing due to:
Crude oil volatility
Government policy changes
Global demand fears
Why dips matter
Energy demand grows with GDP
Refining margins normalize over time
Transition to renewables creates optionality
Best DIP moments
Crude price crashes
Windfall tax fears
ESG-driven selling
📌 DIP logic: Energy is hated at bottoms and loved at peaks—DIP buying flips that psychology.
7. Metals & Mining
Why metals crash the hardest
Metal stocks are hit by:
China slowdown fears
Dollar strength
Global recession narratives
Why they rebound violently
Supply constraints kick in suddenly
Infrastructure demand revives
Commodity cycles turn faster than expected
DIP buying sweet spots
Panic around global growth
Inventory overhang fears
Peak pessimism headlines
📌 DIP logic: Metals are pure sentiment trades—best bought when macro fear dominates news flow.
8. Automobiles & Auto Ancillaries
Why autos dip frequently
Interest rate hikes
Fuel price volatility
Demand slowdown fears
Why they recover
Replacement demand never stops
EV transition creates new growth layers
Rural + urban demand cycles rotate
Best DIP phases
Sales slowdown narratives
Input cost pressure phases
Policy uncertainty
📌 DIP logic: Auto dips reward patience—cycles turn faster than expectations.
Key Rules for Sector DIP Buying
1. Buy fear, not hope
If headlines sound scary but balance sheets are intact—you’re close.
2. Time > Timing
Accumulate in tranches, not all at once.
3. Follow institutional footprints
Volume spikes at lows often signal smart money entry.
4. Avoid structurally broken sectors
DIP buying works for cyclical pain, not dying industries.
5. Align with macro cycles
Rate cuts, fiscal spending, and liquidity shifts fuel sector recoveries.
Final Takeaway
The best sectors for DIP buying are those that:
Are economically essential
Go through repeated cycles
Attract institutional capital
Have long-term relevance
Banking, IT, Pharma, Infrastructure, FMCG, Energy, Metals, and Autos consistently reward disciplined DIP buyers—not impulsive ones.
DIP buying isn’t about bravery.
It’s about preparation, patience, and psychology.

Mastering Technical Analysis: From Charts to Consistent Decision1. The Core Philosophy of Technical Analysis
Technical analysis is built on three foundational principles:
Price discounts everything
News, fundamentals, expectations, fear, and greed are all embedded in price. A chart is a real-time emotional record of market participants.
Prices move in trends
Markets rarely move randomly. Once a trend starts, it tends to persist until a clear reversal occurs.
History repeats itself
Human behavior does not change. Fear and greed create recurring patterns that appear again and again on charts.
Mastering technical analysis begins with accepting that certainty does not exist—only probability.
2. Understanding Market Structure
Before indicators, mastery begins with price structure.
a. Trends
Uptrend: Higher highs and higher lows
Downtrend: Lower highs and lower lows
Range: Sideways movement between support and resistance
Trading with the trend dramatically increases odds. Many traders fail not due to bad indicators, but because they fight the dominant trend.
b. Support and Resistance
Support is where demand overcomes supply. Resistance is where supply overwhelms demand. These levels form due to:
Institutional order placement
Psychological round numbers
Previous highs and lows
Advanced traders understand that support and resistance are zones, not exact lines.
3. Candlestick Psychology
Candlesticks are the language of price.
Each candle tells a story:
Long bodies: Strong conviction
Long wicks: Rejection of price
Small bodies: Indecision
Key candlestick formations include:
Pin bars
Engulfing patterns
Inside bars
Doji structures
However, candlesticks must be read in context—at key levels, in trends, or during breakouts. Patterns alone are meaningless without location.
4. Indicators: Tools, Not Crutches
Indicators are derivatives of price. They confirm, not predict.
a. Trend Indicators
Moving Averages (EMA, SMA)
VWAP
Used to identify direction and dynamic support/resistance.
b. Momentum Indicators
RSI
MACD
Stochastic
Momentum reveals strength or weakness, divergence, and exhaustion points.
c. Volatility Indicators
Bollinger Bands
ATR
Volatility expands before big moves and contracts before breakouts.
A master trader uses 2–3 complementary indicators, not 10 conflicting ones.
5. Volume: The Institutional Footprint
Price moves, but volume explains why.
Rising price + rising volume = healthy trend
Rising price + falling volume = weak move
Volume spikes at support/resistance = institutional activity
Volume confirms breakouts, validates reversals, and exposes false moves. Without volume, price action is incomplete.
6. Chart Patterns and Market Behavior
Chart patterns represent crowd psychology unfolding over time.
Common patterns:
Head and shoulders
Double top/bottom
Flags and pennants
Triangles
Cup and handle
Patterns work not because of shape—but because they show accumulation, distribution, or continuation by large players.
7. Multi-Timeframe Analysis
Professionals analyze markets top-down:
Higher timeframe → trend and key levels
Lower timeframe → entries and exits
For example:
Weekly defines direction
Daily defines structure
Intraday defines execution
This alignment prevents trading against higher-timeframe forces.
8. Risk Management: The Real Edge
Technical analysis without risk control is gambling.
Key principles:
Risk only 1–2% per trade
Predefine stop-loss before entry
Maintain favorable risk-reward (minimum 1:2)
Accept losses as business expenses
Mastery is not about winning every trade—it’s about surviving long enough for probabilities to play out.
9. Trading Psychology and Discipline
Charts test emotions more than intelligence.
Common psychological traps:
Overtrading
Revenge trading
Fear of missing out (FOMO)
Moving stop-losses
Ignoring plans
Elite technical traders follow rules even when emotions disagree. Discipline turns strategy into consistency.
10. Developing a Personal Trading System
True mastery comes when you:
Trade specific setups only
Use clear entry, stop, and target rules
Journal every trade
Review mistakes objectively
A simple system executed perfectly will always outperform a complex system executed emotionally.
Conclusion: The Path to Mastery
Mastering technical analysis is not about finding a “holy grail” indicator. It is about:
Understanding price behavior
Aligning with trends
Managing risk
Controlling emotions
Repeating a proven process
Charts do not predict the future—they prepare you for it.
In the end, the best technical analysts are not those who forecast perfectly, but those who respond correctly when the market reveals its hand.

Part 2 Intraday Institutional Trading What Moves Option Premium?
Premium depends on:
Underlying price movement
Time left to expiry
Volatility (IV)
Interest rates
Demand & supply
If markets move aggressively, option premiums rise quickly.

Part 5 Advance Trading Strategies Why Do Options Have Time Decay? (Theta)
Options lose value as expiry approaches.
This is called Theta Decay.
Example:
Monday premium: ₹100
Thursday premium: ₹20
Expiry day: ₹0
This happens because time is part of the option’s value. If market doesn’t move, buyer loses money; seller gains.

Part 4 Technical Analysis Vs. Institutional Option TradingPut Options (PE) Explained
Put = Right to sell
You buy a put when you expect the price to go down.
Loss is limited to premium paid.
Profit can rise significantly in sharp downtrends.
Example:
If Nifty is at 22,000 and you buy 21,900 PE, you are expecting Nifty to fall below 21,900.

Private vs. Public Banks: Who Will Win in a Trade War?Trade wars are no longer just geopolitical events—they are financial stress tests for entire economies. Tariffs, supply-chain disruptions, currency volatility, and slowing global growth directly affect capital flows, corporate profitability, and credit demand. In this environment, the banking sector becomes both a shock absorber and a transmission channel of economic stress.
The big question investors and traders ask is simple but powerful:
In a trade war scenario, will private sector banks outperform public sector banks—or vice versa?
The answer isn’t one-dimensional. It depends on balance sheet strength, risk appetite, government backing, operational efficiency, and adaptability. Let’s break it down clearly.
Understanding the Trade War Impact on Banks
A trade war typically leads to:
Slower GDP growth
Pressure on exports and manufacturing
Currency depreciation or volatility
Rising input costs
Corporate margin compression
Higher credit risk and potential NPAs
Banks feel the impact through:
Lower credit growth
Stress in MSME and export-oriented sectors
Volatile treasury income
Higher provisioning requirements
This is where the difference between private and public banks becomes critical.
Public Sector Banks: Strength Through Sovereign Support
Public sector banks (PSBs) operate with the implicit and explicit backing of the government. In a trade war, this backing becomes a major advantage.
Key Strengths
1. Government Capital Support
During economic stress, governments often inject capital into public banks to ensure stability. This reduces solvency risk and keeps lending channels open.
2. Counter-Cyclical Lending Role
Public banks are often directed to continue lending even when private banks pull back. In a trade war, this helps:
Support infrastructure projects
Maintain credit flow to MSMEs
Stabilize employment
3. Lower Risk of Bank Failure
Markets generally assume PSBs are “too important to fail.” This improves depositor confidence during volatile periods.
4. Strong Rural and PSU Exposure
Public banks are deeply connected to agriculture, public sector units, and government-linked projects, which are relatively insulated from global trade shocks.
Weaknesses of Public Sector Banks
However, trade wars also expose PSB vulnerabilities:
Higher exposure to stressed sectors like steel, power, and exports
Slower decision-making due to bureaucracy
Lower profitability and ROE
Historically higher NPAs during downturns
In a prolonged trade war, asset quality deterioration can resurface, forcing higher provisioning and pressuring stock performance.
Private Sector Banks: Agility and Precision
Private banks thrive on efficiency, technology, and risk management. In a trade war, these qualities matter more than ever.
Key Strengths
1. Superior Risk Management
Private banks use advanced credit models, early warning systems, and tighter underwriting standards. This helps them:
Exit risky sectors early
Reduce NPA formation
Maintain healthier balance sheets
2. Faster Strategic Shifts
Private banks can quickly:
Reprice loans
Adjust sector exposure
Shift focus from corporate to retail lending
This agility is critical during trade-driven uncertainty.
3. Strong Retail and Fee Income
Retail loans (home, auto, personal) and fee-based income (cards, wealth, payments) are less directly impacted by global trade disruptions.
4. Higher Profitability Metrics
Even during economic slowdowns, private banks usually maintain:
Better Net Interest Margins (NIMs)
Higher ROA and ROE
Lower cost-to-income ratios
Weaknesses of Private Banks
Despite their strengths, private banks face unique challenges in a trade war:
No guaranteed government capital support
Higher sensitivity to market sentiment
More exposed to capital market volatility
Tendency to sharply reduce lending during stress
In severe trade wars, this risk aversion can slow growth and limit upside.
Lending Behavior During Trade Wars: The Key Difference
One of the most important distinctions is how each bank type behaves under stress.
Public Banks:
Continue lending → Support the economy → Absorb stress
Private Banks:
Protect balance sheets → Reduce risk → Preserve profitability
This difference means:
Public banks help stabilize the economy
Private banks protect shareholder value
Stock Market Perspective: Who Performs Better?
From an equity market standpoint, history shows a clear pattern:
Short to Medium Term:
👉 Private banks outperform due to better earnings visibility, lower NPAs, and investor confidence.
Crisis or Extreme Stress Phase:
👉 Public banks stabilize faster because of government intervention and recapitalization.
However, stability does not always mean stock returns. Recapitalization often comes with dilution, which limits upside for PSB stocks.
Currency Volatility and Treasury Income
Trade wars often lead to:
Bond yield fluctuations
Forex volatility
Private banks generally manage treasury risks more actively, while public banks may benefit when bond yields fall due to policy easing.
This creates mixed outcomes, but private banks usually adjust faster.
The Long-Term Winner: A Balanced Verdict
If the trade war is:
Short-lived or moderate → Private banks win
Better asset quality
Faster recovery
Superior shareholder returns
If the trade war is:
Severe and prolonged → Public banks survive better, but private banks still outperform in profitability
In other words:
Public banks win on survival and systemic importance
Private banks win on efficiency, returns, and market confidence
Final Conclusion
In a trade war, no bank is immune, but the nature of victory differs.
Public sector banks act as economic shock absorbers, backed by the state and focused on stability.
Private sector banks act as capital protectors, prioritizing asset quality, margins, and shareholder value.
From a trader or investor perspective, private banks are more likely to “win” in terms of stock performance, while public banks play a critical defensive role in keeping the financial system stable.
The smartest strategy in a trade-war environment isn’t choosing one side blindly—but understanding when stability matters and when efficiency dominates.

PSU Banks Rising: Understanding the Structural Turnaround1. Resolution of the NPA Crisis
The most important reason behind the rise of PSU banks is the significant improvement in asset quality. Between 2015 and 2019, PSU banks were hit hard by a surge in Non-Performing Assets (NPAs), mainly from stressed corporate loans in sectors such as infrastructure, power, steel, and telecom. This period forced banks to recognize bad loans transparently under stricter RBI norms.
With the introduction of the Insolvency and Bankruptcy Code (IBC), banks finally received a structured mechanism to resolve stressed assets. Large recoveries from major defaulters, write-offs of legacy bad loans, and aggressive provisioning cleaned up balance sheets. As a result, Gross NPA and Net NPA ratios of PSU banks have fallen sharply, restoring investor confidence.
2. Strong Credit Growth Cycle
India is currently witnessing a strong credit growth cycle, supported by economic expansion, rising consumption, infrastructure spending, and corporate capex revival. PSU banks, with their extensive branch networks and dominance in corporate and MSME lending, are well-positioned to benefit from this trend.
Loan growth for PSU banks has accelerated across segments such as retail loans, agriculture credit, MSMEs, and large corporates. Unlike earlier cycles, this growth is more diversified and less concentrated in risky sectors, reducing the probability of future asset quality stress.
3. Improved Profitability and ROE Expansion
Another major driver behind the rally in PSU bank stocks is improving profitability. Several factors are contributing to this:
Lower credit costs due to reduced NPAs
Higher Net Interest Margins (NIMs) from better loan pricing
Rising fee income from retail banking and government-linked transactions
Operating leverage as credit growth outpaces cost growth
As a result, PSU banks are now reporting strong quarterly profits and a steady improvement in Return on Equity (ROE) and Return on Assets (ROA). Investors who once dismissed PSU banks as low-return institutions are now re-rating them as sustainable profit generators.
4. Government Reforms and Capital Support
The government has played a crucial role in reviving PSU banks. Large-scale recapitalization over the last decade strengthened balance sheets and ensured regulatory capital adequacy. In addition, the consolidation of PSU banks through mergers has improved scale, efficiency, and competitiveness.
Policy initiatives such as digitalization, governance reforms, and performance-linked incentives have improved operational discipline. The government’s continued focus on banking sector stability reassures investors that systemic risks are well managed.
5. Beneficiaries of Rising Interest Rates
In a rising interest rate environment, banks typically benefit from higher lending yields. PSU banks, with a large proportion of floating-rate loans linked to external benchmarks, have been able to reprice loans faster than deposits. This has supported margins and profitability.
At the same time, PSU banks enjoy a strong base of low-cost CASA (Current Account Savings Account) deposits due to their trust factor and government backing. This allows them to manage funding costs better than many smaller lenders.
6. Valuation Re-rating Opportunity
For years, PSU banks traded at deep discounts to private sector banks due to concerns over governance, asset quality, and efficiency. As these concerns fade, markets are gradually re-rating PSU banks.
Even after the rally, many PSU banks still trade at reasonable price-to-book valuations compared to private peers. This valuation gap attracts long-term investors who see further upside as profitability stabilizes and growth remains strong.
7. Increased Institutional and Retail Participation
Foreign Institutional Investors (FIIs) and Domestic Institutional Investors (DIIs) have significantly increased their exposure to PSU banks. The sector’s improving fundamentals, combined with attractive valuations, make it a preferred choice during bullish market phases.
Retail investors have also shown renewed interest, driven by strong price momentum, improved quarterly results, and positive news flow. PSU bank stocks have become key components of momentum and value-based portfolios.
8. Digital Transformation and Operational Efficiency
Contrary to the old perception of PSU banks being technologically backward, many have made significant progress in digital banking. Investments in core banking systems, mobile apps, UPI platforms, and fintech partnerships have improved customer experience and reduced operating costs.
Digitization has also enhanced credit underwriting, risk management, and fraud detection, making PSU banks more competitive in the modern banking landscape.
9. Macro-Economic Tailwinds
India’s macroeconomic environment strongly favors banks. Stable inflation, manageable fiscal deficits, rising formalization of the economy, and increasing financial inclusion all support banking sector growth. PSU banks, being closely aligned with government initiatives such as infrastructure development, rural credit expansion, and MSME support, directly benefit from these tailwinds.
10. Shift in Market Narrative
Perhaps the most powerful driver behind PSU banks rising is the change in market narrative. From being considered “value traps,” PSU banks are now seen as “turnaround stories.” Markets reward not perfection, but improvement—and PSU banks have delivered consistent improvement across multiple parameters.
As long as asset quality remains under control and credit growth continues, PSU banks are likely to remain in focus for investors.
Conclusion
The rise of PSU banks is not a speculative bubble but a reflection of a deep structural transformation. Cleaner balance sheets, strong credit growth, improving profitability, supportive government policies, and attractive valuations have collectively reshaped the sector’s outlook. While risks such as economic slowdown or policy changes remain, the overall trend suggests that PSU banks have entered a new growth phase.
For investors and traders alike, PSU banks now represent a blend of value, momentum, and long-term potential—making their rise one of the most significant stories in India’s financial markets today.

RSI Indicator SecretsMastering Momentum Beyond Overbought & Oversold
The Relative Strength Index (RSI) is one of the most popular technical indicators in trading—and also one of the most misunderstood. Created by J. Welles Wilder, RSI is a momentum oscillator that measures the speed and change of price movements, oscillating between 0 and 100. While beginners treat RSI as a simple buy-low, sell-high tool, professionals use it as a market psychology meter, trend validator, and timing weapon.
Understanding RSI deeply can transform it from a basic indicator into a high-probability decision framework.
1. The True Purpose of RSI
Most traders think RSI measures overbought and oversold conditions. In reality, RSI’s primary job is to measure momentum strength.
Strong markets stay strong
Weak markets stay weak
Momentum often shifts before price does
RSI reveals whether buyers or sellers are gaining or losing control, not just whether price has gone “too far.”
That distinction alone separates amateurs from professionals.
2. The Biggest RSI Myth: Overbought ≠ Sell, Oversold ≠ Buy
One of the most dangerous mistakes traders make is:
Selling just because RSI is above 70
Buying just because RSI is below 30
In strong trends, RSI can remain overbought or oversold for extended periods.
The Secret:
Overbought in an uptrend = strength
Oversold in a downtrend = weakness
Professional traders don’t fight RSI extremes—they trade with them.
3. RSI Trend Zones (A Game-Changer)
Instead of fixed 30–70 levels, experienced traders use RSI trend zones.
Bullish Market RSI Behavior
RSI support around 40–45
RSI resistance near 80–85
Pullbacks stop above 40
Bearish Market RSI Behavior
RSI resistance around 55–60
RSI support near 20–25
Rallies fail below 60
The Secret:
If RSI refuses to drop below 40, the trend is bullish—even if price pulls back sharply.
4. RSI Divergence: The Smart Money Signal
RSI divergence occurs when price and momentum disagree.
Types of Divergence
Regular Bullish Divergence
Price makes lower lows
RSI makes higher lows
Signals selling pressure is weakening
Regular Bearish Divergence
Price makes higher highs
RSI makes lower highs
Signals buying pressure is weakening
Hidden Divergence (Trend Continuation)
Bullish hidden divergence appears in uptrends
Bearish hidden divergence appears in downtrends
The Secret:
Divergence works best near support or resistance
Divergence alone is a warning, not a trigger
5. RSI Failure Swings: Pure Momentum Signals
Failure swings are one of RSI’s most powerful—but rarely used—patterns.
Bullish Failure Swing
RSI drops below 30
RSI rises above 30
RSI pulls back but stays above 30
RSI breaks its previous high → BUY signal
Bearish Failure Swing
RSI rises above 70
RSI falls below 70
RSI rallies but stays below 70
RSI breaks its previous low → SELL signal
The Secret:
Failure swings don’t need price confirmation—they reflect internal momentum shifts before price reacts.
6. RSI Support and Resistance (Yes, It Exists)
RSI forms its own support and resistance levels, just like price.
Horizontal RSI levels often repeat
Trendlines can be drawn directly on RSI
Breakouts on RSI often precede price breakouts
The Secret:
When RSI breaks a trendline before price, it’s often an early entry signal.
7. RSI and Market Structure
RSI becomes extremely powerful when combined with higher highs, higher lows, lower highs, and lower lows.
Higher highs in price + RSI holding above 50 = bullish continuation
Lower lows in price + RSI holding below 50 = bearish continuation
The 50-Level Rule
RSI above 50 → buyers dominate
RSI below 50 → sellers dominate
The Secret:
The 50 level is more important than 70 or 30 in trending markets.
8. Timeframe Secrets: RSI Is Not Universal
RSI behaves differently across timeframes.
Higher timeframes (daily, weekly) define trend bias
Lower timeframes (5m, 15m) define entries
Professional Approach:
Identify trend using daily RSI
Enter trades using intraday RSI pullbacks
The Secret:
Never trade RSI on a lower timeframe against higher timeframe RSI direction.
9. RSI Period Adjustment (Advanced Edge)
The default RSI period is 14—but that’s not sacred.
RSI 7 → faster, more signals (scalping)
RSI 14 → balanced (swing trading)
RSI 21 or 28 → smoother (position trading)
The Secret:
Shorter periods increase sensitivity but also noise. Match RSI length to your trading style, not convenience.
10. RSI with Volume & Price Action
RSI is strongest when it confirms price action and volume.
Bullish candle + RSI holding above 50 = high-probability setup
Volume spike + RSI divergence = strong reversal clue
Breakout + RSI expansion = momentum confirmation
The Secret:
RSI should confirm, not replace, price analysis.
11. RSI in Ranges vs Trends
Range-Bound Markets
Buy near RSI 30
Sell near RSI 70
RSI works extremely well
Trending Markets
Ignore extremes
Trade pullbacks to RSI 40–50 in uptrends
Trade rallies to RSI 55–60 in downtrends
The Secret:
Before using RSI, first ask: Is the market trending or ranging?
12. Common RSI Mistakes to Avoid
Using RSI alone without context
Blindly shorting overbought markets
Ignoring higher timeframe RSI
Over-optimizing RSI settings
Treating RSI as a prediction tool instead of a probability tool
Final Thoughts: The Real RSI Edge
RSI is not about predicting tops and bottoms—it’s about reading momentum, strength, and intent. When used correctly, RSI reveals:
Who controls the market
When momentum shifts
Whether trends are healthy or exhausted
The real secret isn’t the indicator—it’s how you think about it.

Chumtrades XAUUSD Has Wave B finished?GOLD – DAILY PLAN
Has Wave B finished?
→ No confirmation yet.
Macro & Market Sentiment
US–Iran negotiations have been cancelled. Geopolitical risks remain, but not strong enough to trigger a new bullish wave.
Gold experienced a relatively calm trading session, failed to break above the key level around 5,100, and saw a moderate pullback during the US session.
The Daily candle formed a Spinning Top, indicating market indecision and consolidation, with a lack of momentum for a breakout.
👉 Macro factors are supporting prices, but not pushing the market into an immediate uptrend.
Technical Structure & Outlook
Price is still moving within a descending price channel.
On the H1 timeframe, price has broken above the 4,888 key level, showing a technical rebound.
However, the higher timeframe structure remains bearish, with no confirmed trend reversal.
→ Therefore, current rebounds are considered pullbacks within a downtrend.
Key Levels
Support: 4,810 | 4,830 | 4,700–4,750 | 4,650–4,624
Resistance: 4,950–5,000 | 5,100
Trading Scenarios
Primary strategy: Sell the rallies within the descending channel.
Look for SELL setups near resistance zones, targeting lower lows.
Momentum SELL may be considered if price clearly breaks below 4,882–4,890, with confirmation on H2 or H4, targeting around 4,810.
No BUY positions while price remains inside the descending channel.
👉 Only if price breaks and holds above 5,100, will we start reassessing a trend-following BUY scenario.
👉 Deeper pullbacks are viewed as potential zones for swing BUY opportunities, not short-term buys at this stage.
Note: The market is in a “confidence-testing” phase. Focus on zone-based trading, trend alignment, reduced position size, and avoid FOMO.

Part 1 Technical Analysis VS. Institutional Option Trading What Are Options?
Options are contracts that give you the right but not the obligation to buy or sell an asset at a fixed price before a certain date.
They are derivative instruments — their value comes from the underlying asset (index, stock, commodity, currency).
Options are mostly used for hedging, speculation, and income generation.
Two Types of Options
Call Option (CE): Right to buy at a chosen price.
Put Option (PE): Right to sell at a chosen price.

Role of FII and DII in the Indian Stock MarketIntroduction
The Indian stock market is one of the fastest-growing capital markets in the world and attracts investments from both domestic and global participants. Among the most influential players in this ecosystem are Foreign Institutional Investors (FIIs) and Domestic Institutional Investors (DIIs). Their investment decisions significantly impact market direction, liquidity, volatility, and investor sentiment. Understanding the role of FIIs and DIIs is crucial for traders, long-term investors, policymakers, and anyone seeking to analyze market movements in India.
What are FIIs?
Foreign Institutional Investors (FIIs) are investment entities registered outside India that invest in Indian financial assets. These include:
Mutual funds
Pension funds
Hedge funds
Insurance companies
Sovereign wealth funds
Foreign portfolio investors (FPIs)
FIIs invest in equities, bonds, government securities, derivatives, and ETFs after registering with the Securities and Exchange Board of India (SEBI).
Key Characteristics of FIIs
Operate with large capital
Highly sensitive to global economic conditions
Often short- to medium-term focused
Move funds quickly across countries
Strong influence on benchmark indices like NIFTY 50 and Sensex
What are DIIs?
Domestic Institutional Investors (DIIs) are India-based institutions that invest in Indian financial markets. These include:
Mutual funds
Insurance companies (LIC, GIC)
Banks
Pension funds
Provident funds (EPFO, NPS)
DIIs represent domestic savings channeled into capital markets.
Key Characteristics of DIIs
Long-term investment horizon
More stable and less speculative
Influenced by domestic economic growth
Act as counter-balance to FIIs
Increasingly powerful due to SIP culture
Role of FIIs in the Indian Stock Market
1. Liquidity Provider
FIIs bring massive liquidity into Indian markets. Their large trade volumes:
Increase market depth
Reduce bid-ask spreads
Improve price discovery
High FII participation makes Indian markets more efficient and globally competitive.
2. Market Direction and Trend Formation
FII flows often decide market trends:
Net buying by FIIs → bullish markets
Net selling by FIIs → bearish or corrective markets
Sharp rallies and crashes are frequently linked to sudden FII inflows or outflows.
3. Impact on Blue-Chip Stocks
FIIs prefer:
Large-cap stocks
Index heavyweights
High-liquidity stocks
As a result, stocks like Reliance, HDFC Bank, Infosys, TCS, ICICI Bank are heavily influenced by FII activity.
4. Sensitivity to Global Factors
FIIs react strongly to:
US Federal Reserve interest rate decisions
Dollar strength or weakness
Global inflation data
Geopolitical tensions
Recession fears
This makes Indian markets sensitive to global news even if domestic fundamentals are strong.
5. Currency Impact
When FIIs invest:
They bring foreign currency → Rupee strengthens
When they exit:
Capital outflows → Rupee weakens
Thus, FII behavior directly impacts INR–USD exchange rates.
Role of DIIs in the Indian Stock Market
1. Market Stabilizers
DIIs act as a shock absorber during market downturns. When FIIs sell aggressively, DIIs often step in to buy, preventing deep crashes.
Example:
During global sell-offs, strong DII buying has helped Indian markets outperform peers.
2. Long-Term Wealth Creation
DIIs invest with a long-term vision aligned with:
India’s GDP growth
Corporate earnings
Demographic advantage
Their investments support sustainable wealth creation rather than short-term speculation.
3. Support from Retail Investors
The rise of:
SIPs (Systematic Investment Plans)
Mutual fund awareness
Digital investing platforms
has strengthened DIIs tremendously. Monthly SIP inflows provide consistent buying power even during volatile markets.
4. Reduced Dependence on Foreign Capital
As DII participation grows:
India becomes less vulnerable to sudden FII exits
Market volatility reduces
Financial independence increases
This shift is critical for long-term market stability.
5. Sectoral Impact
DIIs invest heavily in:
Banking and financial services
Infrastructure
FMCG
Manufacturing
PSU stocks
Their investments often align with national development priorities.
FII vs DII: Key Differences
Aspect FII DII
Origin Foreign Indian
Investment Horizon Short to medium Long term
Risk Appetite High Moderate
Sensitivity Global factors Domestic factors
Market Role Trend creator Trend stabilizer
Volatility Impact Increases volatility Reduces volatility
Interaction Between FIIs and DIIs
The Indian stock market often behaves like a tug-of-war between FIIs and DIIs.
When both buy → Strong bull market
When FIIs sell and DIIs buy → Sideways or controlled correction
When both sell → Sharp market crash
Understanding daily FII–DII data helps traders anticipate short-term market moves.
Impact on Retail Investors
Retail investors are indirectly influenced by FII and DII actions:
Rising FII inflows attract retail participation
DII buying builds confidence during corrections
Sharp FII selling can cause panic if not absorbed by DIIs
Smart investors track institutional flow data before making major decisions.
Regulatory Framework
SEBI closely monitors FII and DII activity to:
Prevent market manipulation
Ensure transparency
Maintain financial stability
Limits are placed on foreign ownership in certain sectors to protect national interests.
Importance for Traders and Investors
For Traders:
FII flow data helps in index trading
Short-term momentum often follows FII behavior
For Long-Term Investors:
DII accumulation signals confidence in fundamentals
Corrections caused by FII selling can offer buying opportunities
Conclusion
FIIs and DIIs are the backbone of the Indian stock market. FIIs bring global capital, liquidity, and momentum, while DIIs provide stability, long-term vision, and domestic strength. The growing influence of DIIs has made Indian markets more resilient and less dependent on foreign money.
For anyone serious about the Indian stock market, understanding the roles, behavior, and interaction of FIIs and DIIs is essential. Their combined actions shape market trends, influence valuations, and determine how India positions itself in the global financial landscape.

Part 3 Institutional Vs. Technical AnalysisMax Pain Theory
Price gravitates toward the strike where option writers lose the least.
Works well near expiry.
Building an Option Trading System
Identify trend with market structure.
Use volume profile for levels.
Use OI for confirmation.
Use Greeks for probability.
Execute with discipline.

Axis Bank | Gann Square of 9 Intraday Observation | 15 March 202Disclaimer:
This analysis is for educational purposes only. I am not a SEBI-registered advisor. This is not financial advice.
Symbol: AXISBANK (NSE)
Date Observed: 15 March 2024
Time Frame: 15-Minute Chart
Method: Gann Square of 9 (Price Capacity & Time Study)
This post documents a historical intraday market observation using the Gann Square of 9, focusing on how price capacity, trend context, and time alignment can highlight potential intraday reaction zones.
📉 Market Context & Reference Point Selection
Axis Bank showed downside pressure from the opening 15-minute candle.
In such conditions, the high of the first 15-minute candle (~1050) was treated as the 0-degree reference level, following Gann methodology.
This level acts as the starting point for measuring the intraday downward price cycle.
Correct trend identification and reference selection are essential before applying Square of 9 calculations.
🔢 Square of 9 Price Mapping
Based on the selected reference:
0 Degree: ~1050
45 Degree (Observed Normal Capacity): ~1034
The 45-degree level often represents the normal intraday price expansion range under regular market conditions.
⏱️ Price–Time Interaction (Observed Behavior)
Price interacted with the 45-degree level early in the session (around the third 15-minute candle).
Completion of normal price capacity well before the later part of the trading day has historically shown signs of temporary downside exhaustion.
After reaching this zone, the market displayed short-term stabilization followed by upward expansion.
This aligns with a commonly observed Gann concept:
When expected price capacity is completed early in time, the probability of a directional reaction may increase.
📘 Educational Takeaways
Gann Square of 9 helps define intraday price limits in advance
Trend context determines how reference points are selected
Time alignment adds confirmation to price-degree levels
Normal (45-degree) reactions are more frequent than rare cases
The approach encourages rule-based observation over emotional reaction
📌 Shared strictly for educational and historical chart-study purposes.
#AxisBank #GannSquareOf9 #WDGann #IntradayAnalysis #MarketEducation #PriceTime #TechnicalAnalysis

News-Based Trading (Budget & RBI Policy)News-based trading is a market strategy where traders make decisions based on economic, political, and financial news events that can cause sudden changes in price, volume, and volatility. Unlike pure technical or long-term fundamental trading, news-based trading focuses on short-term price reactions driven by new information entering the market.
In India, two of the most powerful news events for traders are:
Union Budget
RBI Monetary Policy
Both events can move indices like NIFTY, BANK NIFTY, FINNIFTY, and individual stocks sharply within minutes.
1. Why News Moves Markets
Markets move because prices reflect expectations. When actual news differs from expectations, prices adjust rapidly.
Better than expected news → bullish reaction
Worse than expected news → bearish reaction
In-line with expectations → muted or volatile sideways move
News impacts markets through:
Liquidity changes
Interest rate expectations
Corporate earnings outlook
Investor confidence
For traders, news creates opportunity + risk.
2. Budget-Based Trading
What is the Union Budget?
The Union Budget is the annual financial statement of the Indian government, usually presented in February. It outlines:
Government spending
Taxation changes
Fiscal deficit targets
Sector-specific incentives
Why Budget Day is Important for Traders
High volatility across equity, currency, bond, and commodity markets
Sudden directional moves in indices
Sector-specific rallies or sell-offs
Key Budget Elements Traders Track
Fiscal Deficit – Higher deficit can pressure markets
Capital Expenditure (Capex) – Boosts infra, PSU, cement, steel
Tax Changes – Impacts FMCG, auto, real estate
Sector Allocations – Defence, railways, renewable energy, banking
Disinvestment Plans – Affects PSU stocks
Budget Trading Phases
1. Pre-Budget Phase
Markets often move on expectations and rumors
Certain sectors start outperforming early
Volatility gradually increases
Common trader approach:
Light positional trades
Avoid heavy leverage
Focus on sector rotation
2. Budget Day Trading
This is the most volatile phase.
Characteristics:
Sharp spikes in the first 30–60 minutes
Fake breakouts common
Option premiums expand rapidly
Index Behavior:
NIFTY & BANK NIFTY can move 2–4% intraday
Sudden trend reversals possible
Popular Budget Trading Strategies:
Option Straddle / Strangle (for volatility)
Post-speech breakout trading
Wait-and-trade strategy (after first hour)
⚠️ Many professional traders avoid trading during the speech and trade only after clarity emerges.
3. Post-Budget Phase
Real trend often emerges 1–3 days later
Markets digest data and reprice expectations
Best phase for positional trades
3. RBI Monetary Policy-Based Trading
What is RBI Monetary Policy?
RBI announces monetary policy every two months, focusing on:
Repo rate
Reverse repo
Liquidity measures
Inflation outlook
GDP growth projections
Why RBI Policy Impacts Markets
Interest rates influence:
Bank profitability
Loan demand
Corporate earnings
Currency valuation
Bond yields
Even a single word change in RBI commentary can move markets.
Key RBI Policy Components Traders Watch
Interest Rate Decision
Rate hike → bearish for equities, bullish for banks short term
Rate cut → bullish for equities
Policy Stance
Accommodative → growth-friendly
Neutral / Withdrawal → cautious sentiment
Inflation Outlook
Higher inflation → rate hike fears
Lower inflation → easing expectations
Liquidity Measures
Tight liquidity → market pressure
Easy liquidity → risk-on mood
RBI Policy Trading Phases
1. Pre-Policy
Markets move on expectations
Bond yields and banking stocks react early
Option IV rises
2. Policy Announcement (2:00 PM)
Immediate spike in volatility
Algo-driven moves dominate
Sharp whipsaws common
Common mistakes:
Market orders during announcement
Over-leveraged option buying
3. Governor’s Speech
Trend clarity often comes during speech
Commentary matters more than rate decision sometimes
4. Instruments Used in News-Based Trading
Cash Market
Suitable for experienced traders
Slippage risk high
Better post-event
Futures
High risk due to gap moves
Strict stop-loss required
Options (Most Popular)
Limited risk strategies
Best suited for volatility events
Common Option Strategies:
Long Straddle / Strangle (high volatility)
Iron Condor (if volatility expected to drop)
Directional option buying after confirmation
5. Risk Management in News Trading
News-based trading is high-risk, high-reward. Risk control is non-negotiable.
Key Rules:
Reduce position size
Avoid trading without a plan
Do not chase first move
Use defined-risk option strategies
Accept slippage as part of the game
Many traders lose money not because of wrong direction, but because of overconfidence and overtrading.
6. Psychology of News Trading
News trading tests emotional discipline.
Common psychological traps:
FOMO during fast moves
Panic exits
Revenge trading after loss
Successful news traders:
Stay calm during volatility
Trade reactions, not headlines
Accept that missing a trade is better than forcing one
7. Advantages of News-Based Trading
Large moves in short time
High liquidity
Clear catalysts
Opportunity across asset classes
8. Disadvantages
Extreme volatility
Algo dominance
Slippage and spread issues
Emotional pressure
Conclusion
News-based trading around the Union Budget and RBI Monetary Policy is one of the most exciting yet challenging styles of trading in the Indian market. These events can create massive opportunities, but only for traders who understand expectations, volatility, and risk management.
For beginners, it is better to observe first, trade later. For experienced traders, combining news understanding with technical levels and options strategies can be highly rewarding. Ultimately, success in news-based trading comes not from predicting the news, but from managing risk and trading market reactions intelligently.
