Introduction to Derivatives and Options1. Derivatives Trading Strategies
Derivatives can be traded using a variety of strategies depending on market expectations, risk tolerance, and investment objectives.
A. Hedging Strategies
Hedging is a risk management technique used to protect against adverse price movements in the underlying asset.
Futures Hedging:
A trader holding a physical asset (like wheat, crude oil, or shares) can hedge by taking a futures position in the opposite direction. For example, a farmer expecting to sell wheat in three months can sell wheat futures now to lock in the price, reducing the risk of price decline.
Portfolio Hedging with Index Futures:
Institutional investors can hedge against market-wide risk using index futures. For instance, holding a portfolio of Nifty 50 stocks, an investor may sell Nifty futures to protect against a market downturn.
Interest Rate Hedging with Swaps:
Companies with floating-rate loans may use interest rate swaps to exchange variable payments for fixed payments, thus reducing exposure to interest rate fluctuations.
B. Speculative Strategies
Speculators use derivatives to profit from price movements in underlying assets without necessarily owning them.
Long and Short Futures:
Traders can go long (buy) if they expect prices to rise or short (sell) if they expect prices to fall. For example, a trader anticipating a rise in crude oil prices buys crude futures to benefit from price appreciation.
Spread Trading:
Spread strategies involve taking offsetting positions in related derivatives to profit from relative price movements. Common spreads include:
Calendar spreads: Buying a long-dated contract while selling a short-dated contract.
Inter-commodity spreads: Trading price differences between related commodities, like gold vs. silver.
Leverage and Margin Trading:
Derivatives often allow high leverage, enabling traders to control large positions with smaller capital. While leverage increases profit potential, it also amplifies risk.
C. Arbitrage Strategies
Arbitrage exploits price inefficiencies between markets or instruments to earn risk-free or low-risk profits.
Cash-and-Carry Arbitrage:
Traders buy the underlying asset and sell futures simultaneously if futures are overpriced relative to spot prices.
Index Arbitrage:
Exploits differences between index futures and the actual underlying stocks in the index.
Inter-market Arbitrage:
Identifying price discrepancies across different exchanges for the same asset.
2. Option Trading Strategies
Options trading strategies can be divided into basic strategies for beginners and advanced strategies for professional traders.
A. Basic Option Strategies
Long Call:
Buy a call option expecting the underlying asset to rise.
Risk: Limited to premium paid.
Reward: Unlimited potential profit.
Long Put:
Buy a put option expecting the underlying asset to fall.
Risk: Limited to premium paid.
Reward: Gains increase as the asset price declines.
Covered Call:
Holding the underlying stock and selling a call option on it.
Objective: Earn premium income while holding the stock.
Risk: Stock may rise above strike price; profit is capped.
Protective Put:
Buy a put option while holding the underlying asset.
Objective: Insure against a price drop.
Cost: Premium paid for the put.
B. Advanced Option Strategies
Spreads
Spreads involve buying and selling options of the same type (calls or puts) with different strike prices or expirations to limit risk and optimize returns.
Bull Call Spread:
Buy a call at a lower strike and sell a call at a higher strike.
Profitable if the underlying price rises moderately.
Lower cost than a simple long call.
Bear Put Spread:
Buy a put at a higher strike and sell a put at a lower strike.
Profitable if the underlying price falls moderately.
Calendar Spread:
Buy a long-term option and sell a short-term option at the same strike.
Profits from time decay differences.
Straddles and Strangles
These are volatility strategies designed to profit from significant price movements, regardless of direction.
Straddle:
Buy both a call and put at the same strike price.
Profitable if the asset moves sharply up or down.
Strangle:
Buy a call and put with different strike prices.
Cheaper than straddle but requires larger price movement for profit.
Butterfly and Condor Spreads
Butterfly Spread: Combines buying and selling multiple options to profit from minimal price movement.
Iron Condor: Uses both call and put spreads to generate income in low-volatility markets.
Synthetic Positions
Synthetic Long Stock: Buy a call and sell a put at the same strike.
Synthetic Short Stock: Sell a call and buy a put.
Purpose: Mimics stock positions using options, often at lower capital outlay.
3. Risk Management in Derivatives and Options Trading
Risk management is crucial in derivatives trading due to leverage and market volatility.
Stop Loss Orders: Automate exits to limit losses.
Position Sizing: Control exposure relative to capital.
Hedging: Use options or futures to reduce risk on existing positions.
Volatility Assessment: Traders must evaluate implied volatility for option pricing and strategy selection.
4. Practical Applications
Institutional Investors: Use derivatives for hedging portfolios, managing interest rate risk, and currency exposure.
Retail Traders: Utilize options strategies for speculative bets, income generation, and hedging personal investments.
Corporate Usage: Companies hedge commodity prices, interest rates, and foreign currency exposure to stabilize cash flows.
Conclusion
Derivatives and options trading strategies offer a wide array of tools for hedging, speculation, arbitrage, and income generation. While derivatives provide leverage and flexibility, options add non-linear payoff structures that can be tailored for risk and return preferences.
Understanding each strategy, market conditions, and risk-reward dynamics is critical for successful trading. Beginners should start with basic strategies and limited exposure, while advanced traders can explore complex spreads and volatility trades to maximize returns and manage risk effectively.
Trendlineanalysis

Investing in Shares: A Comprehensive Overview1. Understanding Shares
Shares, also called stocks or equities, are financial instruments that represent ownership in a corporation. Each share entitles the holder to a fraction of the company's profits, typically distributed as dividends, and gives them voting rights in certain corporate decisions, depending on the type of share held. Shares are issued by companies to raise capital for business expansion, research, or debt repayment. In return, investors hope to earn returns through price appreciation and dividends.
There are two primary types of shares:
Common Shares: These represent ordinary ownership. Shareholders have voting rights and may receive dividends, but they are last in line to claim company assets in case of liquidation.
Preferred Shares: These provide a fixed dividend and have a higher claim on assets than common shares. However, preferred shareholders usually lack voting rights.
2. Why Invest in Shares
Investing in shares can offer several benefits:
Potential for Capital Growth: Shares have the potential to appreciate in value over time, allowing investors to sell them at a higher price than the purchase price.
Dividend Income: Companies often distribute a portion of profits as dividends, providing a steady income stream.
Ownership in a Company: Shareholders have a stake in the company, including the right to vote on major corporate matters.
Hedge Against Inflation: Historically, equities have outperformed inflation, helping preserve the purchasing power of money.
Liquidity: Shares traded on stock exchanges can be bought and sold easily, offering high liquidity compared to other investments like real estate.
3. How Share Prices Are Determined
The price of a share is influenced by a combination of factors:
Company Performance: Profits, revenue growth, and business strategies directly impact investor perception and share price.
Market Sentiment: Investors’ collective emotions, confidence, and speculation can drive prices up or down.
Economic Indicators: Interest rates, inflation, and GDP growth affect share valuations.
Industry Trends: Changes in technology, consumer preferences, and competition influence sector performance.
Global Events: Political instability, trade wars, and global economic conditions can significantly impact share prices.
4. Methods of Investing in Shares
There are different ways to invest in shares, depending on risk tolerance, knowledge, and financial goals:
Direct Investment: Purchasing shares of individual companies through stock exchanges using a brokerage account. Investors need to research companies, analyze financials, and monitor market trends.
Mutual Funds: Equity mutual funds pool money from multiple investors to invest in a diversified portfolio of shares. This reduces risk compared to investing in a single stock.
Exchange-Traded Funds (ETFs): ETFs track the performance of an index or sector and can be traded like individual shares. They offer diversification and low cost.
Dividend Reinvestment Plans (DRIPs): Investors reinvest dividends to purchase more shares, enabling compounding growth over time.
Systematic Investment Plans (SIPs): Investing fixed amounts periodically in equity mutual funds to benefit from rupee cost averaging.
5. Analyzing Shares
Before investing, it is crucial to analyze shares using two main approaches:
Fundamental Analysis: This involves evaluating a company’s financial statements, revenue growth, profit margins, debt levels, management quality, and industry position. Key metrics include Price-to-Earnings (P/E) ratio, Earnings Per Share (EPS), Return on Equity (ROE), and dividend yield. Fundamental analysis helps investors determine a company’s intrinsic value and decide whether the stock is overvalued or undervalued.
Technical Analysis: This focuses on historical price movements, trading volumes, and chart patterns to predict future price trends. Tools like moving averages, support and resistance levels, and momentum indicators are commonly used by traders. Technical analysis is particularly popular for short-term trading strategies.
6. Risk and Reward in Share Investing
Investing in shares involves a trade-off between risk and reward:
Market Risk: Stock prices can fluctuate due to overall market movements or economic conditions.
Company-Specific Risk: Poor management, product failures, or regulatory issues can negatively impact a company’s stock.
Liquidity Risk: Some stocks may be difficult to sell quickly without affecting the price.
Volatility: Share prices can experience rapid ups and downs, especially in emerging markets or high-growth sectors.
Mitigating Risk: Diversification, long-term investment horizons, and informed decision-making reduce risk exposure.
The potential for high returns is higher than traditional investments like fixed deposits or bonds, but so is the risk. Historical data suggests that equities outperform most asset classes over long periods, making them suitable for wealth creation.
7. Strategies for Share Investing
Successful investors adopt strategies based on goals and risk appetite:
Buy and Hold: Investors purchase quality stocks and hold them long-term to benefit from compounding and price appreciation.
Value Investing: Investing in undervalued stocks based on fundamental analysis, a strategy popularized by Warren Buffett.
Growth Investing: Focusing on companies with high growth potential, even if they appear expensive, expecting significant capital appreciation.
Dividend Investing: Prioritizing shares with consistent and high dividend payouts for stable income.
Swing Trading: Short- to medium-term trading based on technical patterns to profit from price fluctuations.
Index Investing: Investing in market indices via ETFs or index funds to replicate overall market performance with minimal effort.
8. The Role of Psychology in Share Investing
Behavioral finance highlights that emotions influence investment decisions. Common psychological pitfalls include:
Herd Mentality: Following the crowd without independent analysis.
Overconfidence: Overestimating one's knowledge or market predictions.
Fear and Greed: Emotional reactions during market volatility can lead to panic selling or excessive risk-taking.
Loss Aversion: Reluctance to sell underperforming stocks, which can magnify losses.
Successful investors maintain discipline, set clear investment goals, and stick to their strategy regardless of short-term market noise.
9. Taxation and Regulatory Considerations
Investing in shares is subject to taxation and regulatory compliance:
Capital Gains Tax: Profits from selling shares may attract short-term or long-term capital gains tax depending on the holding period.
Dividend Distribution Tax: Dividends received are taxed in some jurisdictions.
Regulations: Stock markets are regulated by government authorities (like SEBI in India) to ensure transparency, prevent fraud, and protect investors.
Awareness of these factors helps investors plan their investments efficiently.
10. Conclusion
Investing in shares is both an art and a science, blending financial analysis, market understanding, and behavioral discipline. It offers the potential to grow wealth, generate income, and participate in the growth story of companies. However, it requires knowledge, patience, and risk management. Investors should conduct thorough research, diversify portfolios, and remain focused on long-term objectives to navigate market volatility successfully.
By understanding the fundamentals, adopting effective strategies, and maintaining emotional discipline, investing in shares can become a powerful tool for achieving financial freedom and building lasting wealth. In a world where economic growth is increasingly linked to corporate success, shares remain one of the most accessible and rewarding avenues for individual investors to participate in that growth journey.

Introduction: Understanding Crypto Assets1. Blockchain Fundamentals: The Hidden Architecture
At the heart of crypto assets is blockchain technology—a distributed ledger system. The “secret” here is its simplicity combined with complexity:
Decentralization: Unlike traditional finance, no single entity controls the ledger. Control is distributed across a network of nodes, enhancing security.
Immutability: Once a transaction is recorded, it cannot be altered. This provides transparency and reduces fraud.
Consensus Mechanisms: Proof of Work (PoW) or Proof of Stake (PoS) ensures that network participants agree on the state of the ledger. Understanding these mechanisms can help investors gauge energy efficiency, security, and scalability of a blockchain.
Savvy investors know that not all blockchains are equal; scalability, transaction costs, and governance mechanisms directly influence a crypto asset’s utility and long-term potential.
2. Market Dynamics: Beyond Price Movements
Crypto markets behave differently from traditional equity or forex markets. Some lesser-known secrets include:
Liquidity Pools & Whales: Large holders, or “whales,” can significantly influence prices. Decentralized exchanges (DEXs) use liquidity pools, where the distribution of assets can create volatility or hidden opportunities for profit.
Market Sentiment & Social Media: Crypto markets are highly sentiment-driven. Twitter, Reddit, Telegram, and Discord often act as catalysts for rapid price changes. Early detection of trends on these platforms can be profitable.
Cyclicality: Crypto often follows market cycles—accumulation, hype, euphoria, and crash. Understanding these cycles allows traders to anticipate potential risk and reward.
A key secret is that volatility is not inherently bad; it is a tool for strategic positioning if one understands liquidity and sentiment flows.
3. Tokenomics: The Secret Economics
The design of a crypto asset's economy—its tokenomics—determines its value proposition:
Supply Mechanisms: Some coins have fixed supply (e.g., Bitcoin), creating scarcity, while others are inflationary or deflationary.
Utility: Tokens may represent voting rights, staking rewards, transaction fees, or access to services. Understanding a token’s utility is crucial to predicting demand.
Incentive Structures: Many networks reward participation, staking, or liquidity provision. These incentives influence holder behavior and network security.
The secret here is that strong tokenomics often lead to network effects, driving adoption and sustainable price growth.
4. Security & Custody Secrets
Crypto security is an often-overlooked aspect:
Private Keys & Wallets: Owning crypto means controlling private keys. Losing a key means losing access permanently, making personal security paramount.
Hot vs. Cold Storage: Hot wallets are online and convenient but vulnerable to hacking. Cold wallets are offline and secure but less liquid.
Smart Contract Risk: DeFi protocols rely on smart contracts. Bugs or exploits can drain funds instantly. Audited contracts mitigate risk but are not foolproof.
A secret many beginners miss: security lapses, not market moves, are the leading cause of losses in crypto.
5. Psychological Secrets of Crypto Trading
Emotional intelligence is crucial in crypto trading:
Fear of Missing Out (FOMO): Rapid price increases trigger impulsive buying. Savvy traders anticipate FOMO cycles and position themselves in advance.
Fear, Uncertainty, and Doubt (FUD): Negative news can induce panic selling. Long-term investors often exploit FUD-driven dips.
Cognitive Biases: Overconfidence, herd mentality, and anchoring affect decision-making. Recognizing these biases is essential to maintaining rational trading behavior.
The secret is that crypto is as much a psychological battlefield as it is a financial market.
6. DeFi, NFTs, and Emerging Assets
The crypto world is evolving beyond simple currencies:
Decentralized Finance (DeFi): Offers lending, borrowing, and yield farming without intermediaries. Secrets include yield optimization strategies, impermanent loss management, and governance participation.
Non-Fungible Tokens (NFTs): Represent ownership of digital assets. Market success depends on community adoption, rarity, and cultural relevance.
Layer 2 Solutions & Interoperability: Assets that solve scaling and cross-chain challenges have hidden growth potential. Technologies like rollups, sidechains, and bridges create opportunities for early adoption.
Understanding these emerging segments can give investors a competitive edge before mass adoption occurs.
7. Regulatory & Institutional Influence
Crypto assets exist in a fluid regulatory environment. Secrets include:
Regulatory Arbitrage: Some projects thrive in crypto-friendly jurisdictions, while others face restrictions. Awareness of regulations can prevent legal and financial pitfalls.
Institutional Participation: Large financial institutions entering crypto markets influence liquidity, volatility, and market confidence.
Taxation & Compliance: Different jurisdictions treat crypto differently. Strategic planning can maximize gains and minimize tax liabilities.
Ignoring regulatory trends is a common mistake that can destroy profits or even lead to legal trouble.
8. Mining, Staking, and Network Participation
Mining Secrets: Proof of Work coins like Bitcoin require computational power. Mining profitability depends on electricity costs, hardware efficiency, and network difficulty.
Staking Secrets: Proof of Stake coins reward users for locking their tokens. Staking can yield passive income but comes with risks like slashing.
Governance Participation: Active involvement in protocol decisions can shape the future of the network and provide strategic insight into token value.
These mechanisms are often overlooked by casual investors but are crucial for long-term engagement.
9. Common Pitfalls and Hidden Risks
Scams and Rug Pulls: High-yield promises and anonymous teams can indicate fraud. Research and community validation are essential.
Illiquidity: Some assets may be hard to sell without affecting the price. Avoid assets with low volume unless prepared for long-term holding.
Technical Complexity: Mistakes in transactions, contract interactions, or wallet management can lead to irreversible losses.
The secret is simple: due diligence and skepticism are more valuable than luck in crypto investing.
Conclusion: The Crypto Secret Sauce
The real “secrets” of crypto assets are not mystical—they are a combination of understanding technology, market psychology, tokenomics, security, regulatory frameworks, and emerging trends. Successful crypto investors and traders:
Treat blockchain technology as a tool, not a trend.
Study market sentiment and cycles to anticipate opportunities.
Analyze tokenomics to gauge long-term sustainability.
Prioritize security and risk management above speculation.
Manage psychological biases to prevent impulsive mistakes.
Explore DeFi, NFTs, and layer 2 innovations strategically.
Stay aware of regulatory developments and institutional activity.
In essence, crypto rewards knowledge, discipline, and foresight. Those who master these “secrets” navigate the market more effectively, turning volatility from a threat into an opportunity.

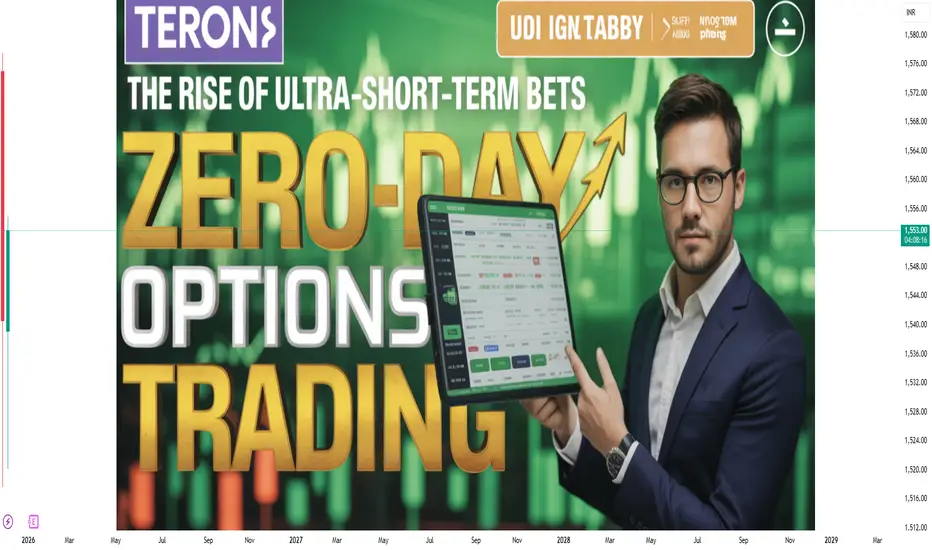
Zero-Day Option Trading: A Comprehensive Overview1. Introduction to Zero-Day Options
Zero-Day Option Trading refers to the practice of trading options contracts that expire on the very same day. In standard options trading, contracts may expire weeks or months in the future. However, zero-day options have a life span of only a few hours, typically expiring at the end of the trading day. This makes them extremely sensitive to price movements in the underlying asset, offering both tremendous profit potential and significant risk.
Zero-day options are also referred to as 0DTE (Zero Days to Expiry) options in modern trading parlance. They are primarily available in highly liquid markets, such as the Nifty 50, S&P 500 (SPX), and major stocks in India, the U.S., and other global exchanges.
2. Why Traders Use Zero-Day Options
Traders are attracted to zero-day options because they can leverage time decay (theta) in their favor and profit from intraday volatility without tying up capital for long periods. The key advantages include:
Rapid Profits: Small moves in the underlying asset can lead to large percentage gains in zero-day options due to high gamma sensitivity.
Intraday Hedging: Traders can hedge other positions without holding them overnight.
Speculative Opportunities: Short-term events, such as economic announcements, earnings, or geopolitical news, can create massive price swings that zero-day options can capitalize on.
However, these benefits come with high risks, as prices can also swing against the trader quickly, resulting in total loss of premium paid.
3. Key Characteristics of Zero-Day Options
High Gamma: Gamma measures the rate of change of delta relative to changes in the underlying asset’s price. In zero-day options, gamma is extremely high, meaning the delta (price sensitivity) can change very quickly with small market movements. This creates both fast profits and fast losses.
Accelerated Theta Decay: Theta represents time decay. As zero-day options approach expiration, theta decay is maximal, meaning the option loses value rapidly if the underlying does not move favorably.
High Vega Sensitivity: Vega measures sensitivity to volatility. While zero-day options are highly sensitive to volatility, the effect of volatility diminishes closer to expiration, making timing extremely crucial.
Cost-Efficiency: Compared to longer-dated options, zero-day options often have lower premiums, allowing traders to take positions with smaller capital.
4. Trading Strategies for Zero-Day Options
Zero-day option trading can be approached through multiple strategies, broadly divided into directional and non-directional trades:
A. Directional Strategies
These are used when traders have a strong belief about the market’s intraday movement.
Buying Calls or Puts:
Traders purchase calls if they expect an upward move or puts for a downward move.
Due to high gamma, even small favorable moves can yield significant profits.
The risk is limited to the premium paid, but total loss can happen within hours.
Scalping with Intraday Trends:
Traders use technical indicators like moving averages, RSI, or intraday patterns to enter trades for small moves.
Profits are booked quickly, often within minutes or hours.
B. Non-Directional Strategies
These are used when traders anticipate minimal price movement or high volatility without direction.
Selling Iron Condors:
Traders sell an out-of-the-money call and put while buying a further out-of-the-money call and put to limit risk.
Profit comes from rapid theta decay, which is extremely fast in zero-day options.
Requires careful monitoring as sudden market spikes can lead to losses.
Straddles and Strangles:
Buying straddles or strangles allows profiting from sharp intraday moves regardless of direction.
Expensive in terms of premiums but can pay off if volatility spikes unexpectedly.
5. Risk Management in Zero-Day Options
Zero-day option trading is inherently risky due to the combination of short time horizon, high gamma, and fast theta decay. Effective risk management is crucial:
Capital Allocation: Never invest more than a small portion of your trading capital in zero-day options. Many traders allocate only 1–5% per trade.
Stop Loss Orders: Set intraday stop losses based on price levels or delta changes to prevent catastrophic losses.
Hedging: Use other options or futures positions to hedge large positions.
Avoid Over-Leverage: High leverage can magnify gains but also total losses. Conservative position sizing is critical.
6. Tools and Technical Analysis for Zero-Day Trading
Traders rely heavily on technical analysis for zero-day trades due to the intraday nature:
Intraday Charts: 1-minute, 5-minute, or 15-minute charts are commonly used to spot trends and reversals.
Volatility Indicators: Bollinger Bands, ATR (Average True Range), and Implied Volatility measures help anticipate price swings.
Momentum Indicators: RSI, MACD, and Stochastic Oscillators help gauge overbought or oversold conditions for timing entries.
Order Flow Analysis: Monitoring real-time buy/sell pressure using Level 2 data can provide an edge in fast-moving markets.
7. Common Mistakes in Zero-Day Option Trading
Ignoring Time Decay: Many beginners buy zero-day options without accounting for the rapid loss in value if the underlying doesn’t move.
Overtrading: Frequent trading increases transaction costs and can amplify losses.
Leverage Mismanagement: High leverage in zero-day options can wipe out capital quickly.
Neglecting Volatility Events: Economic news or corporate announcements can cause sudden spikes, which can either make or break trades.
8. Market Examples and Popular Instruments
In India, Nifty 50 0DTE options are widely used by institutional and retail traders. In the U.S., SPX and SPY options are popular zero-day instruments. These markets are chosen due to:
High liquidity ensuring tight spreads
Significant daily volume
Availability of intraday hedging options
9. Psychological Aspects of Zero-Day Trading
Zero-day option trading demands discipline, emotional control, and focus. Traders face intense pressure as prices can move rapidly within minutes. Impulsive decisions often lead to total losses. Developing a calm, rule-based approach is crucial for consistent profitability.
10. Conclusion
Zero-day option trading is a high-risk, high-reward form of derivatives trading that appeals to intraday traders looking for quick profits from price movements and volatility. Success in this domain requires a combination of:
Deep understanding of options Greeks (Delta, Gamma, Theta, Vega)
Strong technical analysis skills
Disciplined risk management
Quick decision-making under pressure
While the potential for profit is attractive, the risk of rapid losses is equally real. As such, zero-day options are best suited for experienced traders who can manage capital, emotions, and strategy execution simultaneously.
In essence, trading zero-day options is not just a financial endeavor; it is a test of skill, discipline, and nerve, offering an intense yet potentially rewarding experience for those prepared to master it.
Part 10 Trade Like Institutions What Are Options?
Options are derivative instruments—their value is derived from an underlying asset such as Nifty, Bank Nifty, stock, commodity, or currency.
An option is a contract that gives the trader:
Right, but not the obligation,
To buy or sell an underlying asset,
At a fixed price (Strike Price),
On or before a specific date (Expiry Date).
Because you have a choice, these instruments are called “Options.”

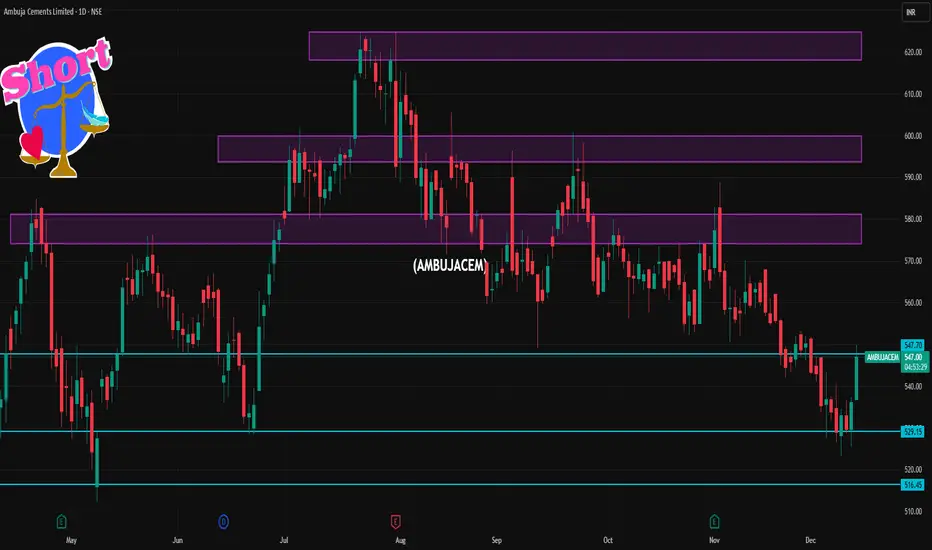
AMBUJACEM 1 Day Time Frame 📌 Current Price (approx)
• Trading around ₹536–₹547 as of today’s session.
📊 Daily Support & Resistance Levels
🔹 Pivot / Key Levels (from technical pivot calculations)
Daily Pivot Zone: ~₹534–₹549
Daily Support Levels:
S1: ~₹531–₹532
S2: ~₹525–₹528
S3: ~₹516–₹521
Daily Resistance Levels:
R1: ~₹540–₹544
R2: ~₹545–₹552
R3: ~₹552–₹559
🔹 Trading Range Today (Observed)
Day Low: ~₹525–₹526
Day High: ~₹537–₹549 range so far.
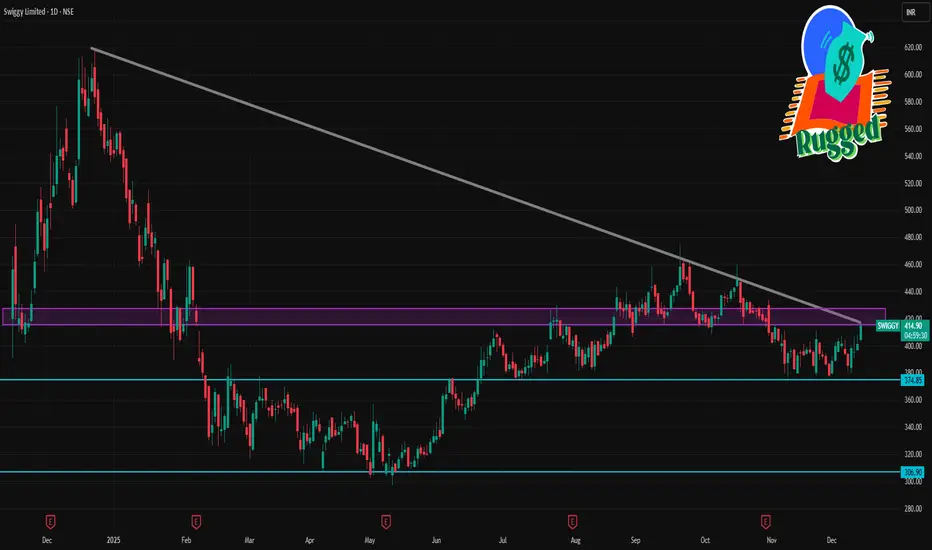
SWIGGY 1 Day Time Frame 📈 Latest Price Context (Today’s Trading)
📍 Approx Live Price: ~₹401 INR on NSE during today’s session with intraday swings between ~₹396 and ₹408.
📊 Daily Support & Resistance Levels (1-Day Chart)
🔹 Key Resistance
R1: ~₹404–₹406 — first resistance from intraday pivot/octave levels.
R2: ~₹409–₹414 — next resistance zone.
R3: ~₹420+ — extended weekly resistance.
🔸 Key Support
S1: ~₹388–₹390 — immediate support area.
S2: ~₹380–₹383 — secondary support closer to recent intraday lows.
S3: ~₹371–₹375 — deeper support if prices break down sharply.
🔁 Pivot
Daily Pivot Point: ~₹397–₹398 zone.
This pivot acts as the centerline bias — above it suggests bullish lean today, below it suggests selling pressure today.
GRANULES 1 Day Time Frame📌 Current Price (approx): ~₹570 – ₹571 (intraday price as of market hours)
🔥 Today’s Key Levels (1-Day Timeframe)
📍 Pivot Levels (Daily)
Based on pivot calculations (classic & Fibonacci based on current price action):
Level Price (Approx)
R3 ~₹577–₹578
R2 ~₹571–₹574
R1 ~₹568–₹572
Pivot (PP) ~₹568
S1 ~₹565
S2 ~₹562
S3 ~₹559
📌 Interpretation:
Above Pivot (~₹568): bullish bias
Below Pivot: risk of short-term weakness

Part 9 Trading Master Class With ExpertsRisks in Option Trading Strategies
Options offer flexibility, but risks vary.
1 Premium Decay
Option buyers lose premium rapidly as expiry approaches.
2 Volatility Crush
IV drops after major events → huge loss for long straddle/strangle buyers.
3 Assignment Risk
Short options may be assigned early in American-style options.
4 Unlimited Loss Potential
Selling naked options exposes traders to large losses.

Part 8 Trading Master Class With Experts Understanding Options: A Quick Foundation
An option is a contract giving the buyer the right, but not the obligation, to buy or sell an underlying asset at a fixed price (strike price) on or before expiration.
Call Option → Right to buy
Put Option → Right to sell
Option buyers pay a premium and have limited risk but unlimited or significant upside.
Option sellers (writers) receive the premium but hold potentially large risk.
Strategies combine long/short calls and puts to shape unique payoff structures.

Part 7 Trading Master Class With Experts Option Expiry and Settlement
Options have fixed expiry cycles:
Weekly expiry: For most index options (NIFTY, BANKNIFTY, FINNIFTY).
Monthly expiry: For stock options.
Last Thursday of each month for monthly contracts.
At expiry:
ATM options lose all time value.
ITM options settle for intrinsic value.
OTM options expire worthless.
Time decay accelerates dramatically in the last week.

Part 6 Learn Institutional Trading Buyers vs. Sellers
Option Buyers
Pay premium.
Limited risk (premium only).
Unlimited reward potential.
Low probability of profit (because time decay erodes premium).
Option Sellers (Writers)
Receive premium.
Limited profit (premium only).
Can face huge losses.
High probability of profit (because time decay works in their favor).
Professional traders often prefer selling options, but with strict risk management.

Part 4 Learn Institutional Trading In the Money (ITM), At the Money (ATM), Out of the Money (OTM)
Depending on the strike price relative to the current market price, options are classified as:
ITM Options
Have intrinsic value.
Call: Strike < Spot
Put: Strike > Spot
ATM Options
Strike = Spot (approximately)
Mostly time value.
OTM Options
No intrinsic value; only time value.
Call: Strike > Spot
Put: Strike < Spot
OTM options are cheaper and used by beginners often, but they carry high risk.

Candle Pattern Practical Tips for Using Candlestick Patterns
Combine with Trend Analysis:
Always consider the prevailing trend. A reversal pattern is more meaningful if it aligns with trend exhaustion signals.
Confirm with Volume:
Higher volume strengthens the validity of candlestick signals.
Use with Technical Indicators:
Combine patterns with moving averages, RSI, MACD, or Fibonacci levels for more reliable entries and exits.
Time Frame Matters:
Patterns are more reliable on higher time frames (daily, weekly) than lower ones (1-minute, 5-minute).
Avoid Over-reliance:
No candlestick pattern guarantees success. Always manage risk with stop-losses and position sizing.

Premium Chart Patterns Practical Application of Chart Patterns
Chart patterns are not foolproof but are valuable tools when combined with other technical indicators. Traders often use volume analysis to confirm pattern breakouts, as significant volume adds credibility to the pattern. Risk management is essential, with stop-loss orders placed strategically around pattern levels. Additionally, price targets can be estimated using pattern height or measured moves, enhancing trade planning.
Limitations of Chart Patterns
Despite their popularity, chart patterns have limitations. They rely on historical price action, which does not guarantee future performance. False breakouts and market noise can mislead traders. Patterns are subjective, and different traders may interpret the same chart differently. Therefore, combining patterns with other technical tools like moving averages, RSI, MACD, and trendlines improves accuracy.

Part 3 Learn Institutional Trading Why Do People Trade Options?
Traders use options for three main reasons:
a) Hedging
To protect their portfolios from losses.
Example: If you own shares and fear a price drop, you can buy put options to act as insurance.
b) Speculation
To profit from price movements using small capital.
Options allow traders to control large positions for a fraction of the cost.
c) Income Generation
By selling options, traders can earn premium income regularly.

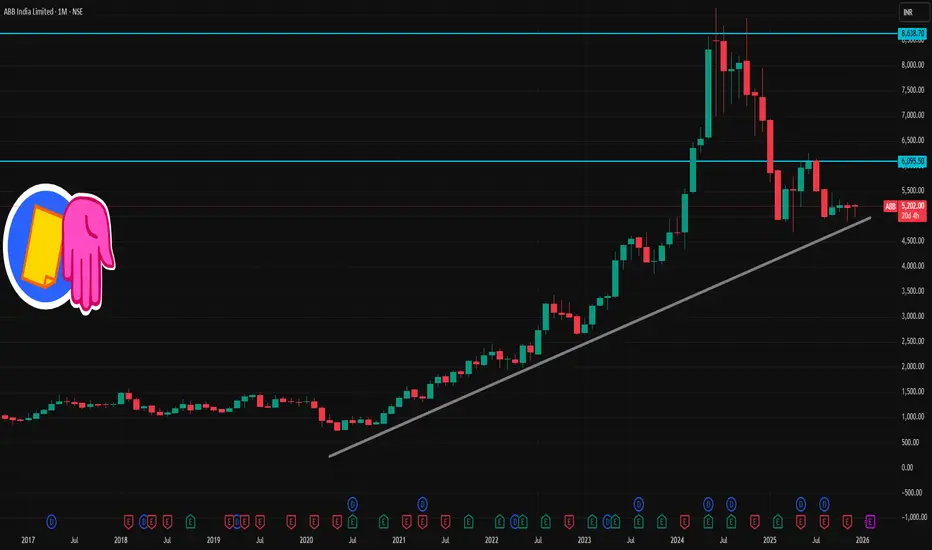
ABB 1 Month Time Frame 📌 Current Snapshot
Latest price — ~ ₹ 5,200–₹ 5,210 (most recent quoted range)
52‑week range: ~ ₹ 7,960 (high) / ₹ 4,684–4,590 (low)
✅ What Traders Might Watch Today / Very Short Term
If price holds above ₹ 5,190–5,210, bias might be slightly positive — see if it tests ₹ 5,260–5,280 (R1).
A drop below ₹ 5,120 could trigger slide toward ₹ 5,110 or even test support around ₹ 5,145 (S1).
A clean breakout above ₹ 5,280 (especially with good volume) may open move toward ₹ 5,320–5,350 (R2).
If broader market turns negative, ₹ 5,110–5,145 zone is a key alert/support area.
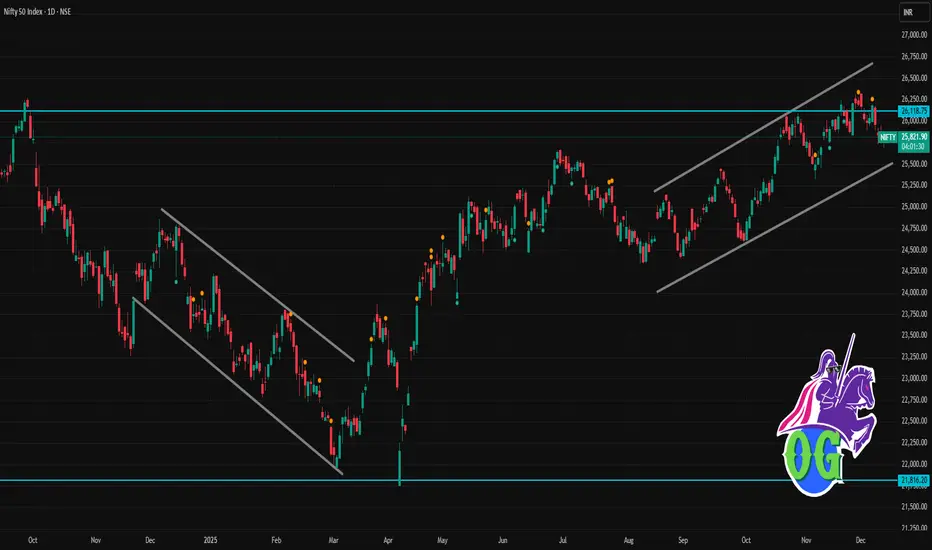
Nifty 50 1 Day Time Frame 📈 Current / Recent Level
Nifty 50 is trading around 25,825–25,830.
Earlier today, it was seen around 25,758.
🔎 Key Short-Term Technical Levels to Watch (1-Day Frame)
Support zone: ~25,600–25,500 — breach below this may signal weakening momentum.
Immediate support: ~25,700–25,750 — near current trading levels; a dip here could test buyers.
Resistance / Near-Term Upside: ~26,100–26,250 — a sustained move above this may re-ignite bullish bias for short-term traders.
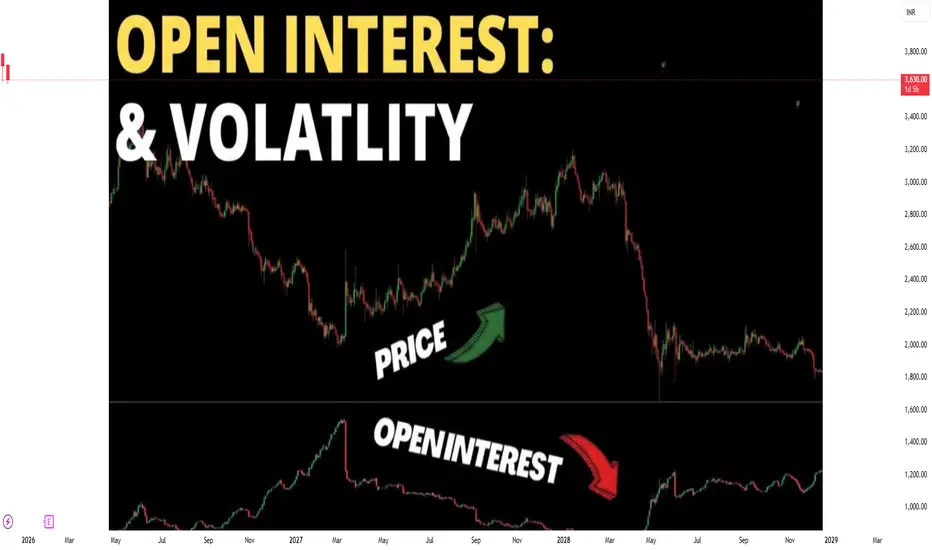
Understanding Open Interest and Volatility1. Open Interest: Definition and Significance
Open interest (OI) refers to the total number of outstanding derivative contracts, such as futures or options, that have not been settled or closed. Unlike trading volume, which measures the number of contracts traded during a specific period, open interest reflects the accumulation of positions in the market.
Key Points about Open Interest:
Indicator of Market Participation:
High open interest suggests a liquid and active market with many participants. Conversely, low open interest can indicate a less active market, where prices may be more susceptible to manipulation or sudden moves.
Trading Strategy Implications:
Trend Confirmation: Rising open interest along with rising prices typically confirms an uptrend. Similarly, rising open interest with falling prices can confirm a downtrend.
Potential Reversals: If open interest decreases while prices continue in the same direction, it may signal a weakening trend and a potential reversal.
Example:
Suppose in Nifty 50 call options, there are 50,000 outstanding contracts for a specific strike price. This is the open interest. If traders open 5,000 new contracts and close 2,000, the updated open interest becomes 53,000.
Types of Open Interest Changes:
Increase in OI with Price Increase: Indicates strong buying and bullish sentiment.
Increase in OI with Price Decrease: Suggests strong selling and bearish sentiment.
Decrease in OI with Price Increase/Decrease: Often shows traders are closing positions, which could signal market consolidation or a trend reversal.
2. Volatility: Definition and Types
Volatility measures the degree of variation of a financial instrument's price over time. It represents uncertainty or risk in price movements and is a fundamental concept in trading, risk management, and option pricing.
Types of Volatility:
Historical Volatility (HV):
It is calculated based on past price movements over a specific period. It indicates how much an asset's price fluctuated in the past.
Historical Volatility
=
Standard Deviation of Price Returns
Historical Volatility=Standard Deviation of Price Returns
Implied Volatility (IV):
Implied volatility is derived from the market price of options. It reflects the market’s expectations of future price fluctuations. High IV indicates the market expects large price movements, while low IV indicates relative calm.
Realized Volatility:
The actual volatility observed during a particular period. This is often compared with implied volatility to assess whether options are overvalued or undervalued.
Significance of Volatility:
Risk Assessment: Higher volatility implies higher risk and potential reward, which is critical for traders and risk managers.
Option Pricing: Volatility is a key input in the Black-Scholes and other option pricing models. Options tend to be more expensive when volatility is high.
Market Sentiment Indicator: Sudden spikes in volatility often reflect uncertainty, news events, or economic shocks.
Example:
If the Nifty 50 index fluctuates between 19,500 and 20,500 over a month, the volatility is measured based on the degree of these price changes. If options on Nifty reflect high implied volatility, traders expect further large swings.
3. Relationship Between Open Interest and Volatility
Open interest and volatility are interconnected in multiple ways:
Market Sentiment Indicator:
Rising open interest accompanied by rising volatility often signals that traders are aggressively taking positions in anticipation of significant price movements.
Liquidity and Price Swings:
Higher open interest can provide better liquidity, which may reduce short-term volatility. Conversely, in low-OI markets, even small trades can lead to sharp price swings.
Option Strategies:
In options trading, the interplay between open interest and implied volatility is crucial:
High OI + High IV = Liquid market but potentially expensive options.
Low OI + High IV = Less liquidity, more risk for entering/exiting trades.
Trend Analysis:
Traders often use the combination of price trend, open interest, and volatility to confirm trends or identify potential reversals.
4. Practical Applications in Trading
A. Futures and Options Trading:
Traders monitor open interest to identify which strike prices have the most open contracts, often referred to as "max pain" points, indicating potential support and resistance levels.
Implied volatility helps in deciding whether to buy or sell options. High IV may favor selling options, while low IV may favor buying options.
B. Risk Management:
Portfolio managers use volatility metrics to assess Value at Risk (VaR) and adjust positions accordingly.
Open interest provides insights into market exposure and liquidity, critical for managing large positions.
C. Intraday and Swing Trading:
Intraday traders often track sudden changes in open interest and volatility to anticipate short-term price moves.
Swing traders use historical volatility to set stop-loss levels and profit targets.
5. Indicators and Tools for Open Interest and Volatility
Open Interest Indicators:
Open Interest Analysis Charts: Show changes in OI for specific contracts.
Put-Call Ratio (PCR) with OI: Helps in gauging market sentiment for options.
Volatility Indicators:
Bollinger Bands: Uses standard deviation to gauge price volatility.
Average True Range (ATR): Measures the average movement of prices over a period.
VIX Index: Measures market-wide expected volatility (e.g., India VIX for Nifty options).
6. Challenges and Misconceptions
Open Interest is not directional: It only shows the number of contracts, not whether the market is bullish or bearish. Context with price movement is essential.
Volatility can be misleading: High volatility does not always imply a falling market; it may also indicate strong upward movements.
Interpreting both together: Correct interpretation requires combining price trends, OI changes, and volatility levels; isolated analysis can lead to false signals.
7. Conclusion
Open interest and volatility are pillars of market analysis for both retail and institutional traders. Open interest provides insight into market participation, liquidity, and potential trend strength, while volatility gauges price fluctuations, market risk, and option pricing dynamics. Together, they help traders:
Confirm trends and anticipate reversals.
Assess market sentiment and liquidity.
Strategize option trades based on risk and reward.
Make informed decisions in futures, options, and stock markets.
A successful trader combines these metrics with technical and fundamental analysis to navigate financial markets effectively. Ignoring either can lead to incomplete understanding and potential losses. Mastery of open interest and volatility allows traders to anticipate market moves, manage risk, and exploit opportunities systematically.
Institutional Trading Secrets: Understanding the Big Players1. The Scale Advantage
One of the most significant “secrets” of institutional trading is scale. Institutions have enormous capital, allowing them to negotiate lower trading costs, access exclusive research, and execute trades with minimal price impact through sophisticated algorithms. Retail traders often overlook the importance of scale, which allows institutions to implement strategies like:
Block Trades: Executing large orders off-exchange to prevent market disruption.
Dark Pools: Private exchanges where institutions can buy or sell large volumes anonymously.
Reduced Slippage: The ability to execute trades with minimal deviation from expected prices.
The scale advantage also allows institutions to diversify extensively across sectors, asset classes, and geographies, reducing risk and increasing the potential for higher returns.
2. Information Edge
Information asymmetry is a key element of institutional trading. Institutions often have access to research, data, and analytics that retail investors simply cannot match. This includes:
Proprietary Research: Many investment banks and funds employ teams of analysts to produce high-quality research on markets, sectors, and individual securities.
Market Intelligence: Institutional traders often receive early information about economic trends, corporate earnings, or mergers and acquisitions.
Alternative Data: Institutions increasingly leverage unconventional data sources like satellite imagery, credit card transactions, social media sentiment, and web traffic to gain an informational edge.
These resources allow institutions to anticipate price movements before they become visible to the broader market.
3. Advanced Trading Strategies
Institutional traders employ complex strategies that maximize profits while minimizing risk. Some of these include:
Algorithmic Trading: Algorithms can automatically execute trades based on pre-defined criteria like price, volume, or time. High-frequency trading (HFT) is a subset where trades occur in milliseconds.
Pairs Trading: Institutions exploit temporary divergences between correlated securities, buying one and shorting another.
Statistical Arbitrage: Using quantitative models to identify mispricings or anomalies across markets.
Options Hedging: Institutions frequently use options to hedge positions, reduce downside risk, or create leverage.
Liquidity Provision: Large institutions sometimes act as market makers, profiting from bid-ask spreads while managing risk exposure.
These strategies often require sophisticated technology and substantial capital—tools generally unavailable to individual traders.
4. Market Psychology Mastery
Institutional traders understand that markets are not purely rational—they are driven by human behavior. They exploit market psychology to their advantage:
Stop Hunting: Institutions may push prices to trigger stop-loss orders of retail traders, creating liquidity for their large trades.
Sentiment Analysis: Using news, social media, and order flow to gauge market sentiment and predict price movements.
Contrarian Approach: Institutions often take positions opposite to crowded retail trades, knowing that mass panic or euphoria can create price distortions.
By understanding retail behavior and psychological tendencies, institutions can strategically enter and exit positions without significantly affecting the market against their interests.
5. Timing and Execution Secrets
Execution timing is a critical aspect of institutional trading. Large orders can significantly impact prices, so institutions use various methods to optimize execution:
VWAP (Volume Weighted Average Price): Institutions execute trades in a way that aligns with average market price throughout the day, reducing market impact.
TWAP (Time Weighted Average Price): Distributing trades evenly over a period to avoid sudden price swings.
Dark Pools & Block Trades: Executing large trades away from public exchanges to prevent signaling intentions to other market participants.
Iceberg Orders: Large orders broken into smaller visible portions to avoid revealing the full size to the market.
Proper execution ensures that institutions can accumulate or liquidate positions without creating unnecessary volatility.
6. Risk Management Expertise
Institutions excel in risk management, using advanced tools to protect portfolios:
Diversification: Spreading investments across various sectors, asset classes, and geographies.
Hedging: Using derivatives like options, futures, and swaps to offset potential losses.
Stress Testing: Simulating market scenarios to evaluate portfolio performance under adverse conditions.
Position Sizing: Allocating capital to minimize exposure to any single trade or market.
Risk management is a cornerstone of institutional trading, ensuring long-term profitability even in volatile markets.
7. Understanding Market Structure
Institutions have an intimate knowledge of how financial markets operate:
Liquidity Pools: They know where and when liquidity exists, allowing efficient trade execution.
Order Flow Analysis: Institutions can read order books, tracking supply and demand imbalances.
Regulatory Knowledge: Understanding rules, circuit breakers, and tax implications allows institutions to trade efficiently without legal issues.
This deep comprehension of market mechanics provides a strategic advantage over retail traders, who often trade without insight into the bigger market picture.
8. The Role of Relationships and Networking
Institutional trading often leverages relationships with brokers, banks, and other institutions to gain preferential access to information or execution. These relationships can provide:
Early Access to IPOs: Institutions often get allocations of high-demand initial public offerings.
Private Placements: Opportunities to buy securities before they reach public markets.
Research Collaboration: Access to joint studies and market insights.
Networking ensures that institutions are always positioned at the forefront of opportunities.
9. Psychological Discipline
Institutional traders emphasize emotional control, a crucial but often overlooked secret. Unlike retail traders who may panic during downturns or chase momentum, institutions:
Follow Rules-Based Strategies: Trades are based on research and predefined rules, not impulses.
Maintain Patience: Institutions often hold positions for months or years, ignoring short-term noise.
Focus on Probabilities: Decision-making is rooted in statistical analysis rather than emotion.
Discipline is as critical as capital in institutional trading, helping sustain profitability over the long term.
10. Why Retail Traders Struggle to Replicate Institutions
Despite access to the same markets, retail traders often fail to emulate institutional success due to:
Capital Limitations: Small trades are vulnerable to slippage and lack influence over prices.
Emotional Trading: Impulsive decisions often lead to losses.
Information Gaps: Retail traders lack the research, data, and networking that institutions enjoy.
Execution Inefficiency: Large trades are harder for retail traders, but small trades can still be impacted by timing and liquidity.
Understanding these limitations helps retail traders set realistic expectations and adopt strategies that work within their constraints.
Conclusion
Institutional trading secrets revolve around scale, information, strategy, execution, risk management, and psychological discipline. Institutions exploit advantages in capital, research, and market insight to navigate complex markets with precision and control. While retail traders cannot fully replicate these advantages, understanding how institutions operate can improve decision-making, timing, and strategy in trading. By observing market patterns, analyzing order flow, and maintaining discipline, retail traders can align more closely with institutional logic—without necessarily having billions to invest.
In essence, institutional trading is less about luck and more about methodical planning, technological leverage, and disciplined execution. Knowing these secrets doesn’t guarantee profits, but it equips traders with a framework to think like the market’s most powerful participants.

Market Bubbles & Crashes in IndiaHistorical Context of Market Bubbles in India
India's financial markets have evolved over the last century, but the modern stock market history largely starts post-independence. The Bombay Stock Exchange (BSE), established in 1875, has been the central hub for trading activity, now supplemented by the National Stock Exchange (NSE), founded in 1992. Throughout this history, India has experienced multiple market bubbles and crashes, some unique to its economic environment and others reflective of global trends.
Major Market Bubbles in India
1. Harshad Mehta Bubble (1992)
One of the most infamous market bubbles in Indian history was the 1992 Harshad Mehta scam, which caused a meteoric rise in stock prices, particularly in the banking and IT sectors. Mehta exploited loopholes in the banking system to manipulate stock prices, creating artificial demand. The BSE Sensex rose from about 1,000 points in early 1990 to nearly 5,000 points by April 1992—a staggering 400% increase in two years.
Causes of the Bubble:
Financial system loopholes, especially in ready-forward deals.
Excessive speculative trading by retail and institutional investors.
Media hype and public optimism, driving momentum investing.
Crash Trigger:
When the scam was exposed, investor confidence collapsed. Stocks plummeted, wiping out enormous wealth. The Sensex fell by almost 60% over a few months. The aftermath led to reforms in banking, securities regulations, and transparency norms.
2. Dot-Com Bubble (1999–2000)
India’s technology sector experienced a bubble during the dot-com boom of the late 1990s. Fueled by global technology optimism, internet-related and IT companies saw their valuations skyrocket despite limited profits. The Sensex rose from around 3,000 points in 1998 to over 6,000 points in early 2000.
Causes:
Global IT optimism and foreign investment inflows.
High investor appetite for tech IPOs despite uncertain business models.
Liberalization policies encouraging foreign institutional investment.
Crash:
When the global tech bubble burst in 2000, the Indian market corrected sharply. Many overvalued IT firms collapsed, and investors faced substantial losses. This crash highlighted the risk of speculative inflows in emerging markets and emphasized the need for robust corporate governance.
3. 2007–2008 Global Financial Crisis and Indian Market
Although not originating in India, the 2007–2008 global financial crisis triggered a significant Indian market bubble burst. Prior to the crash, India witnessed a strong bull run, with the Sensex touching 20,000 points in early 2008, fueled by foreign capital inflows and credit expansion.
Causes of Bubble:
Excessive foreign institutional investment and liquidity.
Credit expansion and easy access to finance for corporate growth.
Over-optimism about India’s economic growth potential.
Crash Trigger:
Global liquidity drying up, the collapse of Lehman Brothers, and slowing domestic growth led to panic selling. The Sensex fell from over 20,000 points to around 8,500 points in October 2008, a massive correction exceeding 50%. The crisis reinforced the interconnectedness of Indian markets with global finance and the dangers of over-reliance on foreign capital.
4. COVID-19 Pandemic Bubble and Correction (2020–2021)
The COVID-19 pandemic created an unprecedented economic shock, yet markets rebounded rapidly due to liquidity injections by central banks, fiscal stimulus, and retail investor participation. The Sensex and Nifty 50 reached all-time highs by late 2021, despite the ongoing health crisis and economic uncertainty.
Causes of Bubble:
Record liquidity and low-interest rates encouraging stock market investments.
Surge in retail investors entering through mobile trading platforms.
Momentum investing in sectors like pharma, IT, and consumer goods.
Correction:
Global inflation concerns, rising bond yields, and sector rotation in 2022–2023 led to sharp corrections, reminding investors that price appreciation without fundamental backing is unsustainable.
Behavioral and Economic Drivers of Bubbles
Several factors contribute to bubbles and crashes in India:
Speculation and Herd Behavior: Investors often follow trends without analyzing fundamentals, driven by fear of missing out (FOMO).
Excess Liquidity: Low-interest rates and easy credit can inflate asset prices.
Media Influence: Sensational reporting can fuel market optimism or panic.
Regulatory Gaps: Loopholes or slow regulatory response can exacerbate unsustainable price movements.
Global Influences: India’s markets are increasingly sensitive to international trends, such as interest rates, crude prices, and foreign investment flows.
Impact of Market Bubbles and Crashes
Economic Impact: Crashes can reduce household wealth, lower consumption, and slow economic growth.
Investor Confidence: Frequent bubbles followed by crashes can erode trust in financial markets, discouraging long-term investment.
Regulatory Reforms: Many Indian market reforms—like SEBI regulations, tighter banking oversight, and improved disclosure norms—were reactions to past bubbles and scams.
Behavioral Lessons: Investors learn the importance of diversification, risk management, and the dangers of speculative investing.
Measures to Prevent and Mitigate Bubbles
India has strengthened its financial ecosystem over time:
Regulatory Oversight: SEBI actively monitors stock manipulation, insider trading, and market abuse.
Market Education: Initiatives to educate retail investors on risks and fundamentals.
Transparency: Mandatory disclosure norms and corporate governance standards.
Circuit Breakers: Stock exchanges have mechanisms to halt trading during extreme volatility to prevent panic selling.
Despite these measures, complete prevention is impossible. Market psychology and macroeconomic factors always carry some risk of bubbles forming.
Conclusion
Market bubbles and crashes in India reflect a combination of investor psychology, regulatory environment, economic policies, and global influences. From the Harshad Mehta scam to the post-COVID rally, India has repeatedly experienced cycles of irrational exuberance followed by harsh corrections. While these events can cause economic disruption and personal financial losses, they also drive reform, strengthen market resilience, and provide critical lessons for investors. Understanding the patterns, causes, and effects of bubbles and crashes helps market participants make informed decisions, manage risk, and foster sustainable growth in India’s capital markets.
Event-Based Trading: A Comprehensive OverviewTypes of Events in Event-Based Trading
Event-based trading revolves around various types of events that can materially impact the value of securities. These events are generally categorized into corporate, economic, political, and market-wide events:
Corporate Events
These include events directly related to individual companies. Key examples include:
Earnings Announcements: Quarterly or annual earnings reports often trigger sharp price movements, especially if results deviate significantly from market expectations.
Mergers and Acquisitions (M&A): News of a merger, acquisition, or takeover bid can drastically alter a company’s valuation. Traders may buy shares of the target company in anticipation of a takeover premium or short the acquirer if they anticipate integration challenges.
Stock Splits or Buybacks: Companies announcing stock splits or share repurchase programs can influence demand and supply dynamics, creating trading opportunities.
Spin-offs: When a company spins off a subsidiary, traders often analyze relative valuations to exploit potential mispricings.
Economic Events
Economic data releases and policy decisions can move markets significantly:
Interest Rate Announcements: Central bank decisions can influence bond yields, currency valuations, and stock markets.
Inflation Data and Employment Reports: Unexpected deviations from forecasts often lead to volatility in equities, currencies, and commodities.
GDP Growth Reports: Market participants adjust their risk exposure based on economic growth trends.
Political Events
Political developments can have far-reaching effects:
Elections: Outcome predictions or surprises can shift investor sentiment across sectors or entire markets.
Regulatory Changes: Policy shifts in taxation, environmental regulations, or trade agreements can impact specific industries.
Geopolitical Tensions: Conflicts, sanctions, or trade wars create sudden market reactions, often in commodities like oil or gold, and in related equities.
Market Events
Market-specific events include phenomena like:
IPO Launches: Newly listed stocks often experience high volatility due to initial market sentiment and institutional interest.
Index Rebalancing: Periodic adjustments of stock indices by benchmark providers can create temporary demand-supply imbalances.
Corporate Governance Changes: Resignations of key executives or board restructuring can influence investor confidence.
Key Principles of Event-Based Trading
Event-based trading relies on a combination of research, anticipation, timing, and risk management. The key principles include:
Anticipation and Analysis
Traders must anticipate which events could lead to profitable opportunities. This requires understanding historical market reactions, industry dynamics, and economic sensitivities. For example, if a central bank is expected to raise interest rates, currency and banking stocks may react predictably.
Volatility Exploitation
Events often create short-term price spikes or drops due to sudden shifts in supply-demand dynamics. Event-based traders seek to enter positions before or immediately after such moves to profit from rapid price changes.
Information Advantage
Traders rely on timely and accurate information. Access to real-time news feeds, earnings reports, economic indicators, and regulatory filings is critical. Some professional event traders use alternative data sources, such as satellite imagery for commodity analysis or shipping data for logistics insights.
Short-Term Focus
While some event-based strategies can be medium-term, most trading revolves around short-term price reactions. Traders often hold positions for hours, days, or weeks, depending on the nature and expected impact of the event.
Risk Management
Event-based trading carries inherent risks due to unpredictable outcomes. Sudden reversals, rumors, or delayed reactions can lead to losses. Traders use stop-loss orders, position sizing, and hedging strategies to protect capital.
Common Event-Based Trading Strategies
Event-driven traders often specialize in particular strategies based on event type and market response:
Merger Arbitrage
Traders exploit the price difference between the current trading price of a target company and the announced acquisition price. For instance, if a company is being acquired for $50 per share, but the stock trades at $47, traders might buy the stock anticipating a convergence to the acquisition price.
Earnings Plays
Traders anticipate stock price movements around earnings releases by analyzing historical earnings surprises and market expectations. They may use options strategies like straddles or strangles to profit from anticipated volatility.
Dividend Capture
Some traders focus on stock price movements around dividend announcements or ex-dividend dates, seeking short-term gains from anticipated adjustments in stock prices.
Regulatory Arbitrage
Traders identify potential winners or losers from regulatory changes. For instance, if a government announces incentives for renewable energy, event-based traders might buy stocks in solar or wind energy companies.
Macro Event Trading
Economic data releases, interest rate decisions, and geopolitical developments create opportunities in forex, bonds, commodities, and equity markets. Traders position themselves to profit from expected market reactions.
Tools and Techniques in Event-Based Trading
Successful event-based trading relies on a combination of analytical, technological, and informational tools:
News and Data Feeds
Real-time information from Bloomberg, Reuters, and other financial data providers allows traders to react swiftly to events.
Event Calendars
Calendars tracking earnings releases, IPOs, mergers, central bank meetings, and economic announcements help traders plan positions in advance.
Options and Derivatives
Options, futures, and other derivatives are often used to hedge risk or enhance returns, especially when anticipating large price swings.
Quantitative Models
Advanced event-based traders use algorithms to model market reactions based on historical data, volatility patterns, and correlations.
Sentiment Analysis
Natural language processing and social media monitoring help gauge market sentiment around corporate and macroeconomic events.
Advantages of Event-Based Trading
Profit Potential: Exploiting short-term mispricings around events can generate substantial returns.
Diverse Opportunities: Multiple event types across sectors and asset classes provide a wide array of trading possibilities.
Leverage Use: Derivatives allow traders to amplify returns on event-driven trades.
Reduced Market Direction Risk: Some strategies, like merger arbitrage, are less dependent on overall market trends.
Challenges and Risks
Despite its potential, event-based trading comes with unique challenges:
Unpredictable Outcomes: Not all events have the expected market impact; surprises can lead to significant losses.
Timing Sensitivity: Missing the optimal entry or exit window can erode potential profits.
High Volatility: Sharp price swings can trigger margin calls and emotional decision-making.
Information Competition: Institutional traders with superior access and algorithms may capture most profitable opportunities.
Regulatory Risks: Insider trading regulations must be strictly followed; trading on non-public material information is illegal.
Conclusion
Event-based trading is a sophisticated strategy that capitalizes on market inefficiencies caused by specific events. Its effectiveness relies on a blend of meticulous research, rapid execution, and robust risk management. By focusing on corporate announcements, economic indicators, political developments, and market-specific events, traders aim to exploit the short-term mispricings that naturally arise in response to new information. While it offers the potential for substantial profits, it also demands expertise, discipline, and technological resources to navigate its inherent risks successfully. In today’s fast-moving markets, event-based trading represents both a challenge and an opportunity for traders willing to act decisively on the information that shapes asset prices.

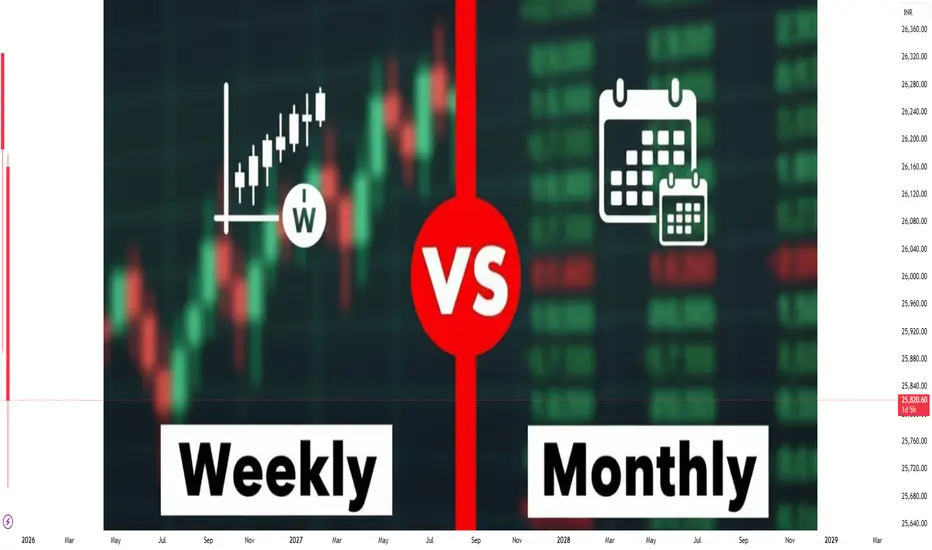
Weekly vs Monthly Options Trading1. Understanding Weekly and Monthly Options
Monthly Options
Also known as standard expiry options.
These options expire on the last Thursday of every month in markets like India (NSE).
They have been around since the inception of exchange-traded options.
Provide a longer duration of time value and stable premium structure.
Weekly Options
Introduced to provide short-term trading opportunities.
These options expire every Thursday (except monthly expiry week).
Much shorter lifespan—often just 5–7 days.
Popular in instruments like Nifty, Bank Nifty, FinNifty, and stocks (limited list).
2. Time Value & Theta Decay
One of the most important differences between weekly and monthly options is theta decay—the rate at which option premium loses value as expiry approaches.
Monthly Options
Have slower theta decay in the early weeks.
Premium erodes gradually.
Most decay accelerates in the last 7–10 days before expiry.
Suitable for swing and positional option selling.
Weekly Options
Have very fast theta decay.
Premium can melt drastically 2–3 days before expiry or even intraday.
Perfect for intraday and short swing theta-based strategies.
But risky for buyers since rapid decay eats premium quickly.
In short:
Sellers benefit more from weeklies due to rapid premium erosion.
Buyers must time entries well or risk losing premium quickly.
3. Liquidity & Bid–Ask Spreads
Monthly Options
Generally deep liquidity, especially in indices like Nifty.
Bid–ask spreads are narrower.
Easy to place big orders.
Weekly Options
Liquidity varies by strike.
ATM and near strikes have excellent liquidity in Nifty & Bank Nifty.
But far OTM strikes or stock weeklies may have wider spreads.
Bottom line:
Weekly options = high liquidity in popular indices.
Monthly options = stable liquidity across many strikes.
4. Volatility Impact (Vega)
Monthly Options
Higher vega.
More sensitive to changes in implied volatility (IV).
Good for volatility-based strategies like straddles, strangles, long vega positions, calendar spreads.
Weekly Options
Lower vega.
Less sensitive to IV unless close to events like results or macro announcements.
Therefore:
If you want to trade volatility → choose monthly options.
If you want to trade quick moves/time decay → choose weekly options.
5. Cost & Premium Differences
Monthly Options
Higher premiums because more time value exists.
Suitable for:
Hedging
Swing options buying
Calendar spreads
Position building
Weekly Options
Much cheaper premiums due to short life.
Allows:
Quick scalping
Event-specific trading
Intraday buying and selling
But sharp moves can wipe out premiums fast.
For buyers:
Monthly = safer, but slower.
Weekly = cheaper, but high risk.
6. Risk Differences
Risk in Weekly Options
Very high for buyers due to theta decay.
High for sellers during volatile sessions.
Strikes can become worthless within minutes near expiry.
Very sensitive to intraday big moves (gamma risk).
Risk in Monthly Options
More stable, controlled decay.
Better for hedged strategies.
Lower intraday gamma exposure.
Gamma exposure:
Weekly > Monthly
Means weekly options react faster to price moves: good for directional traders, dangerous for late sellers.
7. Which Is Better for Option Buyers?
Monthly Options
Better for buyers because:
More time for the trade to work.
Slower premium decay.
Good for swing/positional directional trades.
Weekly Options
Useful only when:
You expect a sharp, fast move (e.g., news, breakout, expiry day momentum).
Intraday or same-day scalping.
General rule:
Buyers prefer monthly options.
Experienced intraday traders may buy weeklies for quick momentum.
8. Which Is Better for Option Sellers?
Weekly Options
Best tool for sellers.
Rapid theta decay = high edge.
Ideal for:
Short straddles/strangles
Credit spreads
Iron condors
Intraday selling
Expiry day option selling
Monthly Options
Used for safe, hedged, non-aggressive selling.
Good for:
Covered calls
Calendar spreads
Iron condors
Protected strangles
General rule:
Sellers prefer weekly for profit.
Monthly for stability and lower risk.
9. Event Trading: Weekly vs Monthly
Weekly Options
Used for:
RBI policy
Fed minutes
Budget week
Elections
Major results (if available on the stock)
Global announcements
Because weeklies allow cheap premia and controlled exposure for short periods.
Monthly Options
Used for:
Longer-term swing trading around events.
Volatility build-up strategies.
Protecting long-term portfolios.
10. Strategies Suitable for Each
✔ Weekly Options: Best Strategies
Intraday scalping (ATM options)
Expiry day straddle/strangle selling
Credit spreads for quick decay
Ratio spreads
Iron flies (expiry week)
Short gamma strategies
✔ Monthly Options: Best Strategies
Long calls/puts (positional)
Calendar spreads (monthly vs weekly)
Diagonal spreads
Covered calls
Vertical debit spreads
Condors for stable markets
11. Who Should Trade What?
Weekly Options – Ideal for
Experienced intraday traders
Scalpers
Option sellers
Short-term event traders
High-risk traders
Monthly Options – Ideal for
Beginners
Positional traders
Swing traders
Hedgers
Risk-averse participants
12. Pros & Cons Summary
Weekly Options
Pros
Fast returns
Low premium
Ideal for intraday/expiry
High theta decay
Great for sellers
Cons
Very risky for buyers
Sudden losses during volatility
Requires precision timing
Higher gamma risk
Monthly Options
Pros
More stable
Less risky
Longer time value
Suitable for swing buyers
Good for hedging
Cons
Slower returns
Higher capital for sellers
Less excitement compared to weeklies
Final Conclusion
Weekly and monthly options serve different purposes. Weekly options provide speed, volatility, and rapid theta decay, making them ideal for advanced traders, especially sellers and intraday scalpers. Monthly options provide stability, safer premiums, and slower decay, making them suitable for swing traders, beginners, and long-term strategists.
A trader can use both depending on goals:
Weekly for tactical short-term trades.
Monthly for strategic long-term positioning.