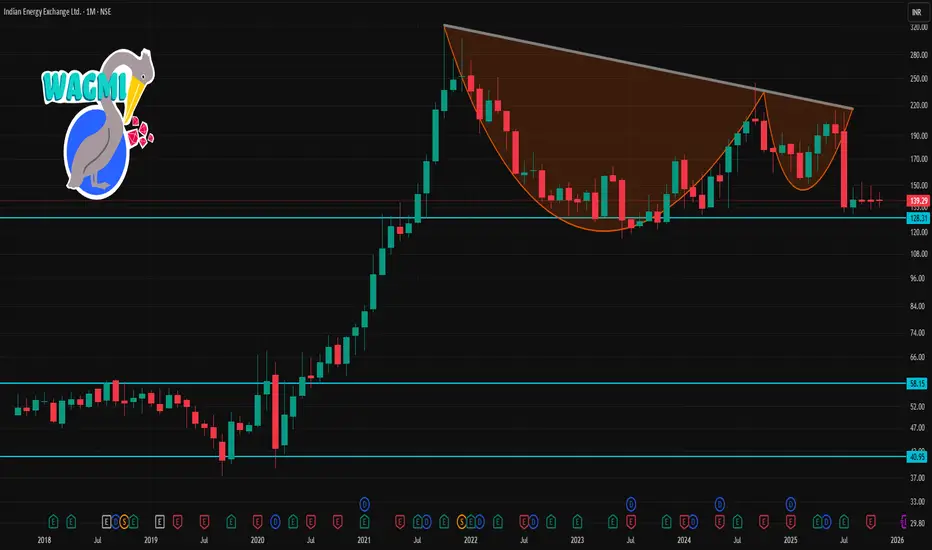
IEX 1 Month Time Frame 📈 Current snapshot
As of late November 2025, IEX trades around ₹139–140/share.
The 52-week range remains ~₹130.26 (low) to ~₹215.40 (high).
Recent trading has seen a dip from earlier resistance around ₹145–150 down to ~₹139.
🎯 1-Month Scenarios for IEX
Neutral / Range-bound → ₹138–145: If markets stay sideways and no big catalyst arrives.
Mild Rebound → ₹145–149: If there’s some buying interest (maybe due to broader market recovery or stabilization), price could test the higher resistance.
Downside Risk → ₹135–137: If sentiment worsens (e.g. fear around regulatory changes, weak volumes), stock could retest lower support.
Trendlineanalysis
BAJFINANCE 1 Day Tme Frame 🔎 Current Snapshot
Last traded price (approx): ₹ 1,037.50–₹ 1,038.
52-week high / low: ~₹ 1,102.50 / ~₹ 649.10
✅ Interpretation — What this implies today
Since current price (~₹ 1,037–1,038) is essentially at the pivot/central reference, the stock is at a neutral/indecisive zone.
For a bullish bias: a clean breakout above ~₹ 1,044 (R1) — especially with volume — could open up the path toward ~₹ 1,049–1,050 (R2), and maybe ~₹ 1,055–1,060 zone as broader resistance.
On the downside: if price dips, watch for support around ~₹ 1,031–1,032 (S1), and next support near ~₹ 1,024–1,025 (S2). A break below S2 with weakness could invite deeper correction or consolidation.
If price stays near pivot without clear breakout or breakdown, expect range-bound trading between ~₹ 1,031–1,044, until a trigger (volume/market move) shows direction.

Super Cycle Outlook: The Big Picture in Financial MarketHistorical Perspective of Super Cycles
Historically, super cycles have often been observed in commodities, stock markets, and global trade patterns. For instance:
Commodity Super Cycles: The industrialization of the United States and Europe during the 19th century created the first global commodity super cycle, driven by massive demand for coal, iron, and raw materials. Similarly, the post-World War II economic expansion, especially between the 1950s and 1970s, fueled a commodities boom, creating a super cycle for oil, metals, and agricultural products. More recently, China’s industrial rise in the 2000s led to a demand-driven super cycle in base metals such as copper, iron ore, and aluminum.
Equity Market Super Cycles: Stock markets also experience long-term super cycles, often reflecting sustained technological innovation, demographic transitions, or globalization. The U.S. stock market experienced a super cycle from the 1980s through 1999, driven by technology adoption, financial deregulation, and globalization. Similarly, emerging markets like India and China have seen multi-decade super cycles as rapid urbanization, rising middle-class income, and industrial expansion drove sustained economic growth.
Drivers of Super Cycles
Super cycles are not random—they are typically fueled by a combination of structural factors that persist over decades:
Demographics: Population growth and urbanization play a central role in super cycles. A young, growing population increases labor force participation, consumer demand, and investment in infrastructure. For instance, Asia’s rapid urbanization in the early 2000s drove a long-term commodity super cycle.
Technological Innovation: Revolutionary technologies can create long-term growth trends in equity markets and certain sectors. The rise of the internet, renewable energy, electric vehicles, and artificial intelligence has the potential to fuel new super cycles, reshaping the global economic landscape.
Globalization and Trade Expansion: The integration of emerging economies into global supply chains often creates decades-long growth trends. China’s entry into the World Trade Organization (WTO) in 2001 triggered a commodity super cycle and reshaped global trade flows.
Monetary and Fiscal Policies: Low interest rates, expansive fiscal spending, and accommodative monetary policy can extend super cycles by encouraging investment and consumption. The post-2008 period of global quantitative easing, for example, contributed to sustained equity market rallies in developed countries.
Geopolitical Shifts: Wars, sanctions, and trade agreements can have long-lasting effects on commodity prices and market sentiment. For instance, oil price super cycles have often coincided with geopolitical disruptions in the Middle East or shifts in OPEC strategies.
Phases of a Super Cycle
Super cycles generally progress through distinct phases, each with unique characteristics:
Emergence Phase: This is the initial stage, marked by structural change, technological breakthroughs, or demographic shifts. Asset prices may begin rising slowly as markets recognize long-term trends.
Acceleration Phase: During this period, growth becomes more visible and widely accepted. Investor optimism builds, demand outpaces supply, and markets often experience rapid price appreciation. Commodities or equities enter a strong upward trajectory.
Peak Phase: At this stage, growth reaches its maximum. Prices are often overextended relative to historical norms, speculation may increase, and market volatility can rise. Structural imbalances, such as overproduction or inflated valuations, often become apparent.
Decline or Correction Phase: After the peak, the super cycle gradually cools. Prices may decline sharply or stabilize at a lower growth trajectory, often influenced by macroeconomic corrections, demographic slowdowns, or shifts in policy.
Consolidation or Reversal: In some cases, super cycles may transition into new cycles or periods of stagnation. For instance, a commodities super cycle might end as demand stabilizes and supply chains normalize, paving the way for a new cycle in another sector or geography.
Implications for Investors
Understanding super cycles is crucial for both short-term traders and long-term investors:
Long-Term Asset Allocation: Super cycles influence which asset classes are likely to outperform over decades. For example, during commodity super cycles, investing in metals, energy, or infrastructure stocks can yield substantial returns.
Risk Management: Super cycles often bring higher volatility in the mid-term. Being aware of the stage of a super cycle allows investors to adjust portfolios and hedge risks effectively.
Sector Rotation: Super cycles create sector-specific opportunities. In the technology-driven super cycle of the 1990s, tech and internet companies outperformed traditional sectors. Similarly, emerging markets outperform during demographic-driven cycles.
Global Diversification: Super cycles are often regional or sector-specific. By diversifying globally, investors can capture growth in regions or sectors that are entering new super cycles while mitigating risks from declining cycles elsewhere.
Current Super Cycle Outlook
As of 2025, several analysts believe the global economy may be entering a new super cycle driven by:
Green Energy Transition: The global shift toward renewable energy, electric vehicles, and decarbonization efforts is creating a new long-term demand pattern for commodities like lithium, cobalt, copper, and rare earth metals.
Technological Advancement: AI, robotics, cloud computing, and biotechnology are transforming productivity and creating multi-decade growth opportunities in equities and specialized sectors.
Demographics and Urbanization in Emerging Markets: Africa, Southeast Asia, and parts of Latin America are experiencing rapid urbanization and population growth, potentially fueling new super cycles in infrastructure, consumer goods, and financial services.
Monetary Policy Evolution: Central banks are navigating the post-pandemic environment with cautious monetary policy, balancing inflation control and growth stimulation, which may influence the timing and intensity of super cycles.
Challenges and Risks
While super cycles present opportunities, they also carry inherent risks:
Speculative Excess: Long-lasting uptrends can encourage excessive speculation, leading to bubbles and abrupt corrections.
Geopolitical Uncertainty: Conflicts, trade wars, or sanctions can disrupt supply chains and derail super cycle expectations.
Technological Disruption: While technology can drive growth, it can also render existing industries obsolete, creating winners and losers in the market.
Environmental Constraints: Resource depletion, climate change, and sustainability issues may cap the potential of certain super cycles, especially in commodities and energy markets.
Conclusion
Super cycles are among the most influential drivers of long-term financial market trends. Unlike normal market cycles, they reflect deep structural shifts in economies, technologies, demographics, and global trade patterns. Understanding super cycles allows investors to make strategic long-term decisions, manage risks, and identify sectors poised for decades of growth. While predicting the exact timing and magnitude of super cycles is challenging, analyzing macroeconomic trends, demographic shifts, technological innovation, and geopolitical developments can provide valuable insights into where the next long-term opportunities may lie.
In 2025, the global outlook suggests a transition into a super cycle shaped by green energy, technological transformation, and emerging market growth. Investors, policymakers, and strategists who recognize and adapt to these long-term trends are likely to capture the maximum benefits of the next multi-decade expansion, while carefully managing the risks inherent in any large-scale structural market movement.
A Comprehensive Guide to Managing Trading Risk1. Understanding Trading Risk
Trading risk refers to the possibility of losing part or all of the capital invested due to market movements, volatility, or other unforeseen events. Risk can be classified into different types:
Market Risk: The risk that market prices will move unfavorably.
Liquidity Risk: The inability to buy or sell an asset without causing significant price changes.
Credit Risk: The risk that a counterparty may fail to fulfill contractual obligations.
Operational Risk: Losses due to system failures, errors, or human mistakes.
Psychological Risk: Emotional decision-making leading to impulsive or irrational trades.
Understanding the type of risk you are exposed to is the first step toward controlling it.
2. Capital Allocation and Position Sizing
One of the most fundamental principles of risk management is controlling the amount of capital allocated to each trade. Traders often use position sizing to ensure that no single trade can significantly damage their portfolio.
Rule of Thumb: Risk no more than 1–2% of your total trading capital on a single trade. For example, if your capital is ₹1,00,000, your maximum loss per trade should be ₹1,000–₹2,000.
Position Size Formula: Position Size = (Capital at Risk) ÷ (Entry Price – Stop Loss Price). This ensures the risk is limited according to your strategy.
Proper capital allocation protects traders from catastrophic losses and allows them to stay in the game even during losing streaks.
3. Using Stop Losses
Stop-loss orders are essential tools for limiting losses. They automatically close a trade when the market moves against your position by a predetermined amount.
Fixed Stop Loss: A predetermined price level at which the trade will be closed.
Trailing Stop Loss: A dynamic stop loss that moves with favorable price movement, locking in profits while limiting downside.
Volatility-Based Stop Loss: Adjusts stop loss based on market volatility, often using indicators like Average True Range (ATR).
Stop losses remove the emotional component from trading decisions and prevent impulsive reactions during market swings.
4. Diversification
Diversification reduces the overall risk of a trading portfolio by spreading capital across multiple assets, sectors, or markets.
Asset Diversification: Trade in multiple asset classes like stocks, commodities, and forex.
Sector Diversification: Invest across different sectors (technology, healthcare, energy) to mitigate sector-specific risks.
Strategy Diversification: Use multiple trading strategies (trend-following, mean-reversion, scalping) to avoid over-reliance on a single approach.
Diversification reduces the probability that a single adverse market event will wipe out your capital.
5. Risk-Reward Ratio
Every trade carries both risk and potential reward. Maintaining a favorable risk-reward ratio is crucial for long-term profitability.
Definition: Risk-Reward Ratio = Potential Profit ÷ Potential Loss.
Recommended Ratio: Many professional traders aim for a minimum 1:2 ratio, meaning potential profit is at least twice the potential loss.
Even if a trader wins only 50% of trades, a favorable risk-reward ratio ensures profitability over time.
6. Use of Leverage with Caution
Leverage amplifies both gains and losses. While it allows traders to control large positions with limited capital, it can also lead to rapid account depletion if mismanaged.
Leverage Limits: Only use leverage that you can comfortably manage. Beginners should avoid high leverage entirely.
Margin Requirements: Always monitor margin requirements and avoid over-leveraging positions.
Responsible use of leverage is a critical aspect of risk management, especially in highly volatile markets like forex or derivatives.
7. Hedging Strategies
Hedging is a method of reducing exposure to adverse price movements by taking offsetting positions in correlated assets.
Options and Futures: Traders can hedge stock positions using put options or futures contracts.
Currency Hedging: Forex traders may hedge currency exposure to protect against exchange rate fluctuations.
Portfolio Hedging: Using ETFs or inverse instruments to mitigate overall portfolio risk.
While hedging can reduce risk, it also comes at a cost, so it should be applied judiciously.
8. Monitoring Market Conditions
Risk is not static—it fluctuates with market conditions. Traders should continuously monitor macroeconomic events, market news, and technical indicators to adjust their risk exposure.
Volatility Analysis: Use indicators like Bollinger Bands or ATR to measure market volatility.
Economic Events: Keep track of interest rate decisions, inflation data, earnings announcements, and geopolitical events.
Technical Signals: Use trendlines, moving averages, and support/resistance levels to identify potential risk zones.
Being proactive rather than reactive helps in managing risks more effectively.
9. Psychological Risk Management
Emotions can be a trader’s worst enemy. Fear and greed often lead to impulsive decisions that magnify risk.
Trading Plan: Have a detailed plan that includes entry, exit, and risk limits.
Discipline: Stick to your trading plan even during drawdowns.
Avoid Overtrading: Taking too many trades increases exposure to unnecessary risk.
Record Keeping: Maintain a trading journal to analyze mistakes and improve strategies.
Mental resilience and self-discipline are as important as technical risk controls.
10. Continuous Learning and Adaptation
Markets evolve, and strategies that worked in the past may not be effective in the future. Risk management requires constant learning and adaptation.
Backtesting: Test trading strategies on historical data to evaluate risk.
Simulation Trading: Practice with demo accounts to refine risk management without financial loss.
Stay Updated: Read financial news, follow market analysts, and keep learning about new risk management tools.
Continuous improvement ensures that traders adapt to changing market dynamics while protecting capital.
11. Emergency Risk Controls
Even with careful planning, unexpected events like market crashes, flash crashes, or broker failures can occur. Traders should implement emergency risk controls.
Circuit Breakers: Use automatic exit mechanisms during extreme volatility.
Diversified Brokers: Avoid keeping all funds with a single broker.
Insurance Products: Consider financial instruments or policies that protect against catastrophic losses.
Having contingency plans safeguards against black swan events and extreme losses.
Conclusion
Managing trading risk is not about eliminating it—it is about understanding, controlling, and mitigating it. Effective risk management allows traders to survive losing streaks, capitalize on opportunities, and maintain consistent growth. Key principles include prudent capital allocation, stop-loss usage, diversification, favorable risk-reward ratios, disciplined leverage, hedging, and psychological resilience. Continuous monitoring, adaptation, and emergency preparedness further enhance risk control.
Ultimately, the trader who masters risk management doesn’t merely seek profit but protects the most valuable asset: their capital. Profit is fleeting, but capital preservation ensures a seat at the market table for the long term. By integrating these principles into daily trading routines, traders can navigate the uncertain waters of financial markets with confidence and discipline.
Types of Financial Markets1. Capital Markets
Capital markets are long-term financial markets where instruments such as equities (shares) and long-term debt (bonds) are traded. These markets help businesses and governments raise funds for expansion, infrastructure, or other long-term projects.
a. Stock Market
The stock market enables companies to raise capital by issuing shares to investors. There are two segments:
Primary Market: Companies issue new shares for the first time through Initial Public Offerings (IPO). This is the market where securities are created.
Secondary Market: After issuance, shares are bought and sold among investors via stock exchanges like the NSE, BSE, NYSE, and NASDAQ.
Importance:
Provides companies with capital for expansion
Offers investors opportunities for wealth creation
Acts as a barometer of the economy
b. Bond Market
The bond market, also called the debt market, deals with the issuance and trading of bonds. These are typically issued by governments, corporations, or municipalities to borrow money.
Types of bonds include:
Government bonds
Corporate bonds
Municipal bonds
Convertible bonds
Role:
It offers stable returns, lower risk compared to equities, and is crucial for government financing.
2. Money Markets
Money markets deal with short-term debt instruments with maturities of less than one year. These markets help institutions manage short-term liquidity needs.
Instruments include:
Treasury bills (T-bills)
Commercial paper (CP)
Certificates of deposit (CDs)
Repurchase agreements (Repos)
Participants: Banks, financial institutions, corporations, mutual funds, and central banks.
Purpose:
To provide short-term funding, support liquidity, and stabilize the banking system.
3. Foreign Exchange (Forex) Market
The forex market is the world’s largest and most liquid financial market. It facilitates the global exchange of currencies.
Key features:
Operates 24/5 across global financial centers
Daily trading volume exceeds trillions of dollars
Involves participants like banks, hedge funds, corporations, retailers, and governments
Types of forex markets:
Spot Market: Immediate currency exchange
Forward Market: Future delivery at a pre-agreed rate
Futures Market: Standardized currency contracts traded on exchanges
Importance:
It enables international trade, investment flows, tourism, and global business operations.
4. Derivatives Markets
Derivatives markets trade financial contracts whose value is derived from an underlying asset—such as stocks, currencies, interest rates, or commodities.
Main derivative instruments:
Futures: Obligatory contracts to buy/sell assets at a future date
Options: Contracts giving the right but not the obligation to buy/sell
Swaps: Exchange of cash flows (e.g., interest rate swaps)
Forwards: Customized over-the-counter (OTC) contracts
Use cases:
Hedging risk (price risk, currency risk)
Speculation for profit
Arbitrage opportunities
Portfolio diversification
Derivative markets enhance liquidity and allow businesses to manage financial exposure efficiently.
5. Commodity Markets
Commodity markets deal with physical goods or raw materials such as:
Gold, silver
Crude oil, natural gas
Agricultural products (wheat, sugar, cotton)
Metals (aluminum, copper)
These commodities can be traded in two ways:
a. Spot Commodity Market
Immediate delivery and payment occur. Prices depend on real-time supply and demand.
b. Commodity Derivatives Market
Futures and options contracts allow traders to speculate or hedge commodity price fluctuations.
Importance:
Commodity markets help producers secure price stability and provide investors with opportunities beyond traditional financial assets.
6. Cryptocurrency and Digital Asset Markets
With rapid technological advancement, cryptocurrencies have created a new type of financial market. These markets trade digital tokens like Bitcoin, Ethereum, and thousands of altcoins.
Features:
Decentralized blockchain-based system
Trades through exchanges like Binance, Coinbase, and others
High volatility, high return potential
Instruments Include:
Spot trading
Futures and perpetual contracts
Staking and yield farming
Cryptocurrency markets are reshaping modern finance, introducing decentralized finance (DeFi), NFTs, and Web3 innovations.
7. Insurance Markets
Though not traditional trading markets, insurance markets play a crucial role in risk distribution. They allow individuals and businesses to transfer risks of financial loss to insurance companies.
Types of insurance markets:
Life insurance
Health insurance
Property and casualty insurance
Reinsurance
These markets support economic growth by offering financial protection and risk coverage.
8. Real Estate Markets
Real estate markets involve buying, selling, and leasing residential, commercial, and industrial properties.
Components:
Physical property market
Real estate investment trusts (REITs)
Mortgage-backed securities (MBS)
Real estate offers steady income through rent and long-term appreciation, making it a key investment category.
9. Credit Markets
Credit markets deal with borrowing and lending between parties. They include:
Bank loans
Credit lines
Mortgages
Consumer lending
These markets influence spending, investment, and economic growth by determining the availability and cost of credit.
10. Over-the-Counter (OTC) Markets
OTC markets involve decentralized trading without a centralized exchange. Participants trade directly through brokers or dealers.
Examples:
Currency forwards
Interest rate swaps
Corporate debt
Certain derivatives
OTC markets offer flexibility but carry higher counterparty risk.
11. Auction Markets
Auction markets match buyers and sellers by competitive bidding. The price is determined by supply and demand.
Examples:
Government bond auctions
Commodity auctions
IPO book-building auctions
These markets ensure transparency and fair price discovery.
Conclusion
Financial markets are diverse, interconnected systems that influence every part of the global economy. Each market—whether capital, money, forex, commodity, or derivatives—serves a unique role in facilitating investment, supporting business operations, managing risk, and driving economic growth. Understanding these markets helps investors, businesses, and policymakers make informed decisions. Together, these markets form the complex network through which money flows, value is created, and economies evolve.

Option Trading & Derivatives (F&O) Trading1. What Are Derivatives?
A derivative is a financial contract whose value is derived from an underlying asset. This underlying can be:
Stocks
Indices (Nifty, Bank Nifty)
Commodities
Currencies
Interest rates
Derivatives do not represent ownership of the underlying asset. Instead, they allow traders to speculate on price movements or hedge risks without directly buying the actual asset.
Why derivatives exist:
Hedging (Risk Management):
Businesses and traders use derivatives to protect against adverse price movements.
Speculation:
Traders can predict price moves and earn profits with relatively small capital (leverage).
Arbitrage:
Taking advantage of price differences across markets to generate risk-free returns.
2. What Is F&O Trading?
The F&O (Futures and Options) segment is the derivatives market where futures contracts and option contracts are traded. These instruments are standardized and regulated by exchanges like NSE and BSE in India.
Futures
A future is a contract between two parties to buy or sell the underlying asset at a predetermined price on a future date.
Key features:
Obligation to buy or sell
Mark-to-market settlement daily
High leverage
No upfront premium—margin required
Options
Options are more flexible. Here, the buyer has the right, but not the obligation, to buy or sell the underlying asset at a specific price before expiry.
This structure makes option trading safer for buyers, as maximum loss is limited to the premium paid.
3. What Is Option Trading?
Option trading involves buying or selling option contracts. Options are of two main types:
A. Call Option (CE)
A call option gives the buyer the right to buy the underlying asset at a particular price (strike price).
Used when the trader expects:
Market will go up
Example: If Nifty is at 21,000 and you expect a rise, you may buy a 21,100 CE.
B. Put Option (PE)
A put option gives the buyer the right to sell the underlying asset at a particular price.
Used when the trader expects:
Market will go down
Example: If you expect Nifty to fall from 21,000, you may buy a 20,900 PE.
4. Components of an Option Contract
Understanding option pricing requires knowing its key elements:
1. Strike Price
The price at which the buyer can buy (Call) or sell (Put) the underlying asset.
2. Premium
The cost paid by the buyer to the seller (writer).
Premium depends on volatility, time left to expiry, and price difference from the underlying.
3. Expiry Date
Options expire on a fixed date.
In India:
Index options: Weekly + monthly expiry
Stock options: Monthly expiry only
4. Lot Size
Options are traded in lots, not single shares.
5. Option Buyers vs Option Sellers
Understanding the difference is critical.
Option Buyer (Holder)
Pays premium
Has limited loss
Profit is unlimited (in calls) or high (in puts)
Buyers need strong directional movement.
Option Seller (Writer)
Receives premium
Has limited profit (premium)
Loss can be unlimited
Sellers win when markets stay sideways or move less than expected.
6. Why Do Traders Prefer Options?
1. Limited Risk for Buyers
Even if the market moves drastically against you, the maximum loss is the premium paid.
2. Low Capital Requirement
Compared to futures or stock delivery, options require lesser capital to take large positions.
3. Hedging Tool
Portfolio managers use options to protect investments from downside risk.
4. Flexibility
Options allow strategies for bullish, bearish, or sideways markets.
7. How Options Derive Value — Premium Breakdown
Option premium consists of:
A. Intrinsic Value
The actual value based on the current market price.
B. Time Value
The value of the time remaining before expiry.
Longer duration = higher premium.
C. Volatility Impact
High volatility increases premium as price movement expectations rise.
8. Types of Options Based on Moneyness
1. In-the-Money (ITM)
Call: Strike < Spot
Put: Strike > Spot
These have intrinsic value.
2. At-the-Money (ATM)
Strike price = current market price.
3. Out-of-the-Money (OTM)
Call: Strike > Spot
Put: Strike < Spot
Cheaper but riskier.
9. F&O Trading Strategies Using Options
Options are versatile, enabling a variety of strategies.
1. Directional Strategies
Good for trending markets:
Long Call (Bullish)
Long Put (Bearish)
Call Spread / Put Spread
2. Non-Directional Strategies
Good for sideways markets:
Iron Condor
Short Straddle
Short Strangle
3. Hedging Strategies
Protective Put
Covered Call
Traders select strategies based on volatility, trend strength, and risk appetite.
10. Risks in F&O Trading
Even though options look simple, F&O trading carries significant risks:
1. High Volatility Risk
Unexpected news can move prices sharply.
2. Time Decay Risk
Option buyers lose value each day.
3. Leverage Risk
Small capital controls large positions, increasing both profits and losses.
4. Liquidity Risk
Some stocks in F&O have low volume, making entry/exit difficult.
11. Who Should Trade Options?
Option trading suits:
Traders who understand market direction
Those with small capital
Risk-managed traders
Portfolio investors wanting hedge protection
Advanced traders who use spreads and combinations
However, without knowledge, beginners should avoid naked option selling due to unlimited risk.
12. Role of F&O in the Financial Market
F&O segment plays a crucial role in overall market stability:
1. Risk Transfer Mechanism
Allows shifting risk between participants.
2. Enhances Market Liquidity
More participants → deeper markets.
3. Price Discovery
F&O prices indicate future expectations.
4. Improves Market Efficiency
Arbitrage aligns cash and futures prices.
Conclusion
Option trading and F&O derivatives form the backbone of modern financial markets. They offer traders the ability to hedge risk, speculate with lower capital, and access leverage for higher potential returns. Options, in particular, stand out because they provide flexibility through calls and puts, limited loss for buyers, and strategic combinations that can suit any market condition. However, the power of leverage and complexity also requires strong understanding, disciplined risk management, and strategic execution. For traders who master these skills, the F&O market becomes a powerful tool for generating consistent returns and managing market uncertainty effectively.

PCR Trading Strategies Option Premium
The option premium is the cost of buying an option contract. It is influenced by several factors:
Underlying Price – higher underlying prices increase call premiums and decrease put premiums.
Strike Price – closer the strike price is to current market price, costlier the option.
Time to Expiry – more time means higher premium.
Volatility – higher volatility increases premium as uncertainty rises.
Interest Rates and Dividends – have minor impacts but still contribute.
These factors are modeled using the Black-Scholes model and other pricing techniques.

Premium Chart Patterns Limitations of Chart Patterns
False breakouts are common.
Patterns may be subjective—two traders may interpret them differently.
Market news can disrupt even perfect setups.
Patterns on lower timeframes are less reliable due to noise.
Therefore, traders often combine patterns with:
Moving averages
RSI
MACD
Volume analysis
Market structure
This improves accuracy.

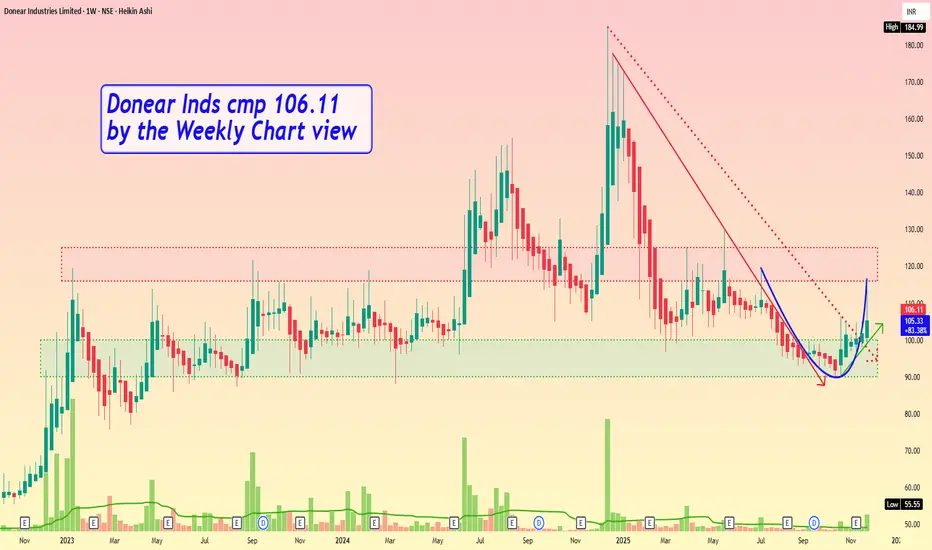
Donear Inds cmp 106.11 by the Weekly Chart viewDonear Inds cmp 106.11 by the Weekly Chart view
- Support Zone 90 to 100 Price Band
- Resistance Zone 116 to 125 Price Band
- Price shouldering along the Rising Support Trendline
- Breakout from Falling Resistance Trendline well sustained
- Bullish Rounding Bottom done by Resistance Zone neckline
- Support Zone tested retested prior to price moved to upscale
- Volumes are intermittently spiking heavily over past few weeks
Part 10 Trade Like Institutions Option Trading in India (NSE)
In India, the National Stock Exchange (NSE) is the largest options market globally in terms of contracts traded.
Features of Indian Options:
Cash-settled for indices (NIFTY, FINNIFTY, BANKNIFTY)
Stock options are physically settled
Weekly expiries every Thursday (for index)
Monthly expiries for stocks
Index options are preferred because they:
Have high liquidity
Offer tight spreads
Enable sophisticated strategies

Part 9 Trading Master ClassRisks in Option Trading
1. High Losses for Option Sellers
Naked call sellers face unlimited loss potential.
2. Time Decay
An option loses value as it approaches expiry.
3. Complex Pricing
Options require understanding of volatility, Greeks, and probability.
4. Liquidity Problems
Illiquid options cause slippage and wide bid-ask spreads.
5. Emotional Trading
Fast-moving markets can cause panic among new traders.

Part 8 Trading Master ClassAdvantages of Option Trading
1. Limited Risk for Buyers
Buying options never risks more than the premium.
2. High Leverage
Small investment can control large quantity.
3. Flexibility
Hundreds of strategies exist.
4. Hedging Power
Investors can protect long-term portfolios.
5. Income Potential
Option writing gives fixed, predictable income.

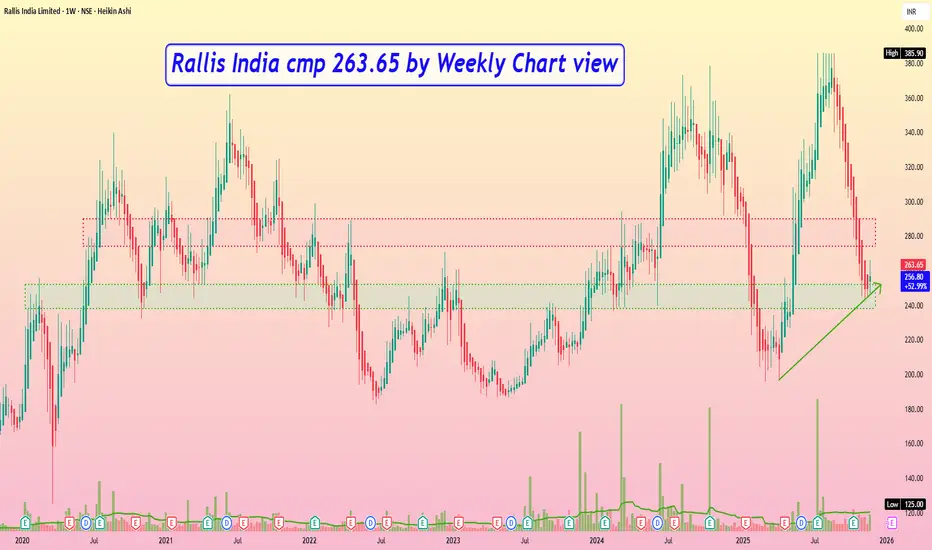
Rallis India cmp 263.65 by Weekly Chart viewRallis India cmp 263.65 by Weekly Chart view
- Support Zone 238 to 252 price Band
- Resistance Zone 274 to 290 price Band
- Stock fell from ATH 385.90 by Bearish Top formation
- Support Zone (since Sept 2014) tested retested for fresh up move
- Volumes below avg traded qty need to increase for upward price movement
Option Chain Analysis1. Understanding the Structure of an Option Chain
An option chain typically has two halves:
Left side → Call Options (CE)
Right side → Put Options (PE)
Each row corresponds to a strike price, and each strike shows several key data points:
Common Columns in CE & PE:
OI (Open Interest) – Total active contracts that are not yet closed.
Change in OI – Shows whether new positions are being built (addition) or squared off (reduction).
Volume – Number of contracts traded during the day.
LTP (Last Traded Price) – Price of the option premium.
Bid/Ask Prices – Best current buy and sell prices.
Implied Volatility (IV) – Market expectation of volatility.
The strike price sits in the center of the table, dividing Call and Put data.
2. Why Option Chain Matters
Option chain analysis allows a trader to:
✓ Identify trend direction
Increasing call writing may suggest bearish sentiment, while heavy put writing may suggest bullish sentiment.
✓ Spot support and resistance
High Put OI indicates strong support.
High Call OI indicates strong resistance.
✓ Understand market liquidity
Higher OI and volume mean more active participation and better entry/exit execution.
✓ Track institutional activity
Big spikes in OI usually represent large participants (FII, proprietary desks).
✓ Predict short-term price movements
Based on the balance between CE and PE data.
3. Key Components of Option Chain Analysis
A. Open Interest (OI)
(Open Interest is the heart of option chain analysis.)
Rising OI + rising price → Long Build-Up
Rising OI + falling price → Short Build-Up
Falling OI + rising price → Short Covering
Falling OI + falling price → Long Unwinding
These combinations provide clues about ongoing market activity.
B. Change in Open Interest
This tells you what is happening today.
Example:
If Put OI is rising fast, traders expect the market to stay above that strike → support.
If Call OI is rising sharply, traders expect resistance at that strike.
C. Option Premium and LTP Movement
Premiums often rise due to:
Trend strength
Increased volatility (IV)
Time remaining to expiry
Premiums collapse due to:
Trend reversal
Drop in IV
Time decay (theta)
D. Implied Volatility (IV)
IV reflects expected movement.
High IV → high uncertainty → expensive options
Low IV → low uncertainty → cheaper options
IV also jumps ahead of major events such as RBI policy, budget, US Fed meetings, elections, etc.
4. Identifying Support & Resistance from Option Chain
This is one of the most practical uses of option chain.
A. Finding Support Levels
Support is identified by:
Highest Put OI
Sharp increase in Put OI
Put writers actively defending a strike
Put writers (sellers) are usually strong hands, so they provide floor/ support.
For example:
If 22,000 PE has the highest OI, then 22,000 becomes strong support.
B. Finding Resistance Levels
Resistance is identified by:
Highest Call OI
Big Call OI additions
CE writers defending a strike
If 22,300 CE has the highest OI, then 22,300 becomes strong resistance.
5. PCR (Put-Call Ratio) Analysis
PCR is a sentiment indicator extracted from the option chain:
PCR = Total Put OI / Total Call OI
Interpretation:
PCR > 1 → bullish sentiment (more puts written)
PCR < 1 → bearish sentiment (more calls written)
PCR around 0.8–1.2 → neutral market
PCR extremes:
Around 1.5–1.8 → overbought (possibility of downtrend soon)
Around 0.5 or lower → oversold (possibility of uptrend)
6. OI and Price Action Combination
Combining price action with OI gives the highest accuracy.
Bullish Signs
Increasing Put OI at lower strikes
Decreasing Call OI
Price closing above major CE writing zones
PCR rising
Bearish Signs
Increasing Call OI at higher strikes
Heavy CE writing above spot
Price closing below major PE supports
PCR declining
Sideways Signals
Both CE and PE addition at surrounding strikes
Narrow PCR near 1.0
Option premiums decaying fast
7. Option Chain Traps and Short Squeezes
Option chain also reveals squeeze situations:
Short Squeeze (Bullish Explosion)
Heavy Call OI begins to unwind
Price breaks above resistance
CE writers forced to exit → premiums rise sharply
Long Liquidation (Bearish Slide)
Heavy Put OI unwinds
Price breaks below support
PE premiums shoot up
These moves are usually fast and violent.
8. How to Use Option Chain for Intraday Trading
Intraday traders use:
A. Change in OI (minute-by-minute)
This reveals immediate momentum.
B. Straddle & Strangle Levels
High combined premium = expected movement range.
C. ATM (At-the-Money) Behavior
If ATM call OI rises → bearish
If ATM put OI rises → bullish
D. Premium Breakout Zones
Sharp change in CE or PE premium suggests a trending move starting.
9. Expiry Day Option Chain Analysis
Expiry days are different because:
Time decay is extreme
OI changes rapidly
Range-bound behavior is common
On expiry:
Highest CE + PE OI combination often predicts the max pain level (where sellers profit the most)
Prices tend to gravitate around this level
10. Max Pain Theory
Max Pain = Strike price where option buyers lose maximum money.
It is calculated from the option chain.
On expiry day, price often moves toward max pain.
11. Option Chain for Swing and Positional Trading
Positional traders use:
Total OI across all strikes
IV trends
Monthly expiry data
Support/resistance based on long-term OI
If Put OI is high for next month → bullish for swing trades.
If Call OI dominates → bearish.
12. Mistakes Traders Make in Option Chain Reading
Only checking OI without price action
Ignoring IV changes
Misinterpreting unwinding phases
Trading without considering broader market events
Following high OI blindly without confirming by price behavior
Option chain should be combined with technical analysis for best results.
13. Practical Example Summary (How a Trader Should Use the Chain)
Identify highest PE OI → support
Identify highest CE OI → resistance
Analyze Change in OI → fresh positions being created
Check PCR → market sentiment
Observe IV → volatility expectations
Track premium movement → strength of buyers or sellers
Combine with price action to confirm trend
Final Thoughts
Option Chain Analysis is a vital skill for traders in index and stock derivatives. It reveals the psychology of option writers, helps identify crucial levels, indicates short-term momentum, and offers insights into market direction. When used properly along with charting tools, it significantly enhances accuracy in intraday, swing, and expiry trading.
Strategy Optimization for Trading 1. Understanding Strategy Optimization
At its core, strategy optimization is about enhancing decision-making frameworks. A strategy—whether in business, finance, or operations—defines how resources are allocated, risks are managed, and objectives are achieved. Optimization involves testing, analyzing, and fine-tuning these strategies to improve performance. It is iterative, data-driven, and involves balancing multiple factors, such as cost, risk, efficiency, and profitability.
For businesses, this may mean optimizing marketing campaigns, supply chain operations, or pricing models. For financial traders, it could involve refining trading algorithms, portfolio allocation, or risk management rules.
2. Key Objectives of Strategy Optimization
The primary objectives of strategy optimization include:
Maximizing Efficiency: Using resources, time, and capital more effectively to achieve objectives with minimal waste.
Minimizing Risk: Identifying and mitigating potential threats that could undermine strategic goals.
Enhancing Returns: Improving financial or operational outcomes by optimizing processes, decisions, and execution.
Adapting to Market Dynamics: Ensuring strategies remain relevant in changing economic, technological, or competitive environments.
Evidence-Based Decisions: Replacing guesswork with insights derived from data analysis, testing, and modeling.
Optimization is not a one-time activity; it is a continuous process that evolves with internal performance metrics and external market conditions.
3. Steps in Strategy Optimization
Strategy optimization involves a structured approach that can be broken down into several steps:
Step 1: Define Objectives
Clearly define the goals of the strategy. Objectives should be SMART—Specific, Measurable, Achievable, Relevant, and Time-bound. For example, a financial trading strategy may aim to maximize annual returns while keeping drawdowns below 10%.
Step 2: Data Collection and Analysis
Gather historical and real-time data relevant to the strategy. For businesses, this could be sales data, customer behavior metrics, or operational performance data. For traders, market price movements, volatility patterns, and macroeconomic indicators are crucial. Analytical tools like statistical models, machine learning, and visualization help identify trends and insights.
Step 3: Develop and Test Scenarios
Model multiple scenarios to evaluate how different strategies perform under varying conditions. Simulation techniques, backtesting (for trading), or A/B testing (for marketing campaigns) are effective ways to understand potential outcomes. Scenario analysis helps identify strengths, weaknesses, and sensitivities in a strategy.
Step 4: Parameter Optimization
Every strategy has parameters that influence its performance. For instance, in trading, parameters could be moving average periods, risk thresholds, or stop-loss levels. Adjusting these parameters systematically using optimization techniques such as grid search, genetic algorithms, or machine learning can significantly improve results.
Step 5: Risk Assessment
Optimization should not come at the expense of risk exposure. Evaluate the potential downsides of each optimized strategy using stress testing, Monte Carlo simulations, or sensitivity analysis. Risk-adjusted performance measures, like the Sharpe ratio in finance, help compare strategies fairly.
Step 6: Implementation
Once an optimized strategy is identified, implement it in a controlled and measurable way. Ensure alignment with organizational goals, stakeholder expectations, and operational capabilities. In trading, this may involve deploying an automated algorithm; in business, rolling out a refined marketing plan or operational process.
Step 7: Monitoring and Feedback
Optimization is iterative. Continuously monitor performance using key performance indicators (KPIs) and feedback loops. Metrics such as ROI, customer acquisition cost, win/loss ratio, or operational efficiency provide insights into whether the strategy is performing as intended. Adjustments should be made based on empirical evidence rather than assumptions.
4. Techniques and Tools for Strategy Optimization
Modern strategy optimization relies heavily on quantitative and qualitative tools:
Quantitative Techniques
Statistical Analysis: Identifying correlations, trends, and anomalies in historical data.
Backtesting: Testing strategies against historical data to measure hypothetical performance.
Monte Carlo Simulation: Modeling the probability of different outcomes in uncertain environments.
Optimization Algorithms: Using algorithms such as gradient descent, genetic algorithms, or particle swarm optimization to find optimal parameters.
Machine Learning Models: Leveraging predictive analytics for pattern recognition, forecasting, and decision-making.
Qualitative Techniques
Scenario Planning: Evaluating how strategies respond to potential market or operational disruptions.
Expert Judgment: Incorporating insights from industry experts or experienced practitioners.
SWOT Analysis: Identifying strengths, weaknesses, opportunities, and threats to refine strategies.
Software Tools
Business Intelligence Platforms: Tableau, Power BI for data visualization and insights.
Statistical Packages: R, Python (Pandas, NumPy, Scikit-learn) for modeling and analytics.
Trading Platforms: MetaTrader, NinjaTrader, or QuantConnect for backtesting and algorithm optimization.
Project Management Tools: Jira, Trello, or Asana for implementing and tracking strategy changes.
5. Best Practices for Effective Optimization
Focus on Core Objectives: Avoid over-optimization, which can lead to unnecessary complexity and diminishing returns.
Balance Risk and Reward: Optimal strategies should maximize performance without exposing the organization to unacceptable risks.
Use Data Wisely: Ensure data quality and relevance. Decisions based on poor or irrelevant data can mislead optimization efforts.
Iterate Continuously: Markets and business environments evolve; regular review and adjustment are critical.
Maintain Flexibility: Build strategies that can adapt to changes rather than rigid, one-size-fits-all approaches.
Document Processes: Maintain clear documentation for reproducibility, transparency, and learning from past outcomes.
6. Common Challenges in Strategy Optimization
Overfitting: Optimizing a strategy too closely to past data can reduce its effectiveness in real-world scenarios.
Incomplete Data: Lack of comprehensive or high-quality data can lead to biased or unreliable optimization.
Changing Market Conditions: Economic shifts, technological disruptions, or competitive pressures can render an optimized strategy obsolete.
Complexity Management: Highly optimized strategies may become too complex to implement or maintain effectively.
Behavioral Biases: Decision-makers may favor certain strategies due to cognitive biases rather than objective performance metrics.
Addressing these challenges requires a combination of rigorous analysis, continuous monitoring, and flexibility in implementation.
7. Applications of Strategy Optimization
Strategy optimization is applied across multiple domains:
Business
Marketing campaign optimization to improve ROI.
Supply chain optimization for cost reduction and efficiency.
Pricing strategies to maximize profitability and market share.
Finance
Portfolio optimization to balance returns and risks.
Trading strategy refinement using algorithmic and quantitative techniques.
Risk management strategies to minimize drawdowns and losses.
Operations
Production planning and resource allocation.
Inventory management and logistics optimization.
Workforce scheduling and efficiency improvements.
Technology
Machine learning model tuning for better predictions.
Software development strategies to optimize release cycles and quality.
IT infrastructure allocation for cost-effective performance.
8. Conclusion
Strategy optimization is a crucial practice for any organization or individual seeking sustainable growth, profitability, and efficiency. By combining data-driven analysis, risk assessment, scenario planning, and continuous monitoring, optimized strategies can significantly improve outcomes. The process requires a balance between ambition and pragmatism, leveraging both quantitative tools and qualitative insights. Ultimately, organizations and traders who master strategy optimization are better positioned to adapt to changing environments, capitalize on opportunities, and achieve long-term success.
Market Rotations in the Indian Stock MarketIntroduction
Market rotation is a concept widely used by investors and traders to understand how different sectors perform at various stages of the economic cycle. It refers to the movement of capital from one sector or asset class to another, often driven by economic trends, interest rate changes, government policies, or global market dynamics. In the Indian context, understanding market rotations is crucial due to the market's sectoral diversity and the influence of both domestic and international factors.
The Indian stock market, represented mainly by indices like the Nifty 50 and BSE Sensex, consists of multiple sectors such as Banking, IT, Pharmaceuticals, FMCG, Energy, Metals, and Infrastructure. Each sector reacts differently to economic conditions, and rotations across these sectors present opportunities for investors to optimize returns and reduce risks.
1. Understanding Market Rotation
Market rotation is essentially about capital flow between sectors. Investors rotate funds based on valuation, growth potential, interest rates, and macroeconomic trends. For example, during economic expansion, cyclical sectors like Banking, Automobiles, and Capital Goods tend to outperform, while defensive sectors like FMCG and Pharmaceuticals are preferred during economic slowdowns.
In India, rotations are influenced by:
Domestic factors: GDP growth, inflation, RBI policy rates, fiscal policies, and political developments.
Global factors: Crude oil prices, global interest rates, foreign institutional investor (FII) flows, and geopolitical risks.
2. Types of Market Rotations
Sector Rotation:
Movement of funds between sectors based on macroeconomic trends. Example: Investors move from IT and Pharma (defensive) to Banking and Auto (cyclical) during economic expansion.
Style Rotation:
Rotation between investment styles such as growth stocks and value stocks, or between large-cap, mid-cap, and small-cap stocks.
Asset Class Rotation:
Movement between different asset classes, e.g., equities to bonds or gold, often triggered by interest rate changes or global uncertainty.
3. Importance of Market Rotations
Understanding market rotations is crucial for multiple reasons:
Maximizing Returns: By following rotation trends, investors can position themselves in sectors likely to outperform.
Risk Management: Rotation helps avoid overexposure to underperforming sectors.
Timing Investments: Helps investors decide when to exit a sector that has peaked and enter one with higher potential.
Portfolio Diversification: Enhances risk-adjusted returns by shifting between cyclical and defensive sectors according to market phases.
4. Economic Cycles and Sector Performance in India
Market rotations often mirror the economic cycle, which can be broadly divided into four phases:
Early Expansion:
Characterized by recovery from recession, rising industrial production, and corporate earnings growth.
Sectors to watch: Capital Goods, Metals, Infrastructure, Auto.
Example: Post-pandemic India (2021-22) saw significant rotation into capital-intensive sectors due to economic revival and government infrastructure push.
Late Expansion:
Economic growth continues, but inflationary pressures increase.
Sectors to watch: Banking, Finance, Consumer Discretionary.
Example: During periods of strong credit growth, NBFCs and private banks often outperform.
Early Contraction / Slowdown:
Economic growth slows; earnings decline; interest rates may rise to control inflation.
Sectors to watch: FMCG, Pharmaceuticals, Utilities.
Reason: Defensive sectors maintain stable cash flows even during slowdown.
Recession:
Economic contraction, high unemployment, low consumption.
Sectors to watch: Gold, FMCG, Pharma.
Reason: Investors move to safe-haven assets and defensive equities.
5. Key Indian Sectors and Their Rotation Patterns
Banking & Financials:
Highly sensitive to interest rate cycles and credit growth.
Outperform during economic expansion and low interest rates.
Rotation cue: RBI policy changes, credit demand, and NPA trends.
IT & Software Services:
Considered defensive due to global revenue streams and recurring contracts.
Perform steadily during slowdowns but may lag during domestic growth surges.
Pharmaceuticals & Healthcare:
Defensive sector; stable revenue even during recessions.
Gains rotation interest during global uncertainty or domestic slowdown.
FMCG & Consumer Staples:
Defensive; high demand regardless of economic cycles.
Attract capital during slowdown and high inflation periods.
Automobile & Capital Goods:
Cyclical; benefit from rising disposable income and industrial demand.
Rotation flows in during early and late expansions.
Energy & Metals:
Sensitive to commodity prices and global demand.
Rotate in when industrial growth accelerates and global commodity prices rise.
6. Drivers of Market Rotation in India
RBI Monetary Policy:
Interest rate hikes often lead to rotation into defensive sectors like FMCG and Pharma.
Rate cuts encourage capital flow into cyclical sectors like Banking and Auto.
Government Policies:
Infrastructure spending or PLI schemes can trigger rotation into Capital Goods, Metals, and Electronics sectors.
Global Events:
Oil price spikes, US Fed rate decisions, and geopolitical risks influence rotations between Energy, IT, and Gold.
Valuation & Earnings:
Overvalued sectors see outflows, while undervalued sectors attract capital.
Investors rotate based on relative performance and P/E ratios.
Foreign Institutional Investor (FII) Flows:
FIIs significantly impact Indian markets. Strong inflows can rotate sectors like Banking, IT, and Pharma, while outflows often trigger a move to safe-haven sectors.
7. Strategies for Investors
Identify Macro Trends:
Track GDP growth, inflation, interest rates, and government policies to anticipate sectoral performance.
Follow Institutional Activity:
Monitor FII and domestic institutional investor (DII) flows to spot potential rotations.
Technical & Fundamental Analysis:
Use charts and valuation metrics to identify sectors or stocks ready for rotation.
Diversification Across Sectors:
Maintain exposure to both cyclical and defensive sectors to reduce risk.
Timing and Discipline:
Avoid chasing momentum; enter sectors early in rotation trends and exit before they peak.
8. Practical Examples of Market Rotation in India
2014-2015: Expansion in infrastructure and capital goods due to government’s Make in India initiative; rotation from defensive sectors to cyclical sectors.
2020-2021: Post-COVID economic recovery saw rotation into IT, Pharma, and FMCG sectors initially, followed by Banking and Auto as domestic demand revived.
2022-2023: Rising interest rates triggered rotation from rate-sensitive Banking to defensive FMCG and Pharma sectors.
9. Challenges in Predicting Rotations
Market Sentiment: Emotional trading can distort rational rotations.
Global Correlations: International shocks (oil, interest rates, geopolitical risks) can abruptly change rotation patterns.
Lag in Economic Data: Market reacts faster than published economic indicators.
Sector Concentration Risks: Over-reliance on one sector can magnify losses if rotation timing is wrong.
10. Conclusion
Market rotation is a powerful concept for Indian investors and traders seeking to maximize returns while managing risk. By understanding economic cycles, sector-specific drivers, and investor behavior, one can anticipate where capital is likely to flow next. In India’s diverse and dynamic market, rotation between defensive and cyclical sectors, as well as across asset classes, provides ample opportunities for disciplined and informed investors.
Successful rotation strategies require macroeconomic awareness, monitoring of institutional flows, valuation analysis, and timing discipline. While no strategy is foolproof, integrating market rotation principles into investment decisions can significantly enhance portfolio performance over time.

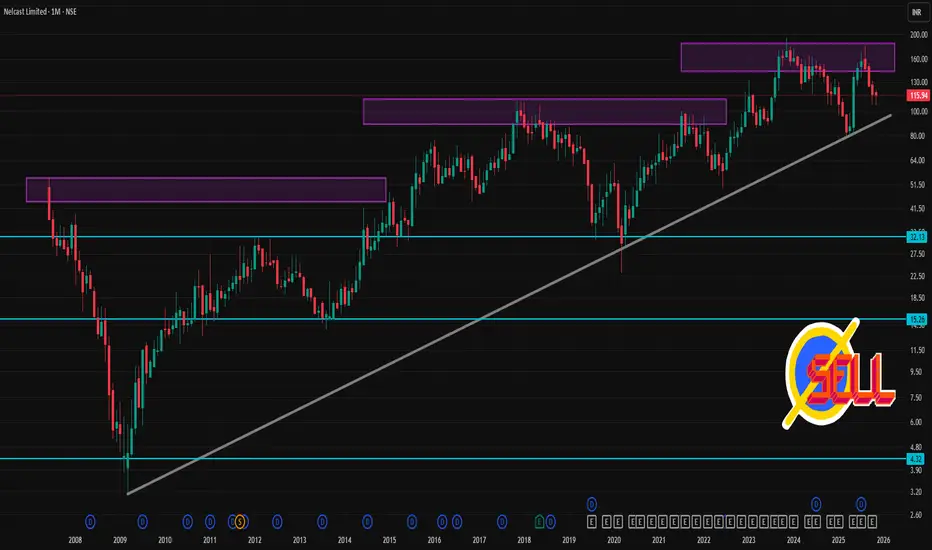
NELCAST 1 Month Time Frame 📌 Recent snapshot
As of 28 Nov 2025, Nelcast closed around ₹116.
Over the past 1 month, the stock has seen a ~ –9 % return.
The 52-week trading range: low ~ ₹78, high ~ ₹180.
✅ My View (with caution)
Nelcast seems fairly valued — perhaps a bit stretched relative to estimated intrinsic value. In short term (1 month), a range between ₹112–₹125 seems the most probable, unless there’s a sharp catalyst (good or bad).
If I were you — and purely for trading or short-term view — I’d watch for a dip toward ₹110–₹112 (as a possible “buy zone / entry”) and a rebound toward ₹124–₹125.
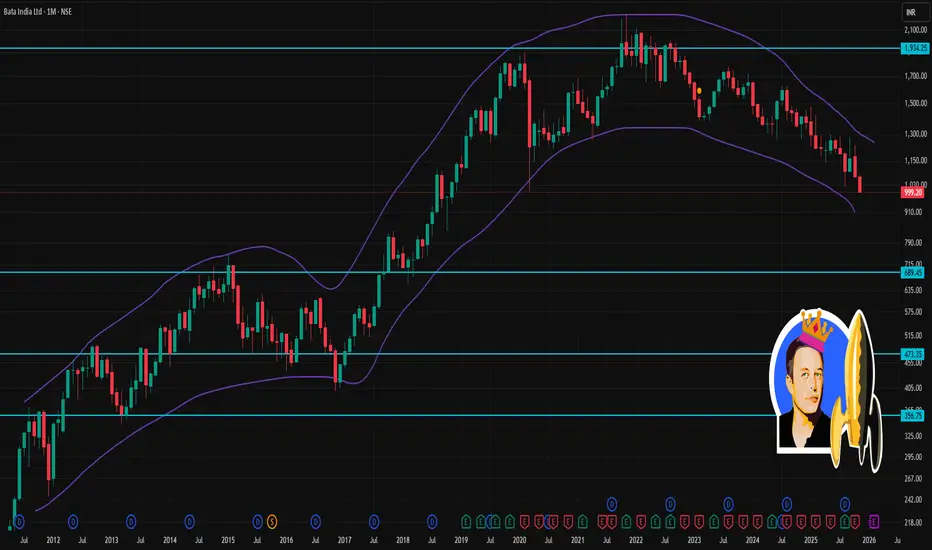
BATAINDIA 1 Month Time Frame 📌 Recent Price & Context
The stock has recently traded around ₹1,000–₹1,010 levels.
The 52-week high is ~₹1,479; 52-week low is ~₹996–₹1,005 (depending on the source) — so recent levels are close to the lower end of the 52-week range.
The stock has been under pressure lately, partly due to weak Q2 FY26 results which dragged sentiment.
⚠️ Key Risks & What’s Dragging the Stock
Weak recent financial performance — recent quarter’s poor results have weighed on sentiment.
Technical picture remains weak: price below all major moving averages, multiple sell signals on daily charts.
High volatility and lack of clarity on demand — any bounce may be shallow unless firm positive triggers come (e.g. good sales data, broader market up-move, sector tailwinds).
Part 4 Learn Institutional TradingParties Involved in an Options Contract
There are two sides to every options contract:
Option Buyer
Pays the premium.
Has limited risk (only the premium paid).
Has unlimited profit potential in call options and significant potential in puts.
Option Seller (Writer)
Receives the premium.
Has limited profit (only the premium collected).
Faces potentially unlimited risk in calls and large risk in puts.
Option sellers generally need higher margin because they take the greater risk.

Part 3 Learn Institutional Trading What Are Options?
An option is a contract that gives the buyer the right, but not the obligation, to buy or sell an underlying asset at a predetermined price—known as the strike price—before or on a specific date called the expiry.
There are two types of options:
Call Option – Gives the right to buy an asset.
Put Option – Gives the right to sell an asset.
The buyer of an option pays a fee called the premium, which is the price of the contract.
In India, stock options follow an American-style exercise, allowing early exercise, while index options are European-style, meaning they can only be exercised on expiry day.

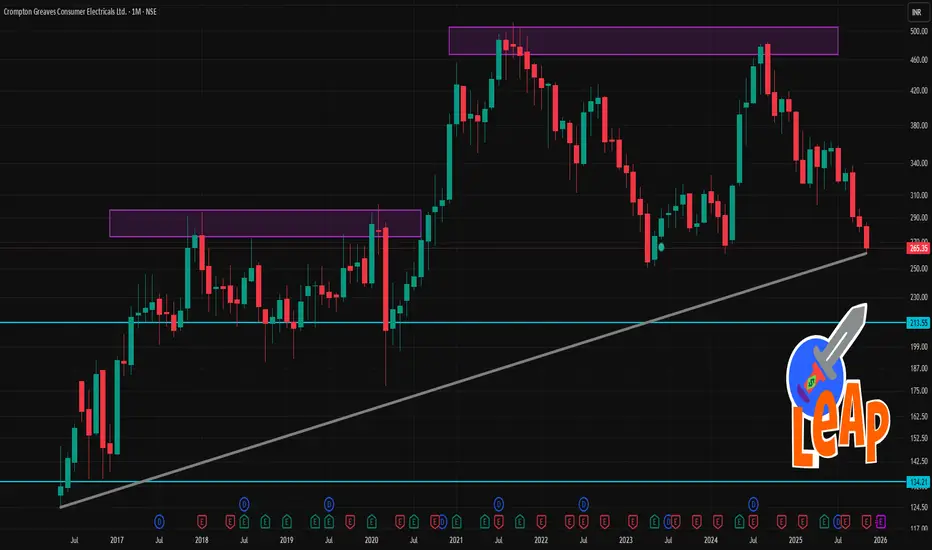
Crompton 1 Month Time Frame 📉 Recent context & background
The stock recently hit a fresh 52-week low — around ₹267.5–₹271.25.
Latest quarter (Q2 Sep-2025) saw a sharp profit drop: net profit fell ~43% YoY, with EBITDA margin under pressure due to commodity cost inflation and restructuring costs.
On the flip side, the company’s broader business mix (like pumps / small domestic appliances / solar-rooftop orders) and some analyst estimates still see potential for recovery.
🧭 What could move the price in next 1 month
Positive triggers: Any signs of margin recovery, easing of commodity inflation, good order wins (e.g. solar-segment orders or domestic appliance demand), supportive news or institutional interest.
Negative triggers: Continuation of margin pressure, weak demand in core categories, negative macro / interest-rate or inflation environment, or broader investor risk-off sentiment.
🎯 My Base-Case 1-Month Scenarios
Bearish to neutral scenario: Price may hover or drift around ₹260–₹285, possibly bouncing between support (₹265–₹270) and resistance (₹280–₹290).
Bullish/recovery scenario: If sentiment improves, stock could aim for ₹300–₹330 over the next 3–4 weeks — especially if company provides encouraging updates or sector environment improves.
Upside breakout scenario (less likely in short 1-month): A push toward ₹340 is possible only if there’s a strong catalyst (e.g., margin rebound, big orders, broadly bullish market) — but that feels optimistic for just 1 month.
Candle Pattern Knowledge Limitations and Best Practices
Candlestick patterns alone should not be used as the only basis for trades. They are best combined with:
Moving averages
RSI or MACD
Support/resistance levels
Volume analysis
Best Practices
Wait for confirmation before entering.
Avoid trading patterns in choppy, sideways markets.
Use stop-losses under key levels.
Combine with market structure for higher accuracy.

Part 2 Ride The Big Moves Option Trading in India (NSE)
Popular tradable contracts:
NIFTY 50 (weekly & monthly expiry)
BANK NIFTY (weekly expiry)
FINNIFTY (weekly expiry)
MIDCAP NIFTY
Stock Options
Lot sizes:
Nifty: 25
Bank Nifty: 15
Finnifty: 40 (subject to change by NSE)
Stock options have higher margins and different lot sizes.
