Traders’ Psychology in Indian Markets1. The Foundation of Trading Psychology
Trading psychology refers to the mindset and emotional framework that shapes how traders think, behave, and make decisions in the market. It includes:
Emotions like fear, greed, hope, and regret
Behavioural biases such as overconfidence or loss aversion
Mental discipline in following strategies
Risk-taking ability and rational thinking
The ability to stay calm under pressure
In India’s fast-moving markets—especially in derivatives where leverage is high—psychology becomes even more important. It is often said that 90% of trading is psychology, and 10% is strategy, because the best strategy fails without disciplined execution.
2. Key Emotional Drivers in Indian Markets
A. Fear
Fear in trading emerges in two forms:
Fear of losing money
New traders in Indian markets often exit trades too early, especially after a small profit, because they are fearful of giving it back. On the flip side, they may hold losing positions for too long due to fear of booking a loss.
Fear of missing out (FOMO)
When indices rise sharply—like Nifty or Bank Nifty during bullish momentum—retail traders chase moves without proper analysis. This leads to poor entries and emotional exits.
B. Greed
Greed pushes traders to:
Overtrade
Increase lot sizes impulsively
Avoid booking profits
Try to “recover” losses quickly
Take trades without setups during high market volatility
Greed is particularly visible during stock rallies, upper circuits, or news-driven moves in Indian markets.
C. Hope
Hope is dangerous in trading. Many Indian traders hold losing positions expecting a reversal that never comes. Especially in futures or options, this behaviour can destroy capital quickly.
Hope is not a strategy; discipline is.
D. Regret
Regret shapes trader behaviour by:
Influencing revenge trading
Causing hesitation in new trades
Creating emotional instability
A trader who missed a move in HDFC Bank or Reliance may jump aggressively into unrelated trades out of frustration.
3. Behavioural Biases Influencing Indian Traders
India’s trading community is heavily influenced by behavioural finance. Some common biases are:
A. Herd Mentality
Retail traders often follow social media tips, TV channels, WhatsApp groups, or Telegram “gurus”. This results in:
Blindly following others
Entering trades without analysis
Impact-driven movements in small-cap/mid-cap stocks
Herd mentality is one of the biggest reasons behind widespread losses.
B. Overconfidence
After a series of winning trades, traders feel invincible. They increase risk, ignore stop-losses, or believe the market will follow their prediction.
Overconfidence particularly hurts option buyers or scalpers in indices.
C. Loss Aversion
Indian traders find it harder to book losses than to book profits. This leads to:
Small profits and big losses
Poor risk–reward ratios
Emotional stress
Loss aversion is the biggest barrier to consistent profitability.
D. Recency Bias
Recent events overly influence decisions. For example:
A breakout stock yesterday → expected breakout today
Yesterday’s trending market → expectation of another trending day
Markets rarely repeat exactly the same behaviour daily.
4. The Unique Indian Market Environment
Indian traders face specific psychological challenges due to:
A. High Retail Participation
Retail traders form a large chunk of volume in Indian derivatives. High participation increases sentiment-driven volatility.
B. Leverage Availability
Futures and options provide leverage, making emotional mistakes more costly.
C. News Sensitivity
Announcements related to:
RBI policy
Government budgets
Corporate earnings
Election outcomes
Global cues (US markets, crude, dollar index)
create sharp, unpredictable intraday spikes causing emotional swings.
D. Social Influence
Many Indian traders engage in trading communities. While community learning is positive, excessive dependence leads to bias and emotional reactions.
5. Psychological Stages of an Indian Trader’s Journey
Stage 1: Excitement and Overtrading
Beginners start with unrealistic expectations. They trade too much, expecting daily income.
Stage 2: Confusion and Losses
After repeated losses, frustration builds. Emotion-based trading increases.
Stage 3: Realization
Traders understand that psychology, risk management, and discipline matter more than strategy.
Stage 4: Discipline and Structure
A mature trader develops:
A trading journal
A fixed system
Consistent risk rules
Emotional stability
Stage 5: Consistency
The trader learns not to force trades and accepts that the goal is consistency, not perfection.
6. How Indian Traders Can Build Strong Psychology
A. Create a Trading Plan
A plan includes:
Instruments to trade
Timeframe
Entry and exit rules
Stop-loss levels
Risk per trade
A written plan removes emotional decision-making.
B. Position Sizing
Keeping risk low per trade reduces psychological pressure. Professional traders risk 0.5%–2% of capital per trade.
C. Practice Patience
Impatience is common in Indian markets, especially in intraday index trading. Patience allows traders to wait for perfect setups rather than jumping into noise.
D. Control Overtrading
Limiting trades per day helps avoid emotional spirals.
E. Accept Losses
Losses are part of the business. Emotionally detaching from losses is key to long-term success.
F. Maintain a Trading Journal
A journal records:
Entry/exit
Reason for trade
Emotions felt
Outcome
Reviewing it helps identify emotional patterns.
G. Meditation & Mindfulness
Many successful traders practice breathing techniques, meditation, or mindfulness to stay calm during market movements.
H. Avoid Tips and Noise
Rejecting social media signals protects traders from herd behaviour and emotional trading.
7. The Mindset of a Successful Indian Trader
A disciplined trader:
Is comfortable with uncertainty
Never chases trades
Controls emotions, not the market
Focuses on risk first, returns second
Follows rules even on losing days
Does not attach ego to market decisions
Trading success comes from mental strength, not from predicting direction.
8. Final Thoughts
Traders’ psychology is the cornerstone of success in Indian markets. While strategies, charts, and indicators are important, they are secondary. The real challenge is managing yourself. Markets consistently test patience, discipline, fear, and greed. Those who master their psychology thrive; those who don’t repeat cycles of emotional trading and losses.
In the Indian trading landscape—full of volatility, leverage, news triggers, and retail activity—the ability to control emotions becomes even more crucial.
Master psychology, and the market becomes a place of growth, consistency, and opportunity.
Trendlineanalysis

Part 1 Support and Resistance What Are Options?
Options are derivative contracts, which means their value is derived from an underlying asset such as stocks, indices, commodities, or currencies. In India, the most traded options revolve around:
Nifty 50
Bank Nifty
FinNifty
Stocks in the F&O list
An option contract gives a trader a right but not an obligation. This is what separates option buyers from option sellers.

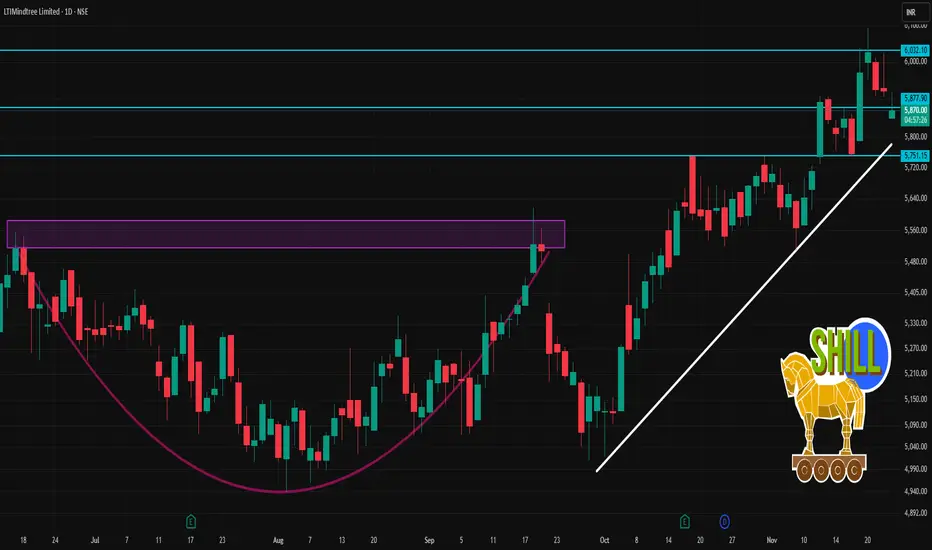
LTIM 1 Day Time Frame 🧮 Key Data Snapshot
Previous close: ~ ₹ 5,922.
Today’s intraday low: ~ ₹ 5,850.
Today’s intraday high: ~ ₹ 5,918.
52-week range: Low ~ ₹ 3,802, High ~ ₹ 6,767.95.
📌 1-Day Technical Levels to Watch
Support levels:
~ ₹ 5,850 — today’s intraday low; if price dips below this it may signal intraday weakness.
~ ₹ 5,760-5,770 — a slightly lower zone (recent intraday “floor” area) that could act as secondary support.
If those break, next meaningful structural support might be closer to ~ ₹ 5,500-5,600 (though further away, so bigger risk).
Resistance levels:
~ ₹ 5,918-5,920 — today’s intraday high; a breakout above this could open upside for the day.
~ ₹ 6,000 — psychological and round number resistance; if momentum pushes, this is the next target.
Above that, near the 52-week high (~₹ 6,767) but that’s more medium-term than for intraday.
🎯 Intraday Trading Scenarios
Bullish intra-day trade: If price holds above ~₹ 5,850 and breaks above ~₹ 5,920 with volume, one could target ~₹ 6,000 or slightly above for the day, with a stop-loss below ~₹ 5,850 (or even ~₹ 5,770 depending on risk tolerance).
Bearish intra-day trade: If price fails to hold ~₹ 5,850, and breaks down with momentum, one could look at a short, targeting ~₹ 5,700 or ~₹ 5,600. Stop-loss would be above ~₹ 5,910 zone.
Range-bound play: If the price continues to oscillate between ~₹ 5,850 and ~₹ 5,920, one might play the range – buy near the lower bound, sell near the upper bound, but keep stops tight.
Part 2 Introduction to Candlestick PatternsImportant Trading Principles in Options
1. Don’t Buy Far OTM Options
They look cheap but rarely become profitable.
Most expire worthless due to Theta decay.
2. Focus on ATM and Slightly ITM Options
They respond better to price movement.
3. If You Are a Beginner, Avoid Selling Options
Sellers need:
high capital
strict hedging
risk management
psychological control
4. Never Trade Without a View
Options need direction OR volatility.
5. Avoid Holding to Expiry Unless Experienced
Expiry movement is very fast, risky, and unpredictable.

Part 12 Trading Master ClassOption Premium and Its Components
The premium is the price you pay to buy an option. Premium has two parts:
A. Intrinsic Value
The real value of the option.
Example:
If Nifty is at 22,000 and you have a Call option of 21,800
Intrinsic value = 22,000 – 21,800 = 200 points
B. Time Value
The extra value due to remaining time to expiry.
As expiry nears, time value decays, and premium falls. This is called Theta Decay.

Part 11 Trading Master Class Why Options Are Popular
Option trading has exploded in popularity due to several advantages:
✔ Lower Capital
You can control a large position with a small premium.
✔ Limited Risk (For Buyers)
You can’t lose more than the premium you paid.
✔ High Reward Potential
Options magnify gains during strong market moves.
✔ Flexibility
You can create strategies for:
bullish markets
bearish markets
range-bound markets
highly volatile markets
extremely calm markets

Part 9 Trading Master Class With Experts What Are Options?
Options are derivative contracts, meaning their value is derived from an underlying asset—most commonly stocks, indices (like Nifty or Bank Nifty), commodities, or currencies.
Every option has two key components:
Strike Price – The agreed price at which the trader can buy or sell the underlying asset.
Expiry Date – The date on which the option contract ends.
Options are of two types:
• Call Option (CE)
A call option gives the buyer the right, but not the obligation, to buy the underlying asset at the strike price before expiry.
You buy a call when you expect price to go up.
• Put Option (PE)
A put option gives the buyer the right, but not the obligation, to sell the asset at the strike price before expiry.
You buy a put when you expect price to fall.
The keyword is right, not an obligation—this makes options different from futures.

IDBI 1 Week TIme Frame ✅ Key Levels
Support zone: ~ ₹99.30 and ~ ₹98.35.
Pivot / neutral price: ~ ₹100.94.
Resistance zone: ~ ₹101.89 and then ~ ₹103.53-₹104.48.
🎯 Watch-for This Week
A break above ~₹101.90 could unlock upside toward ~₹103.50/₹104.50.
A break below ~₹98.35 would signal increased weakness and could target support further down (~₹97 or lower) as per some longer-term charts.
Until one of these pivot points is decisively broken, expect the price to oscillate between ~₹99 and ~₹102.

ULTRACEMCO 1 Week Time Frame ✅ Current picture
1. The stock is trading around ₹11,650-11,700 in the NSE market.
2. Weekly indicators show caution: moving averages (20, 50, 100) are above the current price, signalling short‐term weakness.
3. According to weekly pivot‐levels from Moneycontrol:
Resistance around ₹11,865 – ₹12,115 (Classic)
Support around ₹11,501 – ₹11,365
4. Another source gives near-term support ~ ₹11,684 / ₹11,639 / ₹11,587, pivot ~ ₹11,736, resistance ~ ₹11,781 / ₹11,833.
5. Technically the sentiment is “Sell” on short‐term/higher timeframes: e.g., all major moving averages show “Sell” in investing.com.
6. Weekly MACD and RSI are showing mild bearish or neutral signals.
⚠️ Key caveats
These are purely technical levels for the very short term (≈ 1 week) and assume no major news/shock.
Market, sector (cement) and macro conditions (costs, demand) can sharply change the picture.
Strongest moving averages (100/200) are still significantly higher, signalling a broader weakness in trend.

MARUTI 1 Month Time Frame 📊 Key Metrics
Current price around ₹16,000 region.
One-month return: approximately –2.5% to –3%.
52-week high around ~₹16,660 and low around ~₹10,725.
🔍 Approximate Support & Resistance Levels (1-month timeframe)
From recent charts and technical data:
Immediate resistance: ~ ₹16,172 (R1), then ~ ₹16,368 (R2) and ~ ₹16,585 (R3)
Immediate support: ~ ₹15,759 (S1), then ~ ₹15,542 (S2) and ~ ₹15,346 (S3)
Pivot zone: ~ ₹15,955

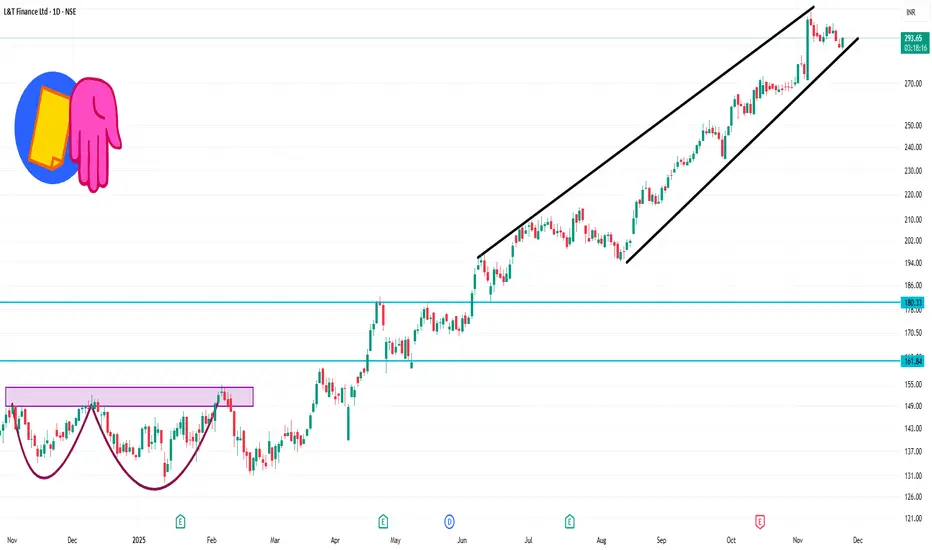
LTF 1 Day Time Frame 📊 Key Price Levels
Current price: ~ ₹ 289–294 per share.
Daily support zone: around ₹ 286–288.
Daily resistance zone: around ₹ 290–295+.
Pivot / central region: ~ ₹ 289.9 (~₹ 290).
✅ What to Watch
If price firmly rises above ~₹ 295, watch for the next resistance near ~₹ 300+ zone.
If price drops below ~₹ 286, support at ~₹ 280 & ~₹ 275 may come into play.
Volume and momentum—if breakout happens with strong volume, the move may have follow-through.
⚠️ Important Caveats
These levels are approximate and based on publicly available data. Market conditions can shift quickly.
Always combine technical levels with fundamentals, news, and broader market conditions.
Trading/investing carries risk—ensure your position size, stop-loss, and strategy align with your risk appetite.
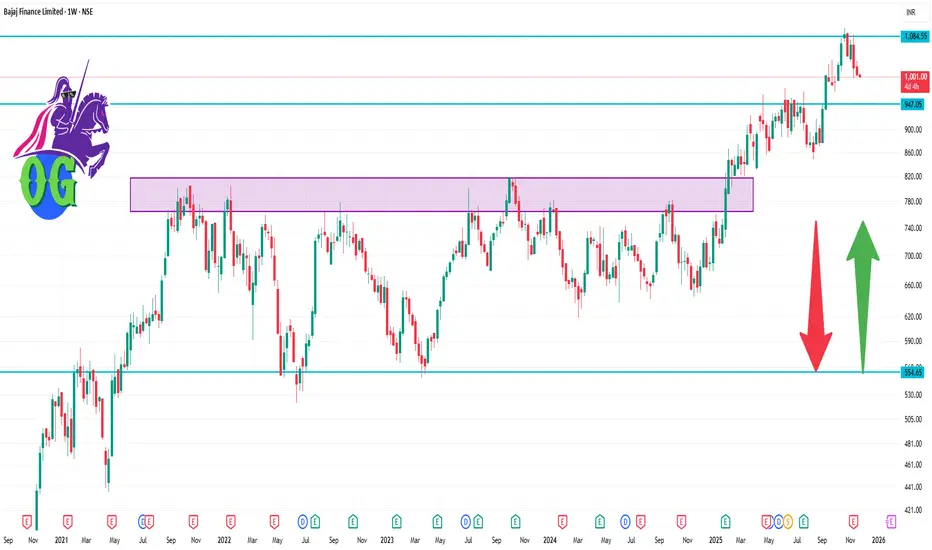
BAJFINANCE 1 Week Time Frame📊 Key Technical Levels
- Current price: ~ ₹1,004 (per Moneycontrol quote)
- Support zone:
~ ₹960-₹970 appears a meaningful near-term support (recent consolidation area)
If breakdown happens, a deeper support around ₹920-₹930 could become relevant
- Resistance zone:
~ ₹1,050-₹1,060 is the first hurdle (recent highs + psychological round number)
A stronger resistance around ₹1,100 (near the 52-week high ~₹1,102.50)
- Range estimate for week:
If neutral: ₹960-₹1,050
If bullish breakout: toward ₹1,100
If bearish breakdown: toward ₹920-₹930 or lower
Advanced-level Chart PatternWhy Chart Patterns Matter
Chart patterns help traders:
Identify trend reversal zones
Recognize trend continuation signals
Determine breakout points
Set entry, stop-loss, and target levels
Understand market behavior and crowd psychology
Most importantly, chart patterns simplify complex market data into visual structures, making decision-making easier.

Unlock India’s Derivatives Power1. The Rise of Derivatives in India
Derivatives—such as futures, options, and swaps—derive their value from underlying assets like stocks, indices, commodities, currencies, and interest rates. India’s derivatives journey began in the early 2000s when SEBI introduced index derivatives to modernize capital markets and reduce speculation in cash segments. Over time, the market matured, attracting domestic retail traders, institutional investors like mutual funds, FPIs, and corporate hedgers.
Today, the Indian derivatives market on the NSE and BSE records billions of dollars worth of contracts daily, with index options (especially Nifty and Bank Nifty) leading global volumes. The democratization of trading platforms, reduction of brokerage costs, and increased financial literacy have further strengthened participation.
2. Why Derivatives Matter for India’s Financial System
Unlocking India’s derivatives power requires recognizing the major roles derivatives play:
a. Risk Management
Derivatives allow traders and businesses to hedge against price volatility in stocks, commodities, interest rates, and currencies.
For example:
A gold importer hedges price movements using MCX gold futures.
A portfolio manager uses Nifty options to guard against market downturns.
This reduces uncertainties in business operations and enhances economic stability.
b. Price Discovery
Futures markets incorporate expectations about future prices, interest rates, demand changes, and macroeconomic events.
For example:
Rising crude oil futures may signal anticipated geopolitical tensions.
Falling index futures may reflect market caution before major policy announcements.
Thus, derivatives become a leading indicator for spot markets.
c. Liquidity Enhancement
The derivatives market trades massive volumes daily, which increases liquidity. High liquidity ensures:
Low transaction costs
Tight bid-ask spreads
Efficient entry and exit
This attracts even more participants, creating a virtuous growth cycle.
d. Leveraged Opportunities
Derivatives allow exposure to large positions with a small margin.
However, leverage is double-edged—working for and against traders. Proper risk discipline is essential.
3. Key Segments Driving India’s Derivatives Strength
a. Equity Derivatives
These dominate India’s markets.
Index Options
Nifty and Bank Nifty options are the backbone of derivatives trading.
Advantages:
Deep liquidity
Lower manipulation risk
Suitable for hedging and speculation
Single Stock Futures and Options
Used heavily by institutional players.
b. Currency Derivatives
India’s growing global trade and foreign investments make currency futures vital for:
Exporters hedging USD/INR or EUR/INR
Importers mitigating forex risk
Traders capturing arbitrage opportunities
c. Commodity Derivatives
MCX, NCDEX, and BEE provide platforms for commodity futures across:
Metals (gold, silver, aluminium)
Energy (crude oil, natural gas)
Agriculture (soybean, cotton, sugar)
This reduces volatility for farmers, industries, and logistics players.
d. Interest Rate Derivatives (IRD)
This segment supports:
Banks
NBFCs
Corporate treasuries
IRD helps stabilize bond markets and strengthen monetary policy transmission.
4. Technological Drivers Unlocking India’s Derivative Power
India’s derivatives boom is heavily powered by technology:
a. High-Speed Trading Platforms
Advanced order-matching engines on NSE and BSE allow microsecond-level execution.
b. Algorithmic and Quant Trading
AI and mathematical models enable:
Auto-trading systems
Statistical arbitrage
Options strategies like iron condors, butterflies, spreads
These bring efficiency and sophistication.
c. Mobile Trading Revolution
Retail participation surged due to:
Zero-commission brokers
Mobile trading apps
Real-time charts and indicators
This democratizes access to derivatives for small investors.
d. Big Data Analytics
Traders now rely on:
Options chain analytics
Market depth
Implied volatility indicators
Open interest interpretation
These help decode market sentiment.
5. How Policy and Regulation Support Derivative Market Growth
a. SEBI’s Robust Regulatory Framework
SEBI ensures transparency, limits manipulation, and protects investors through:
Strict margining systems
Daily settlement
Position limits
Surveillance mechanisms
b. Stock Exchanges’ Risk-Management Systems
NSE and BSE maintain:
Real-time risk monitoring
Market-wide circuit breakers
SPAN and peak margins
These prevent destabilizing events.
c. Government Initiatives
Reforms supporting derivatives growth:
Unified market regulator
Introduction of new derivative products
Increased FPI limits
Commodity market integration with mainstream markets
6. Retail Traders: The New Power in Indian Derivatives
Retail traders now form a major part of index options volume due to:
a. Low Capital Requirements
Options require very low capital at entry compared to futures.
b. Easy-to-use platforms
Everything from charting to algo tools is readily accessible.
c. Increasing financial education
YouTube channels, apps, and online courses fuel interest.
d. Popular intraday strategies
Like:
ATM/OTM straddle-strangle
Trend-following options
Breakout futures trading
Open interest analysis
Retail participation expands market depth and liquidity.
7. Challenges Before India Fully Unlocks Derivatives Power
India must overcome several hurdles:
a. Over-Speculation Risk
Excessive speculation in weekly options can lead to:
High losses for inexperienced traders
Market volatility
b. Low Understanding of Risks
Many traders jump into derivatives without:
Risk management
Position sizing
Stop-loss planning
Education is crucial.
c. Limited Institutional Depth
While retail dominates volume, institutional participation in options is still evolving.
d. Regulatory Overhang
Frequent rule changes (like margin norms) sometimes disrupt traders.
8. The Future: Where India’s Derivatives Market Is Heading
The next decade promises massive growth through:
a. Introduction of New Products
More sectoral index derivatives
Long-term options
Interest rate swaps
Commodity options expansion
b. Retail + Institutional Balance
A healthier mix of FPIs, DIIs, and retail will bring stability.
c. Global Integration
India may become a major derivatives hub like:
Chicago
London
Singapore
d. AI-Driven Derivatives Trading
AI systems will automate:
Strategy generation
Position management
Sentiment analysis
This transforms how derivatives are traded.
Conclusion
Unlocking India’s derivatives power is not just about trading; it is about strengthening the entire financial ecosystem. Derivatives offer tools for hedging, speculation, price discovery, and economic stability. With technological innovation, rising retail participation, strong regulation, and diversified product offerings, India is positioned to become a global leader in derivatives.
For traders, investors, businesses, and policymakers, understanding derivatives is essential for navigating and benefiting from India’s fast-evolving markets. As the country continues to grow economically and digitally, derivatives will play a central role in shaping the next era of financial empowerment.

Trading with Volume1. What is Volume in Trading?
Volume is the total number of shares, contracts, or lots traded in a market during a particular period. Every time a buyer and seller make a transaction, it adds to the volume count.
For example:
If 10,00,000 shares of a stock are bought and sold during a day, that stock’s daily volume is 10 lakh.
If Bitcoin has 50,000 transactions in a 1-hour timeframe, that is its hourly volume.
Volume acts as the pulse of the market. When market participants are active, volume increases. When they lose interest, volume shrinks.
2. Why is Volume Important for Traders?
Volume helps traders answer critical questions:
a. Is the trend strong or weak?
A price trend supported by high volume is considered trustworthy. A trend on low volume is often weak and may collapse.
b. Is the breakout real or fake?
Strong volume during breakouts confirms genuine market interest. Low-volume breakouts often fail.
c. Is a reversal coming?
Volume spikes at tops or bottoms often indicate exhaustion and potential reversal.
d. Where are big players active?
Institutional traders like banks, funds, and smart money leave “footprints” through volume surges.
Thus, volume is a confirmation tool that helps traders avoid traps and make informed decisions.
3. Understanding Volume in Different Market Conditions
a. Volume in Uptrends
When volume rises along with price, the uptrend is considered healthy. Buyers are active and willing to buy at higher levels.
Signs of strong uptrend:
Price ↑ and Volume ↑ → Strong bullish trend
Pullback with low volume → Healthy correction
Signs of weakening uptrend:
Price ↑ but Volume ↓ → Weak trend, risk of reversal
b. Volume in Downtrends
In downtrends, high volume indicates strong selling pressure.
Strong downtrend signals:
Price ↓ and Volume ↑ → Strong bearish trend
Pullback with low volume → Continuation likely
Weak downtrend signals:
Price ↓ but Volume ↓ → Bear trend losing strength
c. Volume in Ranging Markets
In sideways markets, volume generally remains low. A sudden volume spike during range breakout signals trend formation.
4. How to Use Volume for Trading – Practical Techniques
Technique 1: Volume Breakout Trading
Breakouts are powerful signals but also come with fake moves. Volume confirms the authenticity.
Bullish breakout confirmation:
Price breaks resistance
Volume rises above average
Candle closes above breakout level
Bearish breakout confirmation:
Price breaks support
Volume spikes downward
Close is below the support level
Without volume confirmation, breakouts often fail and trap traders.
Technique 2: Volume Divergence
Divergence occurs when price and volume move opposite.
Examples:
Price making higher highs but volume making lower highs → Bullish trend weakening
Price making lower lows but volume decreasing → Bearish trend weakening
Such divergence often signals trend reversal.
Technique 3: Volume Spike Analysis
Sudden large volume spikes can mean:
A big player entering or exiting a position
Market turning point
Start of strong trend
At market bottoms, huge buying volume often appears. At tops, big selling volume may signal reversal.
Technique 4: Using Volume with Indicators
Some popular volume-based indicators:
a. Volume Moving Average (VMA)
Shows average volume to identify when current volume is unusually high or low.
b. On-Balance Volume (OBV)
Adds volume on up days, subtracts on down days to show accumulation/distribution.
c. Volume Weighted Average Price (VWAP)
Used by institutional traders; shows average price weighted by volume.
d. Money Flow Index (MFI)
Combines price and volume to detect overbought/oversold zones.
Using these indicators with price action increases trading accuracy.
5. Volume and Candlestick Patterns
Volume adds strength to candlestick signals.
Examples:
Bullish engulfing with high volume → Strong reversal
Hammer with high volume at support → Buyers entering
Doji with high volume → Indecision among big players
Volume validates candlestick reliability.
6. Volume and Support/Resistance Levels
Support and resistance zones are crucial. Volume helps confirm their strength.
At Support:
Price touches support with low volume → Support likely to hold
Price breaks support with high volume → Strong breakdown
At Resistance:
Price hits resistance with low volume → Resistance holding
Breaks resistance with high volume → Breakout confirmed
Volume acts as the deciding factor in whether levels hold or break.
7. How Smart Money Uses Volume
Institutional traders use volume to accumulate or distribute positions quietly.
Accumulation phase:
Price stays in range
Volume gradually increases
No big price movement
This indicates smart money buying.
Distribution phase:
Price stops rising
Volume spikes at peaks
Smart money selling to retail traders
Recognizing these phases helps traders identify big trends early.
8. Common Mistakes Traders Make with Volume
a. Believing every volume spike means breakout
Volume should be analyzed with price action, not in isolation.
b. Ignoring trend context
High volume in a range is meaningless unless combined with price breakout.
c. Misreading low-volume pullbacks
These are actually healthy for trends, not signs of weakness.
d. Trading without confirming volume
Entering trades based on price alone increases risk.
9. Best Practices for Volume Trading
Compare volume with average volume, not previous candles
Combine volume with trendlines, levels, and patterns
Avoid trading false breakouts without volume confirmation
Watch volume at key supports/resistances
Use volume indicators only as a supplement
Focus on multi-timeframe volume behavior
These practices significantly improve trading accuracy.
Conclusion
Trading with volume gives traders an edge by revealing the hidden strength behind price movements. Volume confirms trends, validates breakouts, identifies reversals, and exposes the actions of big players. When used correctly with price action, support/resistance, and technical indicators, volume becomes one of the most reliable tools in trading. For both beginners and advanced traders, mastering volume analysis is essential for smart, confident, and profitable trading decisions.
Consumption Trends Unveiled1. Digital-First Consumer Behavior
One of the most significant modern trends is the shift toward digital-first consumption. With widespread internet accessibility and smartphone use, consumers increasingly prefer online channels for shopping, content consumption, financial transactions, and communication.
E-commerce has become a dominant retail model. Consumers now expect convenience, instant access to products, and seamless delivery systems. Online marketplaces are expanding rapidly due to personalized recommendations, competitive pricing, and wider product varieties. Additionally, social commerce—shopping directly through social media platforms—is gaining momentum, especially among younger generations who trust peer reviews and influencer endorsements.
Beyond retail, digital consumption includes streaming platforms for entertainment, digital banking, telemedicine, and online education. Every sector is witnessing a digital transformation as consumers adopt technology for efficiency, comfort, and lower costs.
2. Personalization and Customization
Modern consumers crave personalization. They want experiences, products, and services tailored specifically to their preferences. This trend is driven by AI-powered recommendation engines, data-driven marketing, and a deeper understanding of customer behavior.
Companies are using analytics to segment consumers based on browsing patterns, purchase history, lifestyle choices, and social media behavior. Personalized subscription boxes, curated shopping experiences, customized nutrition plans, and smart home devices that learn user habits are prime examples.
Moreover, consumers are increasingly involved in the creation process. Brands that offer customizable options—such as personalized shoes, tailored skincare, or adjustable meal plans—gain a competitive edge. Personalization not only enhances customer satisfaction but also builds strong brand loyalty.
3. Sustainability and Conscious Consumption
Environmental awareness is reshaping global consumption patterns. Today’s consumers, particularly Millennials and Gen Z, are more conscious of climate change, resource scarcity, and environmental impact. This has led to the rise of eco-friendly products, sustainable packaging, and ethical manufacturing.
Consumers prefer brands that adopt green practices, source responsibly, and maintain transparency in their supply chains. The shift toward plant-based foods, renewable energy products, slow fashion, and biodegradable items reflects this growing eco-conscious mindset.
Secondhand marketplaces, recycling initiatives, and circular economy models (where products are reused, refurbished, or recycled) are also becoming mainstream. As sustainability influences purchasing decisions, companies must adapt to remain relevant and trustworthy.
4. Health, Wellness, and Holistic Living
Health and wellness have evolved from niche trends to global consumption drivers. Consumers increasingly prioritize physical fitness, mental well-being, and preventive healthcare. This shift accelerated due to the pandemic, which heightened awareness of health risks.
Demand for nutrition-rich foods, organic products, immunity-boosting supplements, and wellness services has surged. Fitness apps, wearable devices, and virtual workout platforms have gained popularity due to convenience and personalization.
Mental health has also emerged as a key focus, with consumers seeking mindfulness apps, relaxation products, therapy services, and work-life balance solutions. The wellness economy has expanded to include sleep technology, ergonomic home products, and wellness tourism.
5. Experience-Driven Consumption
Another major trend is the shift from product ownership to experience-driven consumption. Consumers now value memorable experiences—travel, entertainment, dining, adventure, and cultural activities—over material possessions.
The “experience economy” is thriving:
Travel and tourism industries focus on curated, immersive experiences.
Restaurants emphasize unique concepts and ambiance.
Events, festivals, and pop-up activities attract large audiences.
Virtual reality and augmented reality are creating new entertainment formats.
Younger consumers especially prioritize experiences that reflect self-expression and social identity. Sharing experiences online amplifies this trend, as people seek activities that are “social media worthy.”
6. Rise of Subscription-Based Models
Subscription services have grown exponentially across various industries. Consumers prefer ongoing access over one-time purchases because subscriptions offer convenience, value, and regular upgrades.
Popular examples include:
Streaming platforms like Netflix and Spotify
Subscription boxes for beauty, fashion, and fitness
Cloud storage and software services
Meal kits and grocery subscriptions
Auto-subscription for household essentials
Businesses benefit from predictable revenue streams, while consumers enjoy flexibility, personalization, and frequent content or product updates.
7. Other Emerging Trends
The Sharing Economy
Consumers increasingly participate in shared consumption models, such as ride-sharing, coworking spaces, community rentals, and shared mobility solutions. This trend reduces ownership costs and supports sustainability.
Localism and Hyper-Localization
Many consumers prefer locally produced goods due to their freshness, authenticity, and community support. Pandemic-driven supply chain disruptions accelerated this trend.
Financial Consciousness
Economic uncertainty has made consumers more value-driven. They seek discounts, compare prices across platforms, and prioritize financial planning tools. Buy Now Pay Later (BNPL) services, digital wallets, and micro-investing platforms are growing.
8. Drivers Behind Changing Consumption Patterns
Several key forces are influencing modern consumption trends:
Technological Advancements
AI, machine learning, IoT, and big data have transformed how businesses understand and target consumers.
Demographic Shifts
A younger, tech-savvy generation is reshaping consumption priorities, while aging populations create demand for healthcare services and age-friendly products.
Globalization
Consumers have access to global brands, ideas, and experiences, leading to diverse preferences.
Socioeconomic Changes
Rising incomes in developing nations and middle-class expansion influence spending power and lifestyle aspirations.
Cultural Evolution
Social media, global trends, and peer influence redefine consumption norms and expectations.
9. Implications for Businesses and Markets
Understanding consumption trends is critical for companies to stay competitive. Businesses must:
Adopt digital-first strategies
Enhance personalization efforts
Focus on sustainability
Innovate new customer experiences
Strengthen e-commerce capabilities
Build trust through transparency
Offer flexible subscription or hybrid models
Companies that fail to recognize these changes risk losing relevance in an economy driven by dynamic consumer expectations.
Conclusion
Consumption trends today are shaped by a combination of technology, demographics, values, and global economic shifts. As consumers evolve, businesses must rethink their strategies, products, and services to meet emerging demands. The future will belong to organizations that understand their customers deeply, innovate continuously, and prioritize sustainability, personalization, and digital transformation.
XAUUSD – ACCUMULATION TRIANGLE ON D1💛 XAUUSD – ACCUMULATION TRIANGLE ON D1, AWAITING A NEW BREAKOUT THIS WEEK 🎯
🌤 Overview of the New Week
Hello everyone, Lana here 💬
Gold, after a very strong rise from the 3,500 region to above 4,400, is entering a "resting" phase on the D1 frame: the price continuously tests the upward trendline but has not yet broken it to confirm a downtrend.
The market is clearly waiting for a real breakout before forming a new medium-term wave.
Next week, we have CPI and PPI – important inflation data that could act as a catalyst to push gold out of the current accumulation zone.
💹 Technical Analysis (Daily Triangle)
On the D1 frame, when connecting the descending peaks and ascending bottoms, gold is in a narrowing triangle pattern.
The upward trendline below is still maintained, indicating that the medium-term trend has not reversed.
Below are important zones:
≈ 3,890: if the price closes below this area, it could confirm medium-term weakening.
Fibonacci & psychological resistance zone 3,800–3,900: strong support, confluence with old price structure.
POC Volume Profile around 3,650: if a deep decline scenario occurs, this will be the next price attraction zone.
Above, the old peak zone around 4,300–4,400 remains a large liquidity zone, a natural target if gold breaks the upper edge of the triangle.
In summary: the more compressed the triangle, the stronger the breakout – the direction will depend heavily on CPI/PPI data & Fed expectations.
🎯 Reference Trading Plan (Medium-Term)
💖 Scenario 1 – Maintain Uptrend (priority when the trendline is not broken)
Observe the reaction at the D1 upward trendline (area around 4,000).
If the price continuously bounces from the trendline and stays above the 3,890 area, you can:
Prioritize buying according to the trend at support retests on H4–H1.
Medium-term targets: 4,150 → 4,250 → 4,300–4,400 if the triangle breaks upwards.
💢 Scenario 2 – Triangle Breaks, Shifts to Medium-Term Decline
If D1 closes below 3,890:
Consider this a signal confirming medium-term weakening.
Prioritize selling at newly formed resistance zones.
Step-by-step targets: 3,800 → 3,700 (POC) → 3,500 (strong previous support).
In both scenarios, specific entry points should be refined on smaller frames (H4, H1) based on price action/OB/FVG.
⚠️ Note News & Risk Management
Next week's CPI & PPI could be the "final blow," pushing gold out of the triangle – volatility can be wide and fast, spreads may widen.
Last week's NFP news hardly created big waves for gold after the US government shutdown, indicating the market is holding strength waiting for more important data.
🌷 Conclusion & Interaction with LanaM2
Gold on D1 is in the final stage of the accumulation triangle – this is a time where patient observation is as important as a beautiful entry point 💛
Next week, I will continue to update daily details on smaller frames so everyone can have more specific entry points.

Smart Money Secrets1. The Psychology Behind Smart Money Movement
Smart money rarely buys at the top or sells at the bottom. Instead, institutions accumulate positions slowly during periods of low volatility and distribute them quietly near tops. The retail crowd does the opposite—buy at tops out of fear of missing out (FOMO) and sell at bottoms due to panic.
Institutions exploit this behavior by:
Creating liquidity traps
Triggering stop-loss hunts
Pushing the price into zones where retail traders enter in the wrong direction
Fading false breakouts
Their goal is simple: buy from emotional sellers, and sell to emotional buyers.
Understanding this psychology is crucial because following smart money usually leads to high-probability trades, while following retail noise often leads to losses.
2. Liquidity: The Fuel of Smart Money
A core smart money secret is that price moves where liquidity exists, not where emotions point. Liquidity refers to regions where many orders are present—like stop losses, pending orders, and institutional blocks.
Smart money actively targets:
Stop loss clusters
Liquidity pools above swing highs
Liquidity pools below swing lows
Areas of imbalance and inefficiency
Example:
When many retail traders place stop losses below a support level, institutions may deliberately push the price below that level to trigger those stops, collect liquidity, and then reverse the price upward.
This phenomenon is called a liquidity grab.
3. Market Structure and Smart Money
Institutions trade based on market structure, not indicators. They analyze:
Higher highs and higher lows
Break of structure (BOS)
Change of character (CHoCH)
Fair value gaps (FVG)
Order blocks (OB)
When smart money wants to reverse a trend, they leave signals through these structural changes. Traders who understand the smart money model (SMM) can identify early trend reversals long before retail indicators show them.
4. Order Blocks – Smart Money Entry Zones
An order block represents a candle or zone where institutions placed significant buy or sell orders. After these zones are formed, price often returns to them to “mitigate” or rebalance institutional positions.
Types of order blocks:
Bullish Order Block: Last down candle before an upward expansion
Bearish Order Block: Last up candle before a downward expansion
When price returns to an order block:
Institutions re-enter or add to positions
High-probability trades form
Retail traders are often on the wrong side
Order blocks are one of the strongest smart money signals for entries.
5. Fair Value Gaps – Imbalances in Price
Smart money often causes rapid price moves that leave gaps between candles. These are called Fair Value Gaps (FVGs) or imbalance zones.
Why they form:
Large institutions place massive orders
Market doesn’t have enough liquidity to fill all levels
Price “jumps” leaving an imbalance
Smart money expects price to return to fill these gaps because they represent inefficiencies in the market. Traders use these zones for entry confirmations and profit targets.
6. Stop Hunts and Liquidity Sweeps
One of the biggest secrets in smart money behavior is stop hunting—a deliberate attempt to trigger retail stop losses.
Reasons for stop hunts:
To collect liquidity for institutional entries
To trap retail traders in the wrong direction
To create volatility before the actual move
Common patterns:
Price dips below a major support and shoots up
Price wicks above a resistance and falls sharply
Long wick candles near order blocks
Retail traders often perceive these as breakouts, but smart money uses them for liquidity collection.
7. Inducement – The Trap Before the Real Move
Inducement is a clever technique used by smart money to lure traders into false setups.
Example:
Price approaches a resistance level multiple times, making retail traders think a breakout is coming. Just before the real move happens:
Price sweeps the liquidity above resistance
Then reverses back into smart money’s direction
Inducement helps institutions create liquidity for their own trades.
8. Volume as a Smart Money Indicator
While price can be manipulated, volume rarely lies. Smart money activity is marked by:
High-volume candles at turning points
Volume spikes during liquidity sweeps
Decreasing volume during pullbacks (institutional accumulation)
Volume Profile and VWAP are tools many traders use to detect institutional footprints.
9. Smart Money and Algorithmic Trading
Modern smart money behavior is driven by algorithms operated by major institutions. These algorithms:
Scan liquidity zones
Execute orders at optimal prices
Analyze price inefficiencies
Prevent slippage
Algorithms follow rules based on order flow, not indicators. This is why price often moves in patterns consistent with smart money concepts, such as BOS, CHoCH, FVGs, and OB mitigations.
10. How Retail Traders Can Use Smart Money Secrets
To trade like smart money, retail traders should:
1. Follow Liquidity, Not Emotions
Identify where liquidity rests:
Equal highs
Equal lows
Swing points
Consolidation zones
These are areas institutions target.
2. Identify BOS and CHoCH
Break of structure reveals trend continuation.
Change of character signals trend reversal.
3. Use Order Blocks and FVGs for Entries
These are high-probability institutional zones.
4. Avoid Trading Breakouts Blindly
Most breakouts are manipulations. Wait for liquidity sweeps.
5. Understand Timing
Smart money moves often occur during:
London Session Open
New York Session Open
Major economic news
Avoid trading in the dead zones between sessions.
6. Stop Using Too Many Indicators
Indicators lag behind price. Smart money trades price action and liquidity.
11. Why Smart Money Secrets Matter
Following smart money helps traders:
Avoid bull and bear traps
Enter trades at institutional pricing
Improve risk-reward ratios
Understand why price moves
Gain confidence through structure-based trading
Instead of being manipulated by market makers, traders learn to trade with them.
Conclusion
Smart money secrets revolve around understanding how institutions operate—where they enter, where they exit, and how they manipulate liquidity. By analyzing market structure, order blocks, liquidity zones, BOS/CHoCH signals, and fair value gaps, traders gain deep insight into true market behavior. While retail traders often trade based on indicators and emotions, smart money trades based on liquidity and structure. Learning these principles allows any trader to align with institutional order flow, trade high-probability setups, and avoid common retail pitfalls.
Mastering Technical Analysis1. What Is Technical Analysis?
Technical analysis is a method of forecasting market movement by studying price charts, trading volume, indicators, and patterns. Unlike fundamental analysis—which focuses on earnings, economic data, and intrinsic value—TA assumes that all information is already reflected in the price.
At its core, technical analysis is built on three key assumptions:
1. Market action discounts everything
Every factor—economic data, news, global events—gets absorbed into price.
2. Prices move in trends
Markets do not move randomly. They follow identifiable patterns: uptrends, downtrends, or sideways ranges.
3. History repeats itself
Human behavior, fear and greed, and market psychology create recurring patterns.
These principles allow traders to anticipate moves with probability, not certainty.
2. Understanding Price Structure
a. Dow Theory Basics
Dow Theory forms the foundation of technical analysis:
Market moves in three trends: primary (major), secondary (pullbacks), and minor (small fluctuations).
Trends stay in effect until clear reversal signals appear.
Volume confirms price movement.
b. Market Trends
A trend is the direction in which prices move.
Uptrend: Higher highs (HH) + higher lows (HL)
Downtrend: Lower highs (LH) + lower lows (LL)
Sideways/Range: Price oscillates between support and resistance.
Identifying trends early is one of the biggest advantages for traders.
3. Key Elements of Technical Analysis
a. Support and Resistance
Support is a price level where buying interest dominates. Resistance is where selling pressure appears.
These levels help traders:
Time entries
Set targets
Place stop losses
Breakouts and breakdowns from these levels often indicate major moves.
b. Trendlines and Channels
Trendlines connect the lows in an uptrend and highs in a downtrend. When combined with parallel lines, they form channels, showing strong directional movement.
A break of a trendline often signals trend reversal.
c. Chart Patterns
Patterns form when price movements create recognizable shapes on charts.
Reversal Patterns:
Head and Shoulders
Inverse Head and Shoulders
Double Top / Double Bottom
Triple Tops / Bottoms
Continuation Patterns:
Flags
Pennants
Triangles
Rectangles
Chart patterns reflect collective market psychology and help forecast future direction.
4. Candlestick Patterns
Candlestick charts reveal the emotional story of buyers and sellers. Some common patterns include:
Bullish Patterns:
Hammer
Bullish Engulfing
Morning Star
Piercing Line
Bearish Patterns:
Shooting Star
Bearish Engulfing
Evening Star
Dark Cloud Cover
Combining candlestick signals with support/resistance improves accuracy.
5. Technical Indicators and Oscillators
Indicators help interpret market momentum, strength, and volatility. Although no indicator is perfect, combining a few well-selected ones enhances decision-making.
a. Moving Averages
They smooth out price movement to reveal trends.
Types:
SMA (Simple Moving Average)
EMA (Exponential Moving Average)
Common strategies:
Golden Cross (50-MA above 200-MA)
Death Cross (50-MA below 200-MA)
EMA-based trend trading
b. RSI (Relative Strength Index)
RSI measures momentum and identifies overbought (>70) and oversold (<30) conditions. It also signals divergences, which often precede reversals.
c. MACD (Moving Average Convergence Divergence)
MACD shows the relationship between two EMAs. Signals include:
Bullish or bearish crossovers
Histogram direction
Divergences
d. Bollinger Bands
These measure volatility. Price touching the upper band suggests overbought conditions; touching the lower band suggests oversold conditions. Squeezes indicate big upcoming moves.
e. Volume Indicators
Volume is essential for confirming trends.
Rising price + rising volume = strong trend
Rising price + low volume = weak trend
6. Multi-Time Frame (MTF) Analysis
Professional traders analyze charts across multiple time frames. For example:
Higher time frames (1D, 1W) show the major trend.
Lower time frames (1H, 15m) show entry opportunities.
A trade is strongest when trends align on multiple time scales.
7. Breakout and Breakdown Trading
Breakouts occur when price moves above resistance with strong volume. Breakdowns occur when price falls below support.
Successful breakout trading requires:
Volume confirmation
Retest of breakout zones
Avoiding false breakouts
8. Risk Management and Position Sizing
Mastering technical analysis is not just about reading charts. The biggest key is managing risk.
Essential rules:
Always use a stop loss
Do not risk more than 1–2% of capital per trade
Use risk-reward ratios (e.g., 1:2 or 1:3)
Trade with discipline, not emotion
Good risk management keeps you in the game long enough to experience compounding success.
9. Trading Psychology
Technical analysis is 30% charts and 70% psychology. Recognize these emotional traps:
Fear of missing out (FOMO)
Overconfidence after profit
Revenge trading after loss
Impatience and overtrading
A disciplined trader follows rules and trusts their strategy.
10. Creating Your Own Trading System
To master technical analysis, create a structured trading system:
Components of a strong system:
Market selection (stocks, indices, crypto)
Time frame (intraday, swing, positional)
Indicators (2–3 maximum)
Entry rules (breakout, pullback, pattern)
Exit rules (target, trailing stop)
Risk-reward ratios
Backtesting to validate performance
A system removes emotional decision-making and boosts consistency.
11. Combining Technical and Fundamental Analysis
While TA is powerful, combining it with fundamental catalysts—earnings, macro trends, sector strength—creates high-probability setups. For example:
Volume breakout + strong quarterly results
Trend continuation + positive economic news
This hybrid approach is used by many successful traders.
12. The Path to Mastery
Technical analysis mastery does not come overnight. It requires:
Chart practice
Backtesting historical data
Studying past cycles
Recording trades in a journal
Reviewing mistakes and refining rules
Over time, patterns become clear, and intuition develops.
Conclusion
Mastering technical analysis is a journey of learning price behavior, practicing chart reading, and developing psychological discipline. By understanding trends, patterns, indicators, and risk management, traders gain the ability to anticipate market moves with greater confidence. TA does not guarantee profits—it improves probabilities. Combined with discipline, patience, and a structured approach, it becomes a powerful skill that can transform your trading performance.

Public Sector Banks in the Trading Market1. What Are Public Sector Banks?
Public Sector Banks are commercial banks where the Government of India holds majority ownership, usually above 51%. These banks operate under government oversight and play a vital role in:
Mobilizing public savings
Lending to priority sectors
Executing government welfare schemes
Providing financial inclusion
Supporting economic stability
Some major PSBs include:
State Bank of India (SBI) – India’s largest bank
Bank of Baroda (BoB)
Punjab National Bank (PNB)
Canara Bank
Union Bank of India
Indian Bank
Bank of India (BoI)
UCO Bank, Bank of Maharashtra, Central Bank of India, etc.
These banks collectively hold nearly two-thirds of India’s banking assets, giving them huge influence in stock market behaviour.
2. Importance of PSBs in the Trading Market
a) High Liquidity and Trading Volumes
PSB stocks like SBI, BoB, and PNB consistently appear in the NSE’s most-traded list, making them attractive for:
Intraday traders
Swing traders
Options traders
Institutional investors
Liquidity ensures narrower spreads, faster order execution, and stable price discovery.
b) Macro Indicators
PSBs reflect the health of:
Credit growth in the economy
Corporate borrowing trends
Housing and retail loan demand
Government capital expenditure
Stress in sectors like MSME or agriculture
Thus, traders use PSB performance to gauge broader market trends.
c) Interest Rate Impact
Bank profitability is heavily dependent on the interest rate cycle.
Rising rates → higher net interest margin (NIM) → PSBs rally
Falling rates → lower margins → PSBs correct
Therefore, PSB stocks move quickly after:
RBI monetary policy
Inflation data
Government bond yield changes
This makes them ideal for event-based trading.
3. How Public Sector Bank Stocks Behave
PSB stocks often show cyclical behaviour related to the broader economy.
a) Credit Demand Cycle
When corporate and retail loan demand is strong:
Bank lending grows
NIMs improve
Profitability increases
Stocks rally
During slowdowns, lending slows and PSBs weaken.
b) NPA (Non-Performing Assets) Influence
A major factor that affects PSB valuations is bad loans.
High NPAs = weak valuations
Lower NPAs = strong re-rating and investor confidence
Whenever PSBs report declining NPAs, stocks usually see multi-month rallies.
c) Government Recapitalization
PSBs sometimes require government capital infusion to strengthen balance sheets.
Announcements of recapitalization often cause:
Short-term volatility
Long-term stability
Such events attract traders seeking momentum.
4. Key Factors Traders Track in PSBs
1. RBI Monetary Policy
Interest rate hikes usually have a positive impact on PSBs initially but may impact loan growth later. The reverse is true for rate cuts.
2. Credit Growth Data
Higher loan growth = bullish sentiment.
3. NPA Trends
Quarterly results showing reduced NPAs cause strong buying.
4. Provisioning Coverage Ratio
Higher provisioning means lower future risk.
5. Government Policies
Schemes like:
Jan Dhan Yojana
Mudra loans
PM Kisan
Affordable housing subsidies
impact PSB balance sheets as these banks execute most government programs.
6. Bond Yield Movements
Bond yields impact treasury income. PSBs hold large government bond portfolios, so:
Falling yields → appreciate bond prices → higher profits
Rising yields → mark-to-market losses
This directly affects stock movements.
7. Global Market Sentiment
PSBs often move in line with:
US interest rate trends
Crude oil prices
Global risk appetite
Because they reflect India’s financial stability.
5. Why Traders Prefer PSB Stocks
✔ Volatility and Momentum
PSBs offer clear trending phases and sharp breakouts during periods of:
Economic expansion
NPA reduction
Privatization rumours
Monetary policy shifts
Their volatility works well for both intraday and swing trading.
✔ High Options Activity
PSBs like SBI and PNB have:
Liquid options
Tight premiums
Wide strike selections
This helps option sellers and buyers trade with confidence.
✔ Low Valuation Base
PSBs often trade at low price-to-book (P/B) ratios compared to private banks. So when re-rating happens, rallies are stronger and sustained.
✔ Strong Institutional Participation
FIIs and DIIs frequently invest in PSBs during bullish economic cycles. Their buying creates long uptrends.
6. Risks in Trading Public Sector Banks
PSBs carry unique risks that traders must consider.
1. High Exposure to Government Schemes
While beneficial for society, these schemes sometimes:
Reduce profitability
Increase operational costs
Lead to higher NPAs in certain sectors
2. Slow Decision-Making
Compared to private banks, PSBs may be slower to adapt to:
Digital banking
Fintech competition
Modern risk assessment systems
This can limit valuation expansion.
3. Vulnerability to Economic Stress
PSBs are more exposed to:
MSME distress
Agriculture stress
Infrastructure lending defaults
These risks cause periodic corrections.
7. Trading Strategies for Public Sector Banks
1. Event-Based Trading
Best events for trading PSBs:
RBI monetary policy
Union Budget
Quarterly results
NPA announcements
Government recapitalization news
Privatization rumours
Traders often take positions before or after these events.
2. Trend Following Strategies
PSBs tend to show long, clean trends. Traders use:
20/50/200 EMA crossovers
RSI breakout levels
Price-volume surge patterns
Trendline breakouts
Trending phases provide multi-week or multi-month opportunities.
3. Options Strategies
Popular strategies:
Bull call spread (during NPA improvement cycles)
Short straddle/strangle (during consolidation phases)
Protective put (around volatile policy announcements)
4. Pair Trading
Traders sometimes pair:
SBI vs Bank of Baroda
PNB vs Union Bank
Canara Bank vs Indian Bank
Based on relative strength comparisons.
8. Long-Term View of PSB Stocks
Historically, PSBs have delivered inconsistent long-term returns, but cycles of reform — such as:
Bank mergers
Digital transformation
NPA resolution
Government capital infusion
Interest rate cycles
have created powerful rally phases.
Investors who entered during undervalued periods often gained significantly over the long term.
Conclusion
Public Sector Banks are foundational pillars of India’s financial ecosystem. For traders, they offer a rare combination of:
High liquidity
Strong correlation with macroeconomic trends
Event-driven volatility
Clear trend opportunities
Attractive options trading potential
However, trading PSBs also requires careful monitoring of:
NPAs
RBI policies
Government decisions
Bond yields
Sector-wise economic health
Understanding these factors helps traders navigate PSB stocks effectively in both short-term and long-term market environments.

Part 8 Trading Master Class With ExpertsOptions Trading Styles in Markets
1. Intraday Option Trading
Fast movements
High leverage
Requires quick decision-making
2. Positional Options Trading
Holding for days or weeks
Less stressful than intraday
3. Weekly Expiry Trading (India-specific)
NIFTY & BANK NIFTY weekly options
Very popular among retail traders
Weekly options bring rapid time decay, which benefits option sellers but hurts buyers.

STRK Wait & Watch Situation BINANCE:STRKUSDT
Trend after retracement but retracement looks weak because price break already breaks major support, but candle is not closed so, confirmation is still pending.
4H chart show channel breaks down.
That also show negativity but still day time frame is running
🧠 Always DYOR (Do Your Own Research)
⚖️ This is not financial advice or suggestion
👉 “Risk Is Real 💸 Stay Practical🚀”
💬 Please feel free to ask any questions (It's Free)

Part 7 Trading Master Class With Experts Non-Directional Strategies
Used when markets are expected to be sideways or volatile.
1. Straddle (Buy Call + Buy Put)
Profit from high volatility in any direction.
2. Strangle
Cheaper version of straddle, using OTM options.
3. Iron Condor
Sell OTM call and put spreads.
Used for stable markets to earn premium.
4. Butterfly Spread
Low-cost strategy for low volatility expectations.
These strategies help traders benefit from volatility, time decay, and neutral price movements.
