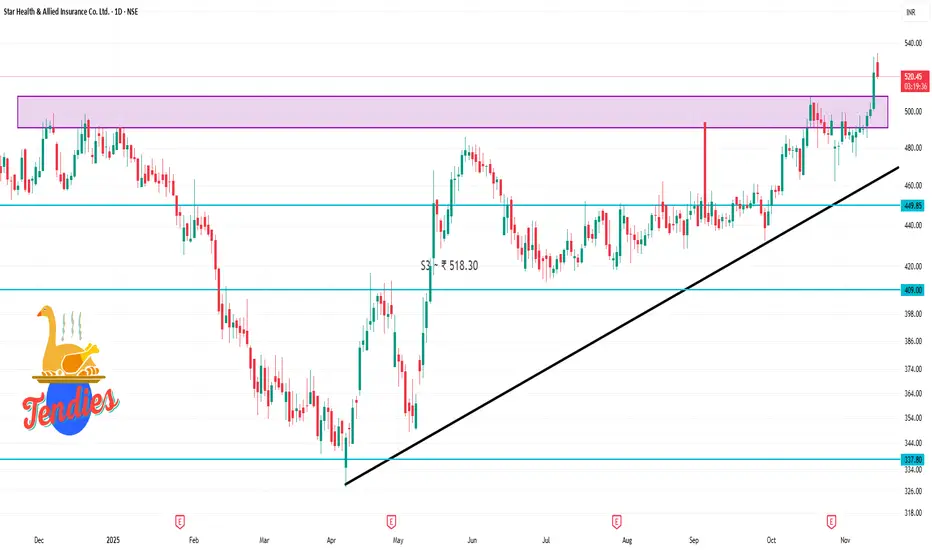
STARHEALTH 1 Day Time Frame 📍 Support & Resistance / Pivot Points (Daily)
Using the data:
Pivot (Classic/Fib) ~ ₹ 523.65.
Support levels:
S1 ~ ₹ 521.95
S2 ~ ₹ 520.00
S3 ~ ₹ 518.30
Resistance levels:
R1 ~ ₹ 525.60
R2 ~ ₹ 527.30
R3 ~ ₹ 529.25
Another source gives slightly different classic support/resistance:
S1 ~ ₹ 504.68, Pivot ~ ₹ 518.27, R1 ~ ₹ 536.03.
Trendlineanalysis
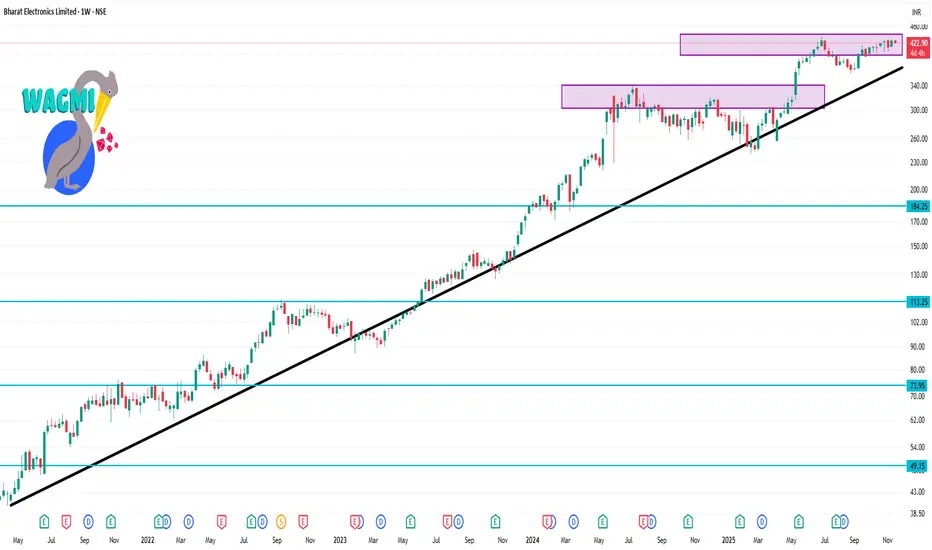
BEL 1 Week TIme Frame🔍 Key Levels to Watch
Immediate support zone: ~ ₹417.43.
Secondary support if breakdown: ~ ₹408.02.
Immediate resistance zone: ~ ₹432.83.
Major upside target if breakout: ~ ₹438.82.
📊 Current Technicals & Context
BEL is trading around ₹422-₹423 as of recent data.
Weekly performance modestly positive (~ +2 % to +4 %).
Price is above its 50-day and 200-day moving averages (~₹406 and ~₹356) → suggests medium-term bullish alignment.
RSI and indicators show bullish momentum but are not extreme. 🎯 Possible Scenarios for the Week
Base case: Price consolidates between ~₹417 and ~₹433, with limited range expansion unless a fresh trigger emerges.
Bullish breakout: If BEL closes above ~₹432.83 (with good volume), the next target zone becomes ~₹438-₹440.
Bearish breakdown: A close below ~₹417 could open a slide towards ~₹408 (or even ~₹402 in worst case for the week) as next support.
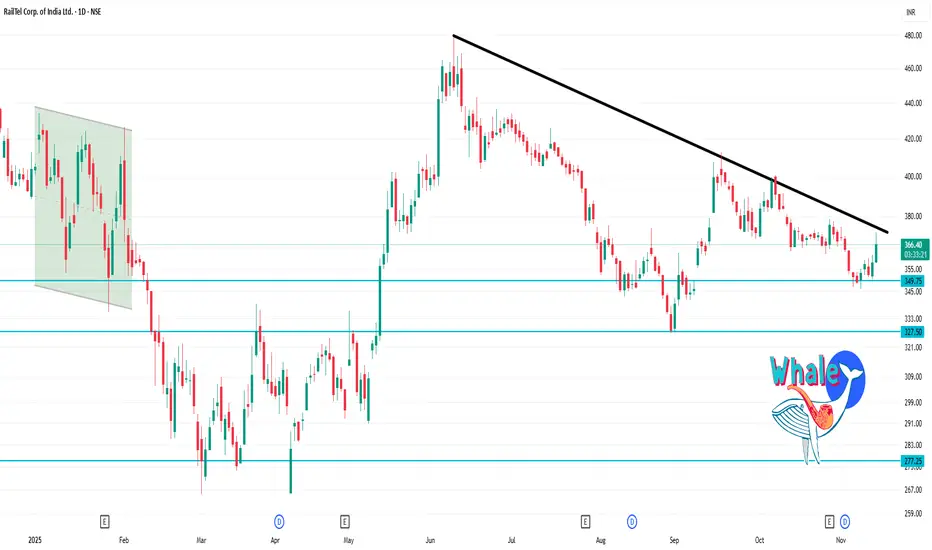
RAILTEL 1 Day Time Frame ✅ Current technicals
On the daily chart, the stock is near ~ ₹365.70 .
RSI(14) is ~ 63.7 → moderate momentum.
Many moving averages (20/50) are showing “buy” signals, but the 200-day is still above current price, giving a mixed picture.
Trend strength (ADX) is relatively weak/neutral, suggesting the move is not strongly trending.
🎯 Key levels (1-day timeframe)
These are approximate support/resistance and pivot levels derived from recent data.
Pivot & immediate levels
Pivot (classic) ~ ₹368.53.
Resistance 1 (R1) ~ ₹370.66.
Resistance 2 (R2) ~ ₹374.33.
Support 1 (S1) ~ ₹364.86.
Support 2 (S2) ~ ₹362.73.
Wider/more conservative zones
Major longer-term support: ~ ₹351–355 zone (from older pivot S2/S3).
Major longer‐term resistance: ~ ₹374–380 zone.
Part 12 Trading Master Class With Experts Types of Options
There are two primary types:
1. Call Option (CE)
A call option gives the buyer the right to buy the asset at a predetermined price (strike price).
Buyers profit when the underlying price goes up.
Sellers profit when the price stays below the strike.
2. Put Option (PE)
A put option gives the buyer the right to sell the asset at the strike price.
Buyers profit when the underlying price goes down.
Sellers profit when price stays above the strike.

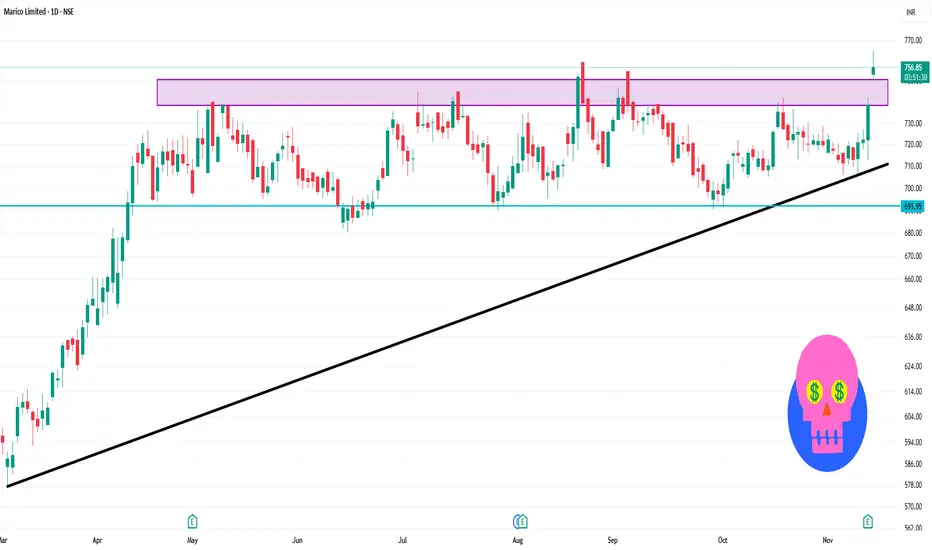
MARICO 1 Day Time Frame 📌 Key Price & Technical Status
Current market quote: ~ ₹758 on 17 Nov 2025.
RSI (14) on daily basis: ~77.46 → Overbought zone.
Moving averages (daily) for 5/10/20/50/100/200 periods are all showing “Buy” signals.
🎯 Interpretation & Short-Term Outlook
Given the current price (~₹758) is above many of the standard resistance/pivot levels, the stock is in a relatively strong upward momentum phase.
Overbought RSI suggests risk of pull-back or consolidation.
Key support zone to watch in case of reversal: ~ ₹730-₹720 (S1-S2 region)
On the upside, if momentum continues: ~ ₹760-₹780 region appears to be the next resistance cluster.
Since the price is already above many pivots and in “overbought” territory, caution is warranted for fresh long positions — better to wait for confirmation (e.g., breakout & volume) or a pull-back to support.
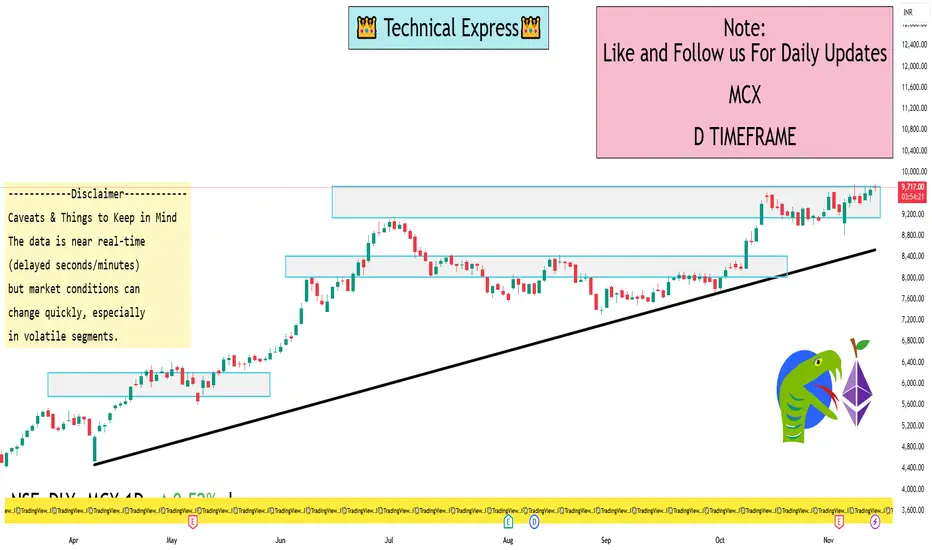
MCX 1 Day View Last traded price: ₹9,738.50 on 17 Nov 2025 (approx)
Previous day close: ~ ₹9,666.50
Day high so far: ~ ₹9,786.00
Day low so far: ~ ₹9,640.00
52-week high: ~ ₹9,786.00, 52-week low: ~ ₹4,408.15
One-Day Time-Frame Level Observations
The price is very near its recent all-time/52-week high (~₹9,700+), so there may be resistance around the recent high zone (~₹9,700-9,800).
It has already had an intraday high around ~₹9,744 today, so any breakout beyond that may open upside potential; conversely, dropping below the intraday low (~₹9,439) may indicate weakness.
Given its high valuation (P/E ~70.8x according to recent data) and that the stock is at a high level, one might be cautious of a pull-back risk or consolidation.
Caveats & Things to Keep in Mind
The data is near real-time (delayed seconds/minutes) but market conditions can change quickly, especially in volatile segments.
Even though the one-day frame gives a useful short-term view, longer-term fundamentals (earnings, growth, regulatory risk) matter for sustainability.
For example: Recently MCX had a system outage / capacity-breach that drew regulatory attention.
Also, brokerage views differ: One report noted a lower target for MCX despite the high latest price.
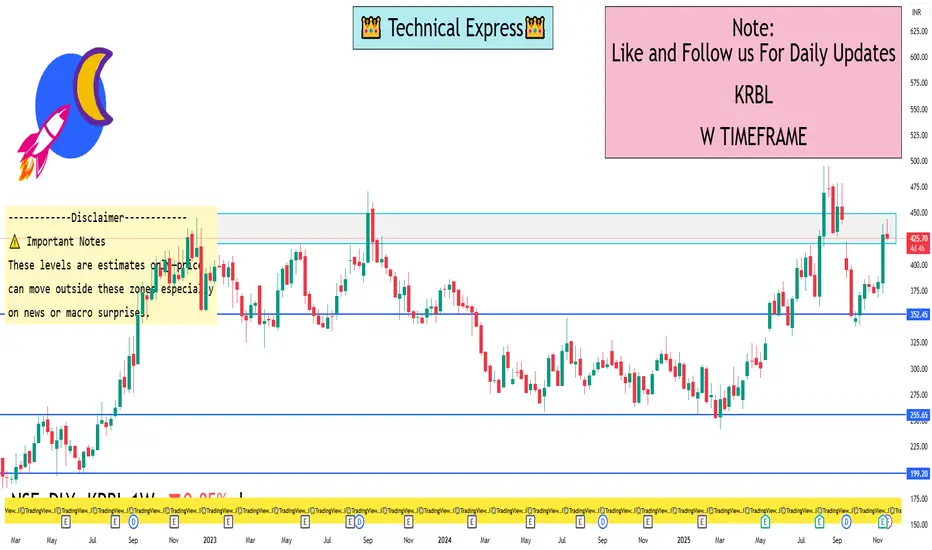
KRBL 1 Week View 🔍 Current data snapshot
Last quoted price: ~ ₹ 425 to ₹ 430.
Recent high trades around ~ ₹ 443.90 (1-day high) and low around ~ ₹ 424-425.
On the weekly view, the stock is in an upward leg, with recent momentum.
📊 1-Week Timeframe Support & Resistance Estimate
Support zone: ~ ₹ 410-420 — a near-floor based on recent consolidation around ~₹ 424-425.
Key pivot zone: ~ ₹ 430-435 — if price stays above this range, the short-term bullish bias remains intact.
Resistance zone: ~ ₹ 450-460 — an approximate upper barrier if momentum continues; the chart mentions ~₹ 480-490 as a broader resistance.
⚠️ Important Notes
These levels are estimates only—price can move outside these zones especially on news or macro surprises.
Use this as part of broader strategy (volume, trend, risk management) rather than relying solely on the levels.
Because the stock just bounced strongly, the risk of a short-term pullback to support is present.
Volatility Index (VIX) TradingUnderstanding What the Volatility Index Represents
The VIX is often called the “fear gauge” of the market. When investors expect calm markets, the VIX remains low. When uncertainty rises—due to economic news, geopolitical tension, policy announcements, or unexpected events—the VIX rises sharply.
Key characteristics of volatility indexes:
Mean-Reverting Nature
Volatility cannot stay extremely high or low forever. It tends to revert toward its long-term average over time. This makes volatility trading very different from equity or commodity trading.
Negative Correlation with Stock Markets
When stock markets fall sharply, volatility rises. This makes VIX instruments excellent hedging tools for traders.
Forward-Looking Indicator
Unlike price movements, which are backward-looking, the VIX reflects future expectations implied by options prices. Therefore, it reacts before markets move significantly.
Not Directly Tradable
The VIX itself cannot be bought or sold like a stock or index. Instead, traders use various derivative products linked to the VIX.
How Volatility Indexes Are Calculated
VIX is calculated using a range of out-of-the-money call and put options on the S&P 500 (or Nifty for India VIX). The formula takes into account:
Weighted prices of options
Time to expiration
Strike prices
Forward index level
This complex calculation estimates the expected magnitude of market movement over the next 30 days, expressed as annualized volatility.
Example:
If VIX is 20, the market expects the S&P 500 to move up or down about 20% annually (or approximately 5.8% monthly).
Instruments Used for Volatility Index Trading
1. VIX Futures
The most common way traders gain exposure to volatility. Futures allow traders to take long or short positions on where they believe VIX will be on a future date.
Long VIX Futures: Profit if volatility increases
Short VIX Futures: Profit if volatility decreases
These futures often trade at a premium due to storage-like costs called contango.
2. VIX Options
Options on the VIX behave differently from equity options because the underlying asset is volatility—not a stock price.
Call options gain value when volatility rises
Put options gain value when volatility falls
These instruments are widely used by hedge funds and professional traders.
3. Volatility ETFs and ETNs
Examples include VXX, UVXY, SVXY (U.S. markets). These track futures on the VIX rather than the index itself.
Leveraged ETFs amplify the movement
Inverse ETFs profit from falling volatility
They are popular among retail traders but can decay in value over time due to futures roll costs.
4. India VIX Futures (NSE)
In India, traders use India VIX futures on the National Stock Exchange. These allow hedging for Nifty investors during events such as:
Elections
Monetary policy announcements
Global uncertainties
Why Traders Use Volatility Index Instruments
1. Hedging Portfolio Risk
When markets fall, volatility rises. Traders buy VIX futures or VIX call options as a hedge against sudden market decline.
Example:
If a trader holds long positions in Nifty stocks, they may take a long exposure in India VIX futures for protection.
2. Speculation on Market Fear
Some traders bet on volatility spikes during events like:
Economic data releases
Wars or geopolitical tensions
Budget announcements
Earnings seasons
Because the VIX reacts quickly, speculative trading can yield large short-term profits.
3. Arbitrage Opportunities
Professional traders use volatility-based arbitrage strategies such as:
Calendar spreads
Term structure arbitrage (contango vs. backwardation)
VIX vs. equity options mispricing
These strategies exploit discrepancies in the pricing of volatility futures across time periods.
4. Portfolio Diversification
Volatility instruments have low or negative correlation with stocks, making them powerful diversifiers in a balanced portfolio.
How Volatility Behaves in Markets
Volatility is not constant. It shows typical behavior patterns:
1. Volatility Spikes Are Sudden
News shocks can cause VIX to jump from 12 to 30 within hours. Traders must react quickly.
2. Volatility Drops Slowly
After a spike, the VIX declines gradually as markets stabilize.
3. Volatility Clusters
Periods of high volatility often follow each other. Calm periods also cluster together.
4. Volatility Mean Reverts
If VIX rises too high, it eventually comes down. Traders use this for mean-reversion strategies.
Common Trading Strategies
1. Buying Volatility Before Major Events
Traders go long VIX before important announcements expecting an increase in volatility.
2. Selling Volatility During Calm Conditions
When volatility is high but expected to return to normal, traders short the VIX.
3. Volatility Spread Trading
Example: Long near-month VIX future and short far-month future if backwardation is expected.
4. Hedging Equity Exposure
Holding a VIX long position while maintaining a long stock portfolio helps protect against market crashes.
5. Using VIX Options
Buying call options on VIX gives asymmetrical protection—limited loss, unlimited upside.
Risks Involved in Volatility Index Trading
1. Futures Roll Costs
ETFs and futures lose value when the market is in contango, causing decay in long-term positions.
2. Sharp Reversals
A spike in volatility can be followed by a rapid fall, wiping out gains quickly.
3. Leverage and Margin Risks
Volatility products are often leveraged, magnifying losses.
4. Complexity
Volatility is one of the most advanced fields in trading. Pricing models are complex and require deep understanding.
5. Decay in Leveraged ETFs
Products like UVXY experience significant long-term decay due to daily rebalancing.
Advantages of Volatility Trading
High-profit potential during market stress
Effective tool for managing risks
Helps diversify portfolios
Provides insight into market sentiment
Offers opportunities even when markets are not trending
Conclusion
Volatility index trading is a powerful and sophisticated form of market participation. It gives traders an opportunity to profit from market fear, hedge against unexpected downturns, and gain exposure to an entirely different dimension of financial markets. Understanding how volatility behaves—its mean-reverting nature, its correlation with market stress, and its reaction to external events—is crucial for trading VIX-based instruments effectively.
Investing in Shares in the Indian Market1. Understanding the Indian Stock Market
India’s stock market is primarily operated through two major exchanges:
(a) National Stock Exchange (NSE)
The NSE is the largest exchange in terms of volume. It introduced electronic trading in India and is home to major indices such as Nifty 50, Nifty Bank, Nifty IT, and others.
(b) Bombay Stock Exchange (BSE)
One of the oldest exchanges in Asia, the BSE hosts indices like the Sensex, BSE Midcap, and BSE Smallcap.
Both exchanges are regulated by the Securities and Exchange Board of India (SEBI), which ensures transparency, investor protection, and fair trading practices.
2. What Are Shares?
Shares represent ownership in a company. When you invest in shares, you:
Become a part-owner of the business
Benefit from the company’s growth through capital appreciation
Receive dividends, if declared
Get voting rights in some cases
Share prices fluctuate due to demand and supply, economic conditions, company performance, global news, and market sentiment.
3. How to Start Investing in Shares in India
(a) Open a Demat Account
A Demat (Dematerialized) account stores your shares electronically. It is essential for buying and selling equities in India.
Major brokers include:
Zerodha
Groww
Angel One
Upstox
ICICI Direct
HDFC Securities
(b) Open a Trading Account
Connected to your Demat account, this is used to place buy/sell orders on the exchange.
(c) Link a Bank Account
Funds are transferred from your bank to the trading account to execute transactions.
(d) Complete KYC
AADHAR, PAN, mobile number verification, and e-signature are mandatory parts of the KYC process.
Once these steps are completed, you can begin investing through your broker’s app or platform.
4. Ways to Invest in the Indian Stock Market
(a) Direct Equity (Buying Individual Stocks)
This means selecting individual companies for long-term investment based on research.
(b) Mutual Funds / Equity SIPs
Investors who prefer passive management often choose mutual funds such as:
Large-cap funds
Mid-cap funds
Small-cap funds
Index funds
Thematic funds
SIP (Systematic Investment Plan) allows regular monthly investments.
(c) ETFs (Exchange-Traded Funds)
ETFs track an index like Nifty 50 and trade like stocks. They offer low costs and diversification.
(d) IPOs (Initial Public Offerings)
Investors can apply for shares of companies when they list for the first time.
5. Types of Shares in India
By Market Capitalization
Large-cap: Stable, established companies (Reliance, TCS, HDFC Bank)
Mid-cap: Growing companies with higher potential
Small-cap: High-risk, high-reward companies
By Sector
Banking and Finance
IT and Technology
Pharma
FMCG
Metal and Energy
Auto
Infrastructure
Telecom
Each sector performs differently depending on macroeconomic cycles.
6. Why Invest in Shares?
(a) Wealth Creation
Over long periods, equities offer the highest returns compared to gold, real estate, or fixed deposits. For example, Nifty 50 has delivered around 14–15% annualized returns over 20 years.
(b) Beat Inflation
Inflation reduces money’s purchasing power. Equity returns typically outpace inflation, helping preserve and grow wealth.
(c) Dividends and Bonuses
Investors may receive dividend income, bonus shares, and stock splits.
(d) Ownership and Transparency
India’s markets are well-regulated, ensuring transparent transactions and investor protection.
7. Risks of Investing in Shares
Stock investment is rewarding but comes with risks:
(a) Market Risk
Share prices move up and down due to market sentiment, global cues, and economic changes.
(b) Company-Specific Risk
Poor management, low earnings, fraud, or competition can affect a company's share price.
(c) Liquidity Risk
Some shares, especially small caps, may have fewer buyers, making it hard to sell quickly.
(d) Economic and Geopolitical Risk
Events like elections, wars, oil price fluctuations, and global recession impact Indian markets.
Managing risk through diversification and research is essential.
8. Fundamental vs. Technical Analysis
Investors use two main methods to pick stocks:
(a) Fundamental Analysis
Focuses on a company’s core financial health. This involves studying:
Revenue and earnings
Profit margins
Debt levels
Cash flow
Competitive advantage
Management quality
The goal is to buy companies undervalued relative to their intrinsic value.
(b) Technical Analysis
Helpful for short-term trading. It focuses on:
Price charts
Chart patterns
Support and resistance
Indicators like RSI, MACD, moving averages
Traders use technical analysis to time entry and exit points.
9. Long-Term vs. Short-Term Investing
Long-Term Investing (Wealth Building)
Investing with a 5–10+ year horizon helps benefit from compound returns. Historically, holding quality stocks over long periods reduces risk and maximizes growth.
Short-Term Trading
Includes intraday, swing trading, options trading, and futures. While it offers quick profits, it is high risk and requires discipline and advanced market knowledge.
10. Taxes on Shares in India
Short-Term Capital Gains (STCG)
15% tax if shares are sold within 1 year.
Long-Term Capital Gains (LTCG)
10% tax on gains above ₹1 lakh for shares held beyond 1 year.
Dividends
Taxed at the investor’s slab rate.
11. Key Tips for Stock Market Investors
✔ Invest regularly (SIP method)
✔ Diversify across sectors and market caps
✔ Focus on fundamentally strong companies
✔ Avoid panic selling during corrections
✔ Do not follow rumors or tips blindly
✔ Keep a long-term perspective
✔ Review your portfolio annually
✔ Understand risk appetite before investing
12. Common Mistakes to Avoid
Investing without research
Over-trading for quick profits
Lack of diversification
Emotional decisions
Ignoring risk management
Putting all savings into stocks
Conclusion
Investing in shares in the Indian market offers a powerful opportunity to build long-term wealth. With a robust regulatory framework, digital trading platforms, and a rapidly growing economy, India provides a fertile environment for equity investment. While market fluctuations and risks exist, informed decision-making, disciplined investing, and a long-term approach can significantly enhance the probability of success. Whether you are a beginner or an experienced investor, the key lies in continuous learning, patience, and choosing the right companies aligned with your financial goals.
Crypto Asset Secrets: Fundamental Dynamics, Structural Realities1. Liquidity Is the Real Power in Crypto
The biggest secret in crypto markets is that price is controlled by liquidity, not popularity.
Most newcomers focus on:
News
Social media hype
Project fundamentals
Influencers
But markets move when large buyers or sellers enter low-liquidity environments. Liquidity gaps can produce:
Rapid pumps
Flash crashes
Stop-loss hunts
“Wick” volatility that destroys leveraged positions
A coin with a $500 million market cap can still move violently if daily trading volume is thin. In crypto, the book depth (available orders) matters far more than market cap.
Key point:
Low liquidity = high manipulation potential.
2. Whales Shape Most Major Market Moves
In stock markets, institutions dominate. In crypto, large holders—“whales”—play an even bigger role.
Whales can:
Move prices by placing large buy/sell walls
Trigger liquidation cascades
Create fear or euphoria with timed transactions
Exploit precise liquidity zones around funding cycles
Their strategies include:
Spoofing (placing fake orders to influence sentiment)
Wash trading (creating artificial volume)
Accumulation/distribution cycles
Stop-hunting via sudden volatility
Blockchain transparency exposes whale movements, but interpreting them correctly is an art.
Secret:
Following whale wallets often reveals market direction before retail sees it.
3. Market Makers Quietly Control the Order Flow
Market makers (MMs) provide liquidity to exchanges, but they also shape price behaviour.
Their influence includes:
Maintaining spreads
Absorbing buy/sell pressure
Moving price to areas with highest liquidity (liquidation zones)
Hedging risk across spot, futures, and options
In crypto, many market makers act with more flexibility than traditional finance because regulation is looser.
MMs often engineer:
Range-bound price action
Breakouts toward liquidity pools
Sudden volatility to rebalance exposures
Secret:
If you watch where liquidity pools form (using heatmaps or liquidation charts), you can anticipate MM moves.
4. Most Altcoins Inflate Through Token Unlocks
The majority of altcoin investors don’t know that token unlocking schedules dilute price over time.
Even strong projects follow emission schedules:
Team vesting
Private sale unlocks
Ecosystem incentives
Liquidity injections
These can release millions of tokens into circulation—sometimes monthly or even weekly.
This creates constant sell pressure.
Secret:
You must study tokenomics before touching an altcoin. Fully diluted valuation (FDV) is often more important than current price.
5. Centralized Exchanges Have Enormous Hidden Power
Crypto is marketed as decentralized, but trading is 90% dependent on centralized exchanges (CEXs).
Exchanges control:
Order books
Liquidation engines
Funding rates
Front-end data feeds
Risk management algorithms
Sometimes, exchanges:
Adjust leverage availability
Close off withdrawals during volatility
Run maintenance at “mysterious” times
Remain opaque about reserves
Some even act as market makers for their own platforms.
Secret:
Understanding exchange mechanics is essential. The exchange is always the house—and the house rarely loses.
6. Liquidation Cascades Move the Market More Than News
Crypto futures markets have massive leverage (up to 100x), causing forced buying and selling when prices hit certain levels.
The hidden force: liquidation engines.
When many traders are long with high leverage:
Price drop → forced sell orders
Forced sell orders push price down more
More traders get liquidated
A cascade forms
This also happens with shorts during squeezes.
This explains why crypto often moves:
10% in minutes
Without any news
At perfectly predictable liquidity levels
Secret:
Liquidation maps show where cascades may occur. Price often hunts these zones.
7. On-Chain Data Reveals the Truth Behind the Charts
Traditional markets hide data. Crypto exposes everything on-chain:
Wallet holdings
Exchange inflows/outflows
Long-term holder behaviour
Staking metrics
Miner activity
Smart contract interactions
If you know how to read:
NVT ratio
MVRV
Exchange reserves
Realized price bands
Whale accumulation patterns
…you can detect real momentum before price reacts.
Secret:
Charts lie. On-chain data doesn’t.
8. Narrative Cycles Drive Altcoin Seasons
Every major rally has a narrative:
DeFi Summer
NFT Boom
Layer-1 Wars
Meme coin mania
AI tokens
Real-world assets (RWA)
Liquid Staking Tokens (LST)
Investors rotate money from one narrative to the next. These narratives often appear months before the public notices.
Smart investors track:
Developer activity
Ecosystem funding
Partnerships
VC trends
Secret:
Narratives drive capital flows. Capital flows drive price.
9. Most Crypto Gains Happen in Short Bursts
Studies show that less than 10 trading days per year often produce the majority of bitcoin’s returns.
Reasons:
Halving-driven supply shocks
Macro cycles
FOMO waves
Short squeezes
Liquidity gaps
Missing just a few days can mean missing the entire bull run.
Secret:
The market rewards patience and punishes overtrading.
10. Security Is the Most Overlooked Crypto Secret
Most people focus on price, not protection. Yet the fastest way to lose everything is through:
Phishing attacks
Private key leaks
Smart contract exploits
Rug pulls
Exchange hacks
Proper security includes:
Hardware wallets
Multi-sig accounts
Avoiding suspicious sites
Using separate wallets for risky assets
Secret:
In crypto, custody = control. If you don’t own your keys, you don’t own your coins.
11. Macroeconomic Cycles Still Control Crypto
Despite its futuristic image, crypto reacts strongly to:
Interest rates
Liquidity conditions
Bond yields
Dollar strength
Risk-on/risk-off cycles
Bitcoin behaves like a high-beta macro asset.
When global liquidity expands, crypto thrives.
When liquidity contracts, crypto bleeds.
Secret:
Crypto is free-spirited, but not independent from global finance.
12. The Halving Cycle Is Not Magic—It’s Economics
Bitcoin halvings reduce new supply by 50%.
This supply shock:
Reduces miner selling pressure
Alters long-term market psychology
Triggers new speculative phases
This creates 4-year boom-bust cycles.
It’s not magic—it’s simple scarcity economics mixed with human behaviour.
Secret:
Halving cycles still matter because supply psychology still matters.
Conclusion
The real “secrets” of crypto assets are not mystical or hidden behind paywalls. They are the deeper forces—liquidity mechanics, whale behaviour, on-chain transparency, tokenomics, exchange power, and macro cycles—that quietly dictate market structure.
Understanding these truths transforms how you see the market:
You stop chasing hype.
You learn to track liquidity.
You interpret whale moves.
You anticipate volatility.
You understand risk.
Crypto is still evolving, still volatile, and still experimental. But with knowledge of its inner workings, you gain clarity in a market where most remain confused.
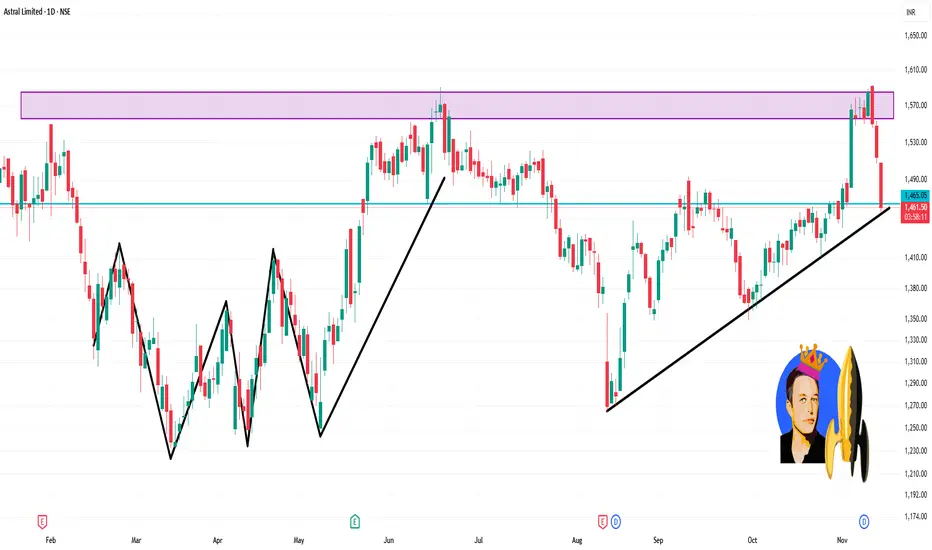
ASTRAL 1 Day Time Frame 📊 Recent Price Snapshot
Latest closing around ₹1,460-₹1,470.
Daily range on latest day: High ~ ₹1,508, Low ~ ₹1,460.
52 week high ~ ₹1,867, 52 week low ~ ₹1,232.
🔍 Key Levels for the 1-Day Timeframe
Support Levels
Around ₹1,440–₹1,450: Recent lows touched ~1,445.
Further support nearer the 200-day SMA (~₹1,417) as per technical data.
Resistance Levels
Immediate resistance near ₹1,508 (recent high).
A stronger resistance zone around ₹1,520-₹1,550 (recent swing highs).
Price Action & Trend
The stock is trading above its 200-day average (~₹1,417) but the upward momentum appears weak.
On short term RSI/MFI metrics: MFI appears elevated (suggestive of some overbought behaviour).
Part 11 Trading Master Class With Experts 1. What Is an Option?
An option is a financial contract that gives the buyer the right, but not the obligation, to buy or sell an underlying asset (like stocks, indices, or commodities) at a fixed price within a specific time period.
The right but not the obligation makes options unique.
The underlying asset could be Nifty, Bank Nifty, stocks like Reliance or TCS, commodities like gold, etc.
The agreement is always between two parties:
Option Buyer (Right, Limited Risk)
Option Seller / Writer (Obligation, Unlimited Risk)

Candle Patterns Candlestick patterns are visual signals created by price movement. Each candle shows open, high, low, and close, but certain shapes reveal strong buying or selling pressure.
✅ 1. Single Candlestick Patterns
✅ 2. Bullish Candlestick Patterns (Reversal)
✅ 3. Bearish Candlestick Patterns (Reversal)
✅ 4. Continuation Patterns

Premium Chart Patterns Premium chart patterns are high-quality technical structures that show where big money is entering or exiting, helping you predict future moves with strong accuracy. These patterns are widely used in swing trading, intraday trading, and positional trading.
Below, you’ll find the top high-probability premium patterns, along with how to trade them.

Part 10 Trade Like Institutions Advantages of Option Trading
Low investment, high return potential
Can profit in any market condition
Great for hedging and insurance
Wide range of strategies
Lower capital requirement compared to futures
Disadvantages of Option Trading
Requires knowledge of Greeks
High risk if used incorrectly
Time decay eats into profits
Volatility can change premiums rapidly

Part 9 Trading Master Class with Experts In-the-Money, At-the-Money, Out-of-the-Money
Call Options
ITM: Market price > strike
ATM: Market price ≈ strike
OTM: Market price < strike
Put Options
ITM: Market price < strike
ATM: Market price ≈ strike
OTM: Market price > strike
OTM options are cheap but risky.
ITM options are safer but cost more.

Part 8 Trading Master Class with Experts Time Decay (Theta): The Silent Killer
Time decay works against option buyers and in favor of sellers.
As expiry approaches, the time value decreases.
Even if the price stays the same, the option loses value daily.
Weekly options lose value much faster than monthly options.
This is why many professional traders prefer option selling—because time decay works in their favor.

Part 7 Trading Master Class With Experts Option Pricing: Why Premium Changes
Premium is the price paid by the option buyer. It depends on:
1. Intrinsic Value
Value if exercised today.
2. Time Value
More time → more chances of profit → higher premium.
3. Volatility (IV – Implied Volatility)
When volatility increases, option premiums rise.
4. Supply & Demand
High demand increases option prices.
5. Interest Rates & Dividends
These have minor impact but still matter for pricing models.

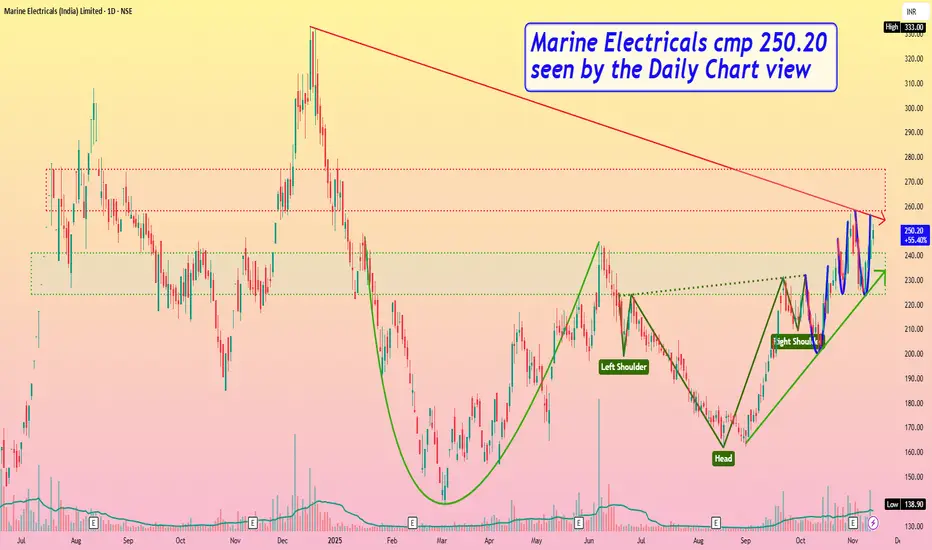
Marine Electricals cmp 250.20 by Daily Chart viewMarine Electricals cmp 250.20 by Daily Chart view
- Support Zone 224 to 241 Price Band
- Resistance Zone 258 to 275 Price Band
- Bullish Chart setup by Rounding Bottoms, pre and post Head & Shoulders
- Volumes seen spiking very heavily and well above the average traded quantity
- Positively trending Technical Indicators BB, EMA, MACD, RSI, SAR, SuperTrend, VWAP
- Breakout attempted above Falling Resistance Trendline and Rising Support Trendline sustained
- Fresh Breakout probable subject to Resistance Zone crossing and closure sustained above it for few days
Part 6 Learn Institutional Trading Why Trade Options?
Options are extremely popular because they offer:
1. Leverage
You can control a large position using a small amount of money (the premium).
Example: Buying a stock may cost ₹1,00,000, but a call option may cost only ₹3,000.
2. Hedging
Investors use options to protect their portfolios from losses during market corrections.
3. Income Generation
Option sellers generate regular income through premium collection strategies.
4. Flexibility
You can build strategies that make money in rising, falling, or sideways markets.

Part 4 Learn Institutional Trading Two Sides of an Option Trade
Every option contract involves two parties:
a. Option Buyer
Pays a premium (price of the option)
Limited risk (only the premium paid)
Unlimited profit potential in some cases
b. Option Seller (Writer)
Receives the premium
Limited profit potential
Higher risk (sometimes unlimited)
Option buyers purchase potential, while sellers sell that potential in exchange for premium income.

Part 3 Learn Institutional Trading What Are Options?
Options are derivative contracts, meaning their value is derived from an underlying asset. The underlying asset may be stocks, indices, commodities, currencies, ETFs, or even cryptocurrencies.
There are two main types of options:
Call Option – Gives the buyer the right, but not the obligation, to buy the underlying asset at a specific price before a specific date.
Put Option – Gives the buyer the right, but not the obligation, to sell the underlying asset at a specific price before a specific date.
The specific price is called the strike price, and the last day the contract is valid is the expiry date.

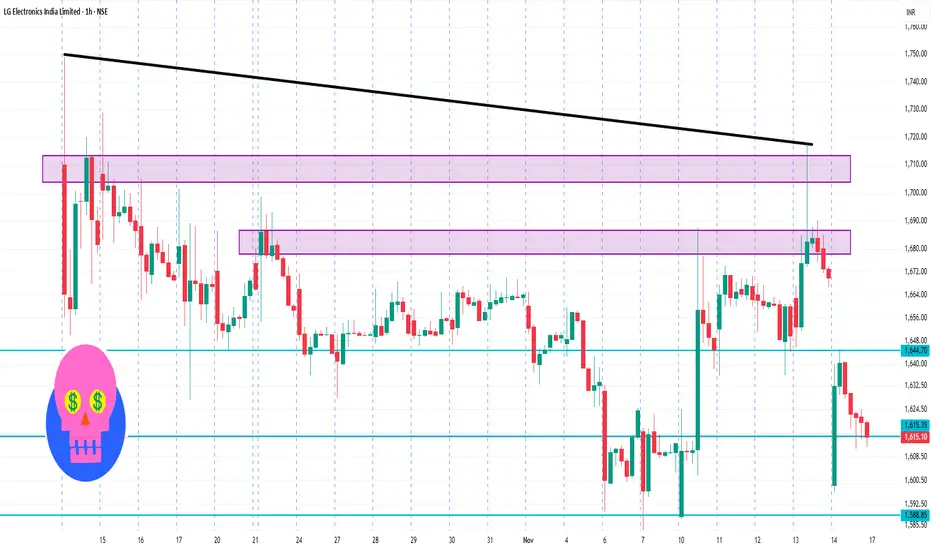
LGEINDIA 1 Hour Time Frame 📌 Current & near-term standing
1. Last close: ₹ 1,617.80 (approx) — down ~3.31% for the day.
2. Today’s trading range: about ₹1,590 (Low) to ₹1,645.20 (High).
3. 52-week range: roughly ₹1,581.10 (Low) to ₹1,749.00 (High).
🕒 Hourly / Intra-day timeframe
If by “hour time-frame” you mean intra-day trading / hourly context, here are a few tips and caveats:
Detailed hour-by-hour data is not shown in the sources I reviewed (they show daily ranges).
The stock’s intra-day range (today) implies volatility: L ~₹1,590, H ~₹1,645.20. That gives about ~₹55 swing.
For an active trader, watch key levels: around ₹1,590 (today’s low) and ~₹1,645 (today’s high) as short-term support/resistance zones.
Because the stock is near its 52-week low side (~₹1,580), any intra-day drop near that mark may draw attention.