Part 2 Support and ResistanceRisks in Option Trading
Option trading can be rewarding but has risks:
1. For Buyers
High probability of premium loss (because theta works against them).
Market must move fast and in the right direction.
2. For Sellers
Unlimited loss possible (especially in naked selling).
Requires big margin.
High stress during volatile markets.
Trendlineanalysis

Part 1 Support and Resistance 1. Low Capital Requirement
You can control a large position with a small premium.
2. Hedging Risks
Investors hedge portfolios using Puts to protect against market drops.
3. Speculation
Traders predict short-term movements using calls and puts.
4. Income Generation
Sellers earn regular income from premium writing strategies (covered call, short straddle, iron condor, etc.).
5. Flexibility
Options allow bullish, bearish, neutral, and even volatility-based strategies.

Part 1 Intraday Trading Master Class How Option Pricing Works
Option prices (premiums) depend on multiple factors:
1. Underlying Price Movement
Biggest factor.
CE rises when market rises.
PE rises when market falls.
2. Time to Expiry (Theta)
As expiry approaches, options lose value due to time decay.
Buyers suffer from theta.
Sellers benefit from theta.
3. Volatility (Vega)
Higher volatility = higher premiums.
4. Demand–Supply and Market Sentiment
Aggressive buying or selling changes premium rapidly.

UNIONBANK 1 Week Time Frame 📊 Current Price Snapshot
UNION Bank of India (NSE: UNIONBANK) is trading around ₹162–₹165+ in the market currently.
📈 Weekly Time‑Frame Levels (Pivot / Support / Resistance)
📌 These weekly pivots & S/R levels are based on established pivot calculations for weekly charts:
🔹 Pivot & Resistance Levels
Weekly Pivot (Central reference): ~₹153.97
Weekly Resistance 1 (R1): ~₹159.83
Weekly Resistance 2 (R2): ~₹162.95
Weekly Resistance 3 (R3): ~₹168.81
🔻 Weekly Support Levels
Weekly Support 1 (S1): ~₹150.85
Weekly Support 2 (S2): ~₹144.99
Weekly Support 3 (S3): ~₹141.87
📌 Interpretation (Weekly Chart Bias)
🔹 Bullish Signposts
✔ Price above weekly pivot ~₹153.97 = positive short‑term bias.
✔ Immediate upside zone between ₹159.8–₹163 — break above this can extend to ₹168+.
🔻 Bearish / Correction Signals
✖ Loss of weekly pivot ~₹153.97 with close below can turn momentum negative.
✖ Deeper support cluster near ₹145–₹142 — watch these zones for possible bounce points.
📌 Summary Weekly Levels (Quick Reference)
Level Type Price (Approx)
R3 (Weekly) ₹168.8
R2 (Weekly) ₹162.9
R1 (Weekly) ₹159.8
Pivot (Weekly) ₹153.9
S1 (Weekly) ₹150.8
S2 (Weekly) ₹144.9
S3 (Weekly) ₹141.8
(All levels approximate — based on recent pivot calculations and current market data.)

Part 11 Trading Master ClassWhat Are Options?
Options are financial contracts that derive their value from an underlying asset such as:
A stock (e.g., Reliance)
An index (e.g., NIFTY 50)
A commodity (e.g., Gold)
A currency pair
Options are called derivatives because their price derives from the underlying market.
There are two types of options:
1. Call Option (CE)
A Call Option gives the buyer the right to buy the underlying asset at a fixed price (strike price) before expiry.
Buyers expect price to rise.
Sellers (writers) expect price to stay below strike.
2. Put Option (PE)
A Put Option gives the buyer the right to sell the underlying asset at a strike price before expiry.
Buyers expect price to fall.
Sellers expect price to stay above strike.

Nifty 50 1 Day Time Frame 📌 Live Current Level (Intraday)
📊 Nifty 50 ~ 26,030 – 26,040 and trading lower amid selling pressure this session.
📊 Daily Price Action
• Today’s intraday range: ~26,025 (low) to ~26,133 (high).
• Recent session momentum continues weak with external macro pressure (tariff worries & outflows).
Reuters
🔍 1-Day Technical Levels (Daily Chart)
These levels are widely used by traders for support / resistance / pivots on the daily timeframe:
📈 Resistance (Upside)
1. ~26,240 – 26,300: near-term supply zone & intraday resistance.
2. ~26,350: strong resistance above psychological 26,300 level.
📉 Support (Downside)
1. ~26,050 – 26,100: first line of defense (20-period SMA/DEMA support zone).
2. ~25,800 – 25,900: secondary support — holding here avoids deeper breakdown.
📊 Pivot Levels (Indicative)
(Classic daily pivot calculations from technical feeds)
• Daily Pivot Point: ~26,132 – Pivot acts as intraday reference.
• R1: ~26,195–26,200
• R2: ~26,250–26,300
• S1: ~26,076–26,080
• S2: ~26,012–25,950
(These pivot points are from live technical data.)
📈 Summary — What This Means Today
✅ Bullish above: 26,300–26,350 breakout confirms short-term buying.
⚠️ Neutral/Range: 26,050–26,300 — likely sideways action.
❌ Bearish below: 26,050 — risk of extending weakness toward 25,900/25,800.

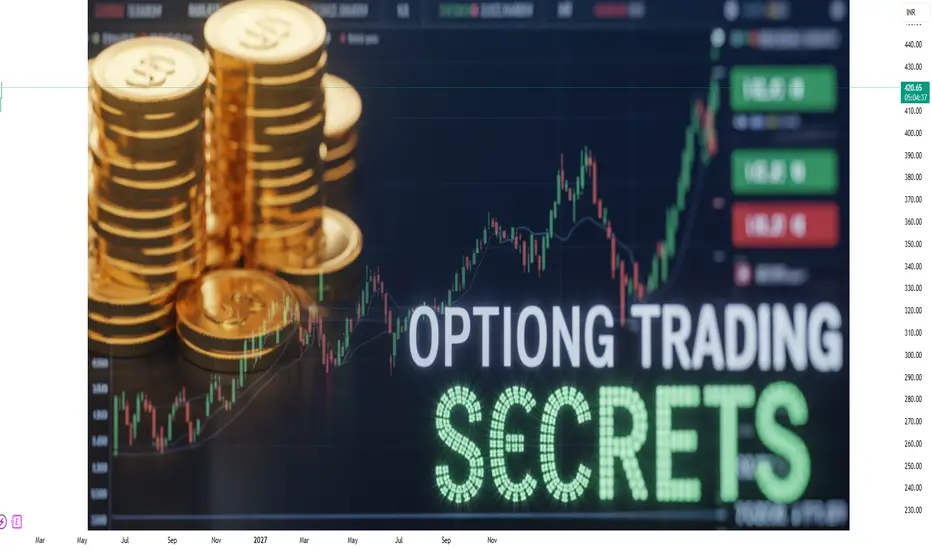
Proven Strategies to Trade Options Like a ProfessionalOption Trading Secrets:
Option trading is often seen as complex, risky, and suitable only for experts. However, when understood correctly, options can become one of the most powerful tools for generating consistent income, managing risk, and enhancing portfolio returns. The real “secrets” of option trading are not hidden formulas or insider tricks, but a combination of knowledge, discipline, strategy selection, and risk control. Successful option traders think in probabilities, not predictions, and focus on process rather than excitement.
Below is a detailed explanation of the key option trading secrets that separate consistently profitable traders from those who struggle.
1. Understanding Options Beyond Buy and Sell
The first secret is understanding that options are not just about buying calls or puts. Options are financial instruments that allow traders to design strategies based on market direction, volatility, and time. While beginners focus only on direction (price going up or down), professionals focus on three dimensions:
Direction (Bullish, Bearish, Sideways)
Volatility (High or Low)
Time decay (Theta)
Once you understand these three forces, options become flexible tools rather than gambling instruments.
2. Time Decay Is Your Biggest Advantage
One of the biggest secrets in option trading is that time decay works in favor of option sellers, not buyers. Every option loses value as it approaches expiry, especially in the last few days. Professional traders often sell options to take advantage of this natural decay.
Option buyers need a fast and strong move to profit.
Option sellers can profit even if the market moves slowly or stays sideways.
This is why many experienced traders prefer strategies like credit spreads, iron condors, and short strangles instead of naked option buying.
3. Volatility Matters More Than Direction
Another hidden truth is that volatility is often more important than price movement. Many traders lose money even when the market moves in their direction because they ignored volatility.
Buying options during high volatility is risky because premiums are expensive.
Selling options during high volatility is beneficial because premiums are inflated.
Smart traders sell options when volatility is high and buy options when volatility is low. Understanding indicators like Implied Volatility (IV) and IV Percentile gives traders a strong edge.
4. Probability-Based Trading Wins Long Term
Successful option traders trade based on probabilities, not emotions. Every option strategy has a probability of success, which can be calculated using option Greeks and statistical models.
Instead of asking:
“Will the market go up?”
Professionals ask:
“What is the probability that the market will stay within this range?”
Strategies with a 60–75% probability of success may give smaller profits per trade, but they work consistently over time.
5. Risk Management Is the Real Secret
The biggest secret of all is that risk management matters more than strategy. Even the best option strategy will fail without proper risk control.
Key risk management rules include:
Never risk more than 1–2% of total capital on a single trade.
Always define maximum loss before entering a trade.
Avoid over-leveraging or selling too many lots.
Use stop-losses or adjustment rules.
Professional traders survive because they protect capital first and chase profits second.
6. Strategy Selection Based on Market Conditions
One common mistake is using the same option strategy in every market. The secret is to match strategy with market condition:
Trending Market: Debit spreads, call/put spreads
Sideways Market: Iron condors, strangles, straddles
High Volatility: Option selling strategies
Low Volatility: Option buying strategies
There is no “best” strategy—only the right strategy for the right condition.
7. Adjustments Are More Important Than Entries
Many traders obsess over perfect entries, but professionals know that trade adjustments are what save losing positions.
Adjustments may include:
Rolling positions to a later expiry
Converting naked positions into spreads
Reducing risk by booking partial profits
Shifting strikes to balance delta
Option trading is dynamic. Flexibility and adjustment skills turn losing trades into manageable outcomes.
8. Discipline Beats Intelligence
Option trading does not reward intelligence alone—it rewards discipline and consistency. Traders lose money not because strategies fail, but because emotions take control.
Common emotional mistakes:
Overtrading after losses
Holding losing trades hoping for reversal
Booking profits too early out of fear
Breaking rules after one bad day
Successful traders follow a written trading plan and execute it without emotional interference.
9. Small Consistent Profits Compound Big Wealth
Another secret is that option trading is not about hitting jackpots. It is about small, consistent gains that compound over time.
Making:
2–3% per month consistently
can outperform risky strategies that aim for quick profits but blow up accounts.
Professional traders think in terms of monthly and yearly returns, not daily excitement.
10. Learning Never Stops
Markets evolve, volatility changes, and instruments behave differently over time. The best option traders continuously:
Review past trades
Analyze mistakes
Adapt strategies
Learn new market dynamics
Option trading is a skill that improves with experience, patience, and continuous education.
Conclusion
The real secrets of option trading are not hidden indicators or insider tips. They lie in understanding time decay, volatility, probability, and risk management. Option trading rewards traders who think logically, act patiently, and follow rules consistently.
If you treat option trading as a business rather than a gamble, focus on capital protection, and trade with discipline, options can become a powerful wealth-building tool over the long term.
How to Move Capital Smartly for Consistent Market ReturnsRotation Strategies Guide:
Rotation strategies are a powerful yet often misunderstood approach to investing and trading. At their core, rotation strategies focus on shifting capital from one asset, sector, or market to another based on changing market conditions, relative strength, and economic cycles. Instead of staying emotionally attached to a single stock or sector, rotation strategies encourage flexibility, discipline, and adaptability—key traits required for long-term success in financial markets.
This guide explains rotation strategies in depth, covering their logic, types, execution methods, benefits, risks, and practical application.
Understanding the Concept of Rotation
Markets are dynamic. Money constantly flows from one area to another. When one sector becomes expensive or loses momentum, capital often moves into another sector offering better growth or value. Rotation strategies aim to track and follow this flow of money rather than fighting it.
For example, during economic expansion, capital may rotate into cyclical sectors such as metals, infrastructure, and banking. In contrast, during uncertainty or slowdown, money may move into defensive sectors like FMCG, pharmaceuticals, or utilities. Rotation strategies attempt to capture these shifts early and ride them efficiently.
Why Rotation Strategies Matter
One of the biggest challenges for traders and investors is stagnation—holding assets that move sideways or decline while other opportunities outperform. Rotation strategies solve this problem by ensuring capital is always working in the strongest areas of the market.
Key reasons rotation strategies are important:
They help avoid long drawdowns
They improve risk-adjusted returns
They reduce emotional decision-making
They align trades with institutional money flow
They adapt naturally to changing market cycles
Instead of predicting tops and bottoms, rotation strategies focus on relative performance, which is more reliable and practical.
Types of Rotation Strategies
Rotation strategies can be applied at multiple levels depending on your trading or investing style.
Sector Rotation
This involves moving capital between sectors such as IT, banking, energy, pharma, and FMCG based on economic cycles, earnings growth, and momentum. Sector rotation is widely used by mutual funds and institutional investors.
Asset Class Rotation
Here, capital is rotated between equities, bonds, commodities, currencies, and cash. For example, during inflationary periods, money may rotate from bonds into commodities and equities.
Market-Cap Rotation
This strategy focuses on shifting between large-cap, mid-cap, and small-cap stocks. In early bull markets, large caps often lead. As confidence increases, capital rotates into mid and small caps for higher returns.
Style Rotation
Style rotation involves switching between growth, value, dividend, and momentum stocks based on market conditions and valuation cycles.
Time-Frame Rotation
Traders may rotate between short-term momentum trades and positional trades depending on volatility, trend strength, and market clarity.
How Rotation Strategies Work in Practice
Rotation strategies rely on relative strength analysis rather than absolute price movement. An asset does not need to be rising strongly; it only needs to perform better than alternatives.
Common tools used include:
Relative Strength (RS) or Relative Strength Index comparison
Sector and index performance ranking
Moving averages and trend analysis
Volume expansion and contraction
Ratio charts (one asset divided by another)
For example, if banking stocks outperform the broader index consistently while IT stocks underperform, rotation logic suggests shifting capital from IT to banking—even if both are rising.
The Role of Economic Cycles
Economic cycles play a crucial role in rotation strategies. Markets generally move through expansion, peak, contraction, and recovery phases. Each phase favors different sectors and assets.
Early Recovery: Banking, infrastructure, industrials
Expansion: Metals, capital goods, mid-caps
Late Cycle: FMCG, healthcare, quality large caps
Recession or Fear Phase: Gold, bonds, defensive stocks
Understanding these cycles allows traders and investors to anticipate rotations instead of reacting late.
Risk Management in Rotation Strategies
Rotation does not mean constant buying and selling without structure. Poor execution can increase transaction costs and emotional stress. Proper risk management is essential.
Important risk controls include:
Clear entry and exit rules
Defined rebalancing frequency (weekly, monthly, quarterly)
Stop-loss or relative underperformance exit
Position sizing based on volatility
Avoiding over-rotation during choppy markets
Rotation strategies work best when markets show clear leadership and trends. During sideways or range-bound conditions, patience is required.
Advantages of Rotation Strategies
Rotation strategies offer several long-term advantages:
Capital Efficiency: Money is allocated to stronger opportunities
Reduced Opportunity Cost: Avoids holding dead or weak assets
Lower Emotional Bias: Decisions are rule-based, not emotional
Adaptability: Works across different market environments
Consistency: Focuses on steady performance rather than big wins
For disciplined traders, rotation strategies often outperform random stock picking over time.
Common Mistakes to Avoid
Many traders fail with rotation strategies due to improper execution rather than flawed logic.
Common mistakes include:
Rotating too frequently without confirmation
Chasing late-stage outperformers
Ignoring transaction costs and taxes
Overcomplicating analysis
Lack of patience during transition phases
Successful rotation requires clarity, patience, and consistency.
Who Should Use Rotation Strategies
Rotation strategies are suitable for:
Swing traders looking for momentum leadership
Positional traders following sector trends
Long-term investors managing portfolios
Professionals seeking systematic allocation methods
They are especially useful for traders who prefer structure over prediction.
Conclusion
Rotation strategies are not about forecasting the future; they are about responding intelligently to what the market is already doing. By tracking relative strength, understanding economic cycles, and managing risk effectively, traders and investors can consistently stay aligned with market leadership.
In a world where markets constantly evolve, rotation strategies provide flexibility, discipline, and a logical framework to grow capital steadily. Those who master rotation learn a crucial truth of the market: money never disappears—it only moves. The key to success is learning how to move with it, not against it.

Part 10 Trade Like Institutions Option Buyers vs Option Sellers
Understanding the difference is crucial.
Option Buyers
Pay premium.
Have limited risk.
Profit only when market moves strongly in expected direction.
Time works against them due to premium decay.
Option Sellers (Writers)
Receive premium upfront.
Take unlimited or high risk.
Profit when market stays sideways or moves slowly.
Time works in their favor due to time decay.
This structure creates a balanced market between buyers and sellers.

TCS 1 Week Time Frame 📊 Weekly Price Range & Levels
Current share price is trading around ₹3,250–₹3,280 (recent data).
Key Weekly Resistance
R3 / Upper resistance: ~₹3,382–3,383 (stronger barrier)
R2: ~₹3,335
R1: ~₹3,293–3,315 (first hurdle)
Interpretation:
If price breaks above ₹3,315–₹3,335, bulls may aim toward ₹3,380+ this week.
Key Weekly Support
S1: ~₹3,203–₹3,258 (primary support zone)
S2: ~₹3,155–₹3,236
S3: ~₹3,113–₹3,200 (deeper support)
Interpretation:
Holding above ₹3,200–₹3,203 is key for short‑term strength. A break below ₹3,155 could signal weakness and extend the slide.
🟡 Summary Weekly Levels
Level Price Zone (Approx)
Strong Resistance ₹3,350–₹3,382
First Resistance ₹3,293–₹3,315
Current Range ~₹3,250–₹3,280
Support 1 ₹3,203–₹3,258
Support 2 ₹3,155–₹3,236
Support 3 ₹3,113–₹3,200
✅ Trading takeaway:
Short‑term buyers may look for strength above ₹3,315–₹3,335 to target ₹3,380+.
On the downside, watch ₹3,200 — below that, deeper support zones near ₹3,155–₹3,113 come into play.

Political instability can gold rebound to the previous ATH?Political instability: Venezuela’s President Maduro arrested – Can gold rebound to the previous ATH?
1️⃣ Market Context
The overall structure remains bullish.
Price is undergoing a short-term correction after a strong volatile move.
The 4300 area is acting as a key support zone.
RSI shows buy–sell convergence; bulls are gradually absorbing bears, keeping downside pressure well controlled.
2️⃣ News & Fundamental Factors
Geopolitical tension: Venezuela attacked by the U.S., President arrested and transferred to the U.S.
Expectation of a gap and bullish move in gold in the upcoming session.
Current news flow continues to support a positive outlook for gold.
3️⃣ Main Scenario
Priority scenario: Price holds above 4300 and resumes the bullish structure.
Key intraday levels to watch:
Support: 4300–431X, 4270–4275
Resistance: 4370–4375, 4402–4404
Focus on shallow pullbacks in line with the main trend.
4️⃣ Trading Strategy (Intraday / Weekly)
Trend-following remains the core approach, while being prepared for minor pullbacks to avoid missing moves.
Closely monitor price reactions at:
4300: Nearest support, currently holding well.
437X: Potential intraday reaction zone.
Always wait for price action confirmation, avoid entries in the middle of the range.
5️⃣ Extensions & Notes
If 4300 breaks decisively:
Deeper correction toward 427X, 425X
Further extension to 417X, a zone worth watching for swing opportunities.
Volatility remains high → risk management is the top priority.
✨ Wishing everyone a profitable new week.

HDFCBANK 1 Week Time Frame 📌 Current Context (approx live price):
HDFC Bank shares are trading around ~₹950–₹970 on NSE recently.
📊 Key Weekly Levels (Short‑Term)
Resistance Levels (Upside)
R1: ~ ₹1,009 – ₹1,010 — first major resistance this week.
R2: ~ ₹1,016 – ₹1,017 — stronger supply zone if the stock pushes higher.
R3: ~ ₹1,025 – ₹1,030 — extended resistance early next week if buyers continue.
Support Levels (Downside)
S1: ~ ₹988 – ₹990 — immediate support zone this week.
S2: ~ ₹974 – ₹975 — second support if selling pressure increases.
S3: ~ ₹967 – ₹970 — lower band of the expected weekly trading range.
Projected Weekly Range:
👉 ~₹967 – ₹1,030 based on weekly pivot calculations and technical outlook.
🔍 How to Use These Levels This Week
Bullish scenario:
A sustained close above ~₹1,009–₹1,010 on daily closes could push price toward ₹1,016–₹1,030 in the next few sessions.
Bearish / stress scenario:
A break and close below ~₹974–₹970 could open space toward the ₹950–₹940 area (short‑term demand zones).

How to Avoid Breakout Traps in TradingUnderstanding What a Breakout Trap Is
A breakout trap occurs when price appears to break an important level such as support, resistance, trendline, or chart pattern boundary, but fails to sustain that move. Instead of continuing in the breakout direction, the market reverses and moves aggressively in the opposite direction. Retail traders often enter late on excitement or fear of missing out, while smart money uses this liquidity to exit or enter opposite positions. Recognizing that markets are driven by liquidity rather than obvious patterns is the first step in avoiding breakout traps.
Importance of Market Context
One of the most effective ways to avoid breakout traps is to analyze the broader market context. Breakouts behave differently depending on whether the market is trending, ranging, or highly volatile. In a strong trending market, breakouts are more likely to succeed. In contrast, range-bound or choppy markets tend to produce frequent false breakouts. Traders should always ask: Is the market trending or consolidating? Entering breakout trades in tight ranges without strong momentum significantly increases the probability of getting trapped.
Volume as a Confirmation Tool
Volume is a critical factor in validating breakouts. A genuine breakout is usually supported by a noticeable increase in volume, reflecting strong participation and conviction. False breakouts often occur on low or average volume, indicating a lack of commitment. If price breaks a level but volume remains weak or declines, it is a warning sign that the move may fail. Traders should avoid entering breakouts that lack volume confirmation and instead wait for clear signs of market participation.
Waiting for Candle Close Confirmation
Many breakout traps happen because traders enter positions the moment price crosses a level. Professional traders often wait for a candle close beyond the breakout level on the chosen timeframe. A close confirms that the market accepted the new price area rather than rejecting it. For example, if resistance is broken intraday but the candle closes below it, the breakout has failed. Patience in waiting for confirmation significantly reduces false entries.
Role of Retest and Pullback
One of the safest ways to trade breakouts is to wait for a retest of the broken level. After a true breakout, price often pulls back to test the former resistance (now support) or former support (now resistance). If the level holds and price shows rejection signals such as strong bullish or bearish candles, the probability of a successful trade increases. Breakout traps often fail during retests, making this approach a powerful filter against false signals.
Avoiding News and High-Volatility Periods
Major economic news, earnings announcements, and central bank decisions often create sharp price spikes that look like breakouts but quickly reverse. These moves are driven by short-term volatility rather than sustainable trend shifts. Trading breakouts during such periods is risky unless one is experienced with news-based strategies. To avoid traps, traders should be aware of the economic calendar and either reduce position size or stay out of the market during high-impact events.
Using Multiple Timeframe Analysis
Analyzing multiple timeframes helps traders identify stronger and more reliable breakouts. A breakout that aligns with higher timeframe trends has a greater chance of success. For example, a breakout on a 15-minute chart that goes against the daily trend is more likely to fail. Checking higher timeframes for trend direction, key levels, and market structure can prevent traders from entering low-probability breakout trades.
Recognizing Liquidity Zones and Stop Hunts
Markets often move toward areas where stop-loss orders are clustered, such as above obvious resistance or below clear support. Smart money may intentionally push price beyond these levels to trigger stops and create liquidity before reversing. Traders should be cautious of breakouts at obvious levels that everyone is watching. Instead of entering immediately, observe price behavior to see whether the breakout is accepted or quickly rejected.
Risk Management and Position Sizing
Even with the best analysis, some breakout traps are unavoidable. Effective risk management ensures that a single false breakout does not cause significant damage. Using predefined stop-loss levels, limiting risk per trade, and maintaining proper position sizing are essential. Stops should be placed logically, not emotionally, and traders should accept small losses as part of the trading process rather than trying to avoid losses entirely.
Emotional Discipline and Patience
Breakout traps often exploit trader psychology, particularly fear of missing out and overconfidence. Emotional trading leads to impulsive entries and poor decision-making. Developing discipline, sticking to a trading plan, and accepting that not every breakout needs to be traded are crucial skills. Sometimes the best trade is no trade, especially when conditions are unclear.
Continuous Review and Learning
Finally, avoiding breakout traps requires continuous learning and self-review. Traders should maintain a journal documenting breakout trades, noting which ones succeeded and which failed. Over time, patterns emerge that highlight common mistakes and areas for improvement. Learning from past traps transforms losses into valuable lessons and strengthens overall trading performance.
Conclusion
Breakout traps are an inevitable part of trading, but they do not have to be devastating. By understanding market context, using volume and confirmation tools, waiting for retests, applying multi-timeframe analysis, and practicing strong risk management, traders can significantly reduce the impact of false breakouts. Success in breakout trading is not about catching every move, but about filtering out low-quality setups and focusing on high-probability opportunities. With patience, discipline, and experience, traders can turn breakout traps from costly mistakes into powerful learning experiences.

Part 6 Introduction to Institutional TradingArbitrage and Risk-Free Strategies
Options allow for advanced structures like:
Box spreads
Conversion and reversal
Put-call parity arbitrage
These take advantage of price differences between options, futures, and stocks to make risk-free or low-risk profit.
Arbitrage is widely used by:
Quant traders
HFT firms
Institutions
This adds liquidity and efficiency to the market.

Part 4 Introduction to Institutional TradingEvent-Based Trading
Events create massive volatility:
Elections
RBI meetings
Union Budget
US Fed statements
Quarterly results
Geo-political events
Traders use options to position themselves strategically for such events.
Examples:
Buying straddles on Budget Day
Selling strangles when results are over
Using spreads when expecting a one-sided breakout
Event-based trading is where options shine.

Part 1 Ride The Big Moves Example Use Cases in Different Market Conditions:
Market Condition Strategy
Trending Up Long Call, Bull Call Spread, Call Ratio
Trending Down Long Put, Bear Put Spread
Sideways Iron Condor, Short Straddle, Short Strangle
High Volatility Long Straddle/Strangle
Low Volatility Credit Spreads

Divergence Secrets Leverage: Control Big Value With Small Capital
Options are inherently leveraged instruments, meaning you control a large contract value by paying only a small premium.
Example:
Suppose Bank Nifty is at 49,500.
Buying the index in futures may require a margin of ₹1.5–2 lakh.
But buying a 49,500 CE may cost only ₹200–₹300 per lot.
This means a trader can participate in the same price move with:
10x–50x lower capital
Better capital efficiency
More flexibility in managing risk
Leverage is a double-edged sword, but when used with discipline and structure, it can generate powerful results.

Introduction to Option TradingUnderstanding the Foundation: What Makes Options Special?
Before diving into the benefits, it’s important to understand why options are structurally different from other trading instruments.
An option gives the buyer the right, but not the obligation, to buy or sell an asset at a specific price before a specific time.
Call Option: Right to buy
Put Option: Right to sell
This right without obligation is the core feature that creates asymmetric returns.
When you buy an option:
Your maximum loss is capped at the premium paid.
Your profit can be extremely large, depending on the underlying move.
This asymmetric nature—limited downside, unlimited upside (for calls)—makes options fundamentally attractive.

JIOFIN 1 Day Time Frame 📌 Current Price (Approx):
~₹297.7–₹300.5 range this morning on NSE (latest intraday data)
📊 🔹 Daily Technical Levels (1‑Day Timeframe)
Pivot & Range (Today)
Pivot Point: ~₹300
Day Low / High Today: ~₹296.7 – ₹302.3
Resistance Levels
1️⃣ R1: ~₹305
2️⃣ R2: ~₹308
3️⃣ R3: ~₹312
Support Levels
1️⃣ S1: ~₹297
2️⃣ S2: ~₹293
3️⃣ S3: ~₹290
📈 How to Use These Levels Today
✔ Bullish scenario:
A sustained break above ₹305‑₹308 with volume can push price higher to ₹312+.
✔ Bearish scenario:
A breakdown below ₹297 could expose ₹293 and further ₹290 supports.
✔ Key pivot to watch:
₹300 — above keeps short‑term neutral/bullish; below may skew bears.
🕒 Intraday Context
Price is trading mixed around ₹298–₹302, indicating a neutral bias today unless levels are decisively broken.

PCJEWELLER 1 Month time Frame 📊 📌 Current Price Snapshot
Approx current price: ~₹10.14–₹10.30 per share (Jan 5–6, 2026) based on live market data.
52‑week range: ₹8.67 low → ₹19.65 high.
Recent trend: Up from late‑Dec lows but still below major longer moving averages.
📈 1‑Month Technical Levels
🛑 Resistance (Upside)
These are levels where sellers might step in:
₹10.55–10.60: 1st resistance area (near recent daily pivots).
₹10.85–11.25: Next resistance cluster from pivot calculations.
Above ₹11.30: More structural resistance — recent EMA/SMA levels (50‑100 day) lie around this broader zone.
💡 A break above ~₹10.85–11.25 with strong volume would be needed to shift momentum more bullishly in the next few weeks.
🧱 Support (Downside)
Key floors where buyers might appear:
₹9.85–9.96: Immediate support, including pivot support and volume accumulation zone.
₹9.45–9.50: Secondary support below near recent lows.
₹8.80–8.70: Strong broader support near 52‑week range lows (bearish fallback).
📌 Trading Range Summary (1‑Month View)
Scenario Level
Immediate Support Zone ₹9.85–₹9.96
Bearish Break Support ₹9.45 → ₹8.80
Resistance Zone ₹10.55–₹10.85
Bullish Break Target Above ₹11.25

CANDLESTICK PATTERNSCandlestick patterns originated in Japan in the 1700s for analyzing rice markets. Today, they are used worldwide in stocks, forex, commodities, and crypto. Each candle represents four values – Open, High, Low, Close (OHLC) – and reflects market sentiment, strength, and trader behavior.
Candlestick patterns are divided into:
A. Reversal Patterns
B. Continuation Patterns
C. Indecision Patterns
D. Complex Multi-Candle Patterns

RECLTD 1 Day Time Frame 📌 Latest Price (daily close / recent session): ~ ₹380–₹381 on NSE (previous close ~₹367.70; intra‑day ranged ~₹369.5–₹384).
📊 Daily Time‑Frame Key Levels
🎯 Pivot Levels (from recent pivot data)
Daily Pivot (PP): ~ ₹378.0–₹382.1
🚀 Resistance Levels
1. R1: ~ ₹383–₹386 — 1st resistance zone facing immediate sellers.
2. R2: ~ ₹392–₹393 — next resistance above near recent highs.
3. R3: ~ ₹401–₹402+ — strong resistance region above recent consolidation.
🛡 Support Levels
1. S1: ~ ₹372–₹374 — first key support near intraday consolidation.
2. S2: ~ ₹363–₹365 — secondary support zone from pivots/EMA/SMA clusters.
3. S3: ~ ₹332–₹338 — major lower support (52‑week lows zone).
📌 Interpretation (Daily Time Frame)
Above pivot ~₹380 → short‑term bullish bias; buyers prefer R1→R2 targets.
Below pivot (~₹378) → risk of pullback toward S1/S2.
Strong break below ₹365 → deeper correction potential toward ₹350+ region.
**Upside break above ₹392–₹395 → momentum can extend toward R3 near ₹400+.

AXISBANK 1 Day Time Frame 📌 Current Price (Approx)
• Axis Bank NSE price ~ ₹1,270 – ₹1,285 range (latest available live price on NSE)
📊 Daily Pivot & Standard Levels (1D Time Frame)
🔹 Pivot Point (Daily): ~ ₹1,271 – ₹1,275
📈 Immediate Upward Targets / Resistances:
• R1: ~ ₹1,277 – ₹1,280
• R2: ~ ₹1,288 – ₹1,295
• R3: ~ ₹1,300 – ₹1,305
📉 Support Levels:
• S1: ~ ₹1,260 – ₹1,265
• S2: ~ ₹1,250 – ₹1,255
• S3: ~ ₹1,240 – ₹1,245
📈 Additional Notes
• According to technical analysis sites, the short‑term trend has mixed signals (some oscillators show neutral to buy bias).
• RSI/MACD and moving averages (like 5/20/50 DMA) can add confirmation before breakout or breakdown.
🧠 How Traders Use These Levels Today
Bullish Scenario:
If price holds above pivot (~₹1,271–₹1,275) and breaks R1 (~₹1,277–₹1,280) with volume → watch R2/R3 (~₹1,288–₹1,305) zones for profit‑taking.
Bearish Scenario:
Sustained close below pivot with low volume → watch S1/S2 (~₹1,260–₹1,255) for intra‑day support tests.
