Premium Chart Patterns Knowledge How to Trade Chart Patterns
To trade chart patterns effectively:
A. Identify the Trend First
Reversal patterns work best after strong trends.
Continuation patterns form within established trends.
Trend context increases accuracy.
B. Wait for Confirmation
Never act only on shape.
Confirmation includes:
Breakout from neckline or trendline
Increase in volume
Candle close beyond levels
C. Set Entry Points
Examples:
Breakout above resistance (for bullish patterns)
Breakdown below support (for bearish patterns)
D. Stop Loss Placement
Stops should go:
Below breakout candle (bullish)
Above breakout candle (bearish)
Below/above swing points
Patterns help define natural risk zones.
E. Target Calculation
Most patterns offer measurable targets:
Double top/bottom: Height of pattern projected from breakout
Triangles: Base length projected from breakout
Flags: Length of flagpole added to breakout
This helps set realistic profit expectations.
Trendlinebounce

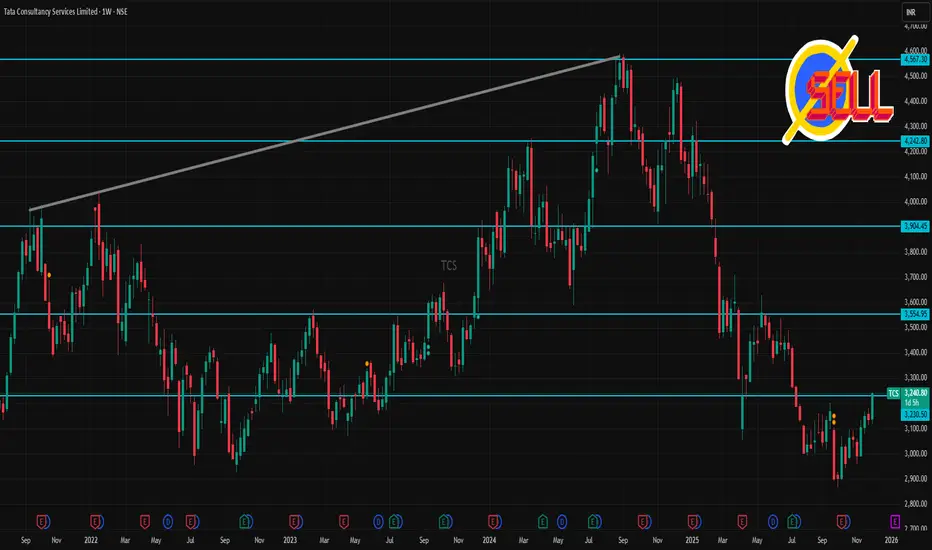
TCS 1 Week Time Frame 🔎 Recent snapshot
According to a recent technical‑analysis update, TCS has support near ₹2,970–₹2,870 and resistance near ₹3,170, ₹3,207, ₹3,270 on the shorter‑term charts.
On a weekly / medium‑term view, some oversold‑indicator signals have been flagged, suggesting the stock could attempt a rebound if support holds.
Analysts’ longer‑term target (12‑month) sits around ₹3,505–₹3,470, implying moderate upside from current levels.
⚠️ What could derail upside
If the stock falls below the lower support of ~₹2,870‑₹2,950, it may test deeper support zones.
Mixed signals from oscillators (some suggest bearish momentum) could limit strong short‑term rallies.
🎯 My take (for 1‑week traders)
TCS seems to be in a consolidation/neutral posture — the next few days could be defined by support‑vs‑resistance play. If you trade short‑term, the ~₹3,030–₹3,170 band defines a likely “play zone.” A decisive move beyond that could hint at short‑term trend direction.
PCR Trading Strategies Tips to Increase Your Profitability
✓ Trade with trend
Avoid buying OTM options randomly. Wait for momentum.
✓ Use volume profile & market structure
This helps identify breakout zones, reversal points, and premium traps.
✓ Avoid trading against volatility
Buy in low IV, sell in high IV.
✓ Don’t hold losing positions
Options decay fast → exit quickly if the market goes against you.
✓ Use hedged strategies
Spread strategies reduce risk and stabilize profits.

Divergence Secrets How Volatility Affects Profits
Volatility (VIX or IV) is another major factor.
You profit when:
IV goes up after you buy options
IV goes down after you sell options
High volatility = high premium
Low volatility = low premium
This is why buying options ahead of big events (Budget, elections, results) is riskier—IV may crash afterward.

Option Chain Analysis Time Decay (Theta): A Major Profit Source
Time decay is a predictable reduction in premium as expiry approaches.
How Theta works:
Buyers lose money daily if the price does not move.
Sellers gain money daily even if nothing happens.
Example:
Premium at start of week: ₹200
No price movement
By expiry: ₹20
Sellers keep ₹180 simply because time passed.

Part 2 Trading Master ClassHow Option Sellers Earn Profit
Option sellers (writers) make money very differently from buyers.
Sellers earn through:
Premium collection
Time decay (Theta) working in their favor
Market staying within a defined range
Selling gives higher probability of profit but unlimited risk if the market moves aggressively.
Example:
You sell Bank Nifty 49,000 CE at ₹220
Market stays sideways or falls
Premium collapses to ₹30
Your Profit = (220 – 30) × Lot Size
This profit results from the sold option expiring worthless.

Part 1 Trading Master ClassHow Put Options Generate Profit
A Put Option gives you the right to sell an asset at a fixed strike price.
You profit from a put when:
Underlying price moves below strike
Premium increases because market falls
Example:
Nifty at 22,000
You buy Put 22,000 PE for ₹100
Market falls to 21,700
Premium rises to ₹210
Your Profit = (210 – 100) × Lot Size
Put buyers make money when markets fall, similar to short selling but with limited risk.

Part 2 Support and Resistance How Call Options Generate Profit
A Call Option gives you the right—but not obligation—to buy an asset at a fixed price (strike price).
You profit from a call option when:
The market price goes above the strike price.
The premium increases due to:
Price movement
Increased volatility
Reduced time to expiry near ITM levels
Example:
Nifty trading at 22,000
You buy Call 22,000 CE at ₹120
Price moves to 22,200
Premium increases to ₹200
Your Profit = (200 – 120) × Lot Size
This profit comes without buying the actual index—just the premium appreciation.

Part 1 Support and Resistance Understanding the Foundation of Option Profits
Before diving into strategies, two basic forces determine profit in options:
A. Price Movement of the Underlying
If the underlying asset (stock, index, commodity) moves in the direction you expect, your option gains value.
Calls gain when price goes up
Puts gain when price goes down
B. Premium (Option Price)
Premium is the amount you pay (for buyers) or receive (for sellers/writers).
Profit/loss happens based on how this premium changes.

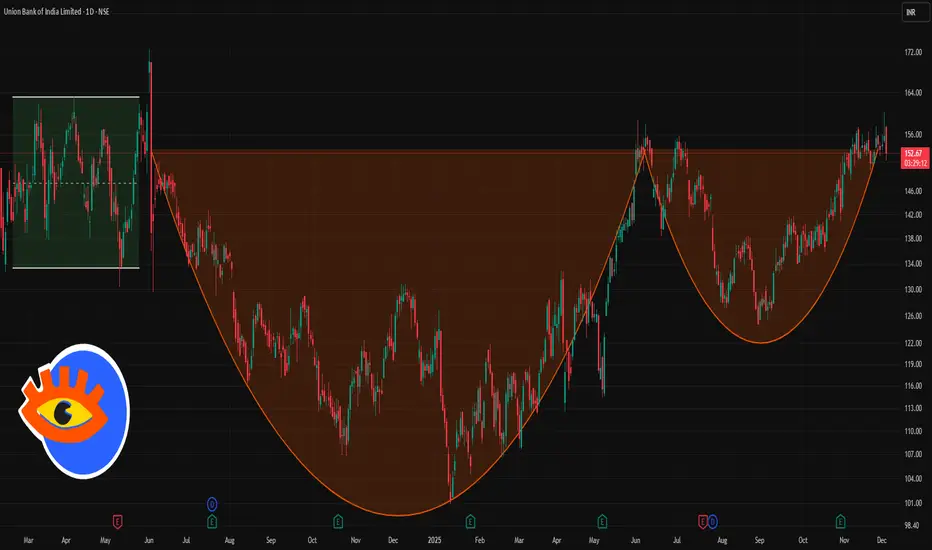
UNIONBANK 1 Day Time Frame 📊 Key Price Levels Today
Recent closing / last traded price: ~ ₹ 152.9 – ₹ 153.
Day’s high / observed swing high: ~ ₹ 160.10 – ₹ 160.15.
Day’s low / support area: ~ ₹ 151–152 zone (recent low and current price region).
52‑week high: ~ ₹ 160.15
52‑week low: ~ ₹ 100.81
✅ What This Means for Traders
For short‑term traders: buying near ₹ 152–153 with stop‑loss slightly below could make sense, with a target / resistance zone around ₹ 158–160.
If the stock breaks above ₹ 160 with strong volume, bullish momentum may push it higher, but watch for profit‑booking.
Risk‑aware traders should note that volatility is present — intraday swings of ₹ 6–8 (or more) are visible, so manage position size accordingly.
Part 8 Trading Master ClassLong Put – Best for Bearish Markets
This is the opposite of a long call.
How it works
You buy a put option.
Profit when price drops below strike.
When to use
You expect a sharp fall.
You want a cheap hedge for your portfolio.
Risk and reward
Risk: Limited to premium paid.
Reward: Large profit as price falls.
Example
You buy 48,000 put on Bank Nifty for ₹80.
If BN falls to 47,500, the option may rise to ₹600.

Part 6 Learn Institutional Trading Cash-Secured Put – Best for Buying Stocks at Lower Price
This is the safest way to use options when you want to accumulate stocks at a discount.
How it works
You set aside cash.
You sell a put option at a lower strike price.
If the stock falls below strike, you get the shares at a discount.
If not, you keep the premium.
When to use
You want to buy shares at cheaper levels.
You are comfortable owning the stock.
Risk and reward
Risk: You may need to buy shares if the stock falls heavily.
Reward: Limited to premium collected.
Example
Bank Nifty at 50,000
Sell 49,500 put at ₹100 premium
If Bank Nifty stays above 49,500 → you earn ₹100 × lot size.

Part 3 Learn Institutional Trading Implied Volatility (IV)
IV measures expected market movement.
High IV → expensive premiums
Low IV → cheap premiums
Events like RBI policy, election results, or earnings reports increase IV.
Traders use IV to decide:
When to buy options (low IV)
When to sell options (high IV)

Part 2 Ride The Big MovesThe Role of Time Decay (Theta)
Options lose value as time passes. This is called time decay.
If you are an option buyer, time is your enemy.
If you are an option seller, time is your friend.
Near expiry, premium drops rapidly.
This is why many intraday traders take advantage of selling options during low volatility.

Smart Liquidity Trading StrategiesWhat Is Liquidity?
Liquidity refers to orders waiting to be executed—stop losses, limit orders, breakout orders, etc. These orders accumulate in predictable areas:
Above swing highs
Below swing lows
Near major support or resistance
Around imbalance zones
At psychological levels (like 50, 100, 1000)
Institutional traders know retail traders place stops in these obvious areas. So the market often moves first to collect these orders, then reverses to the real direction.
This mechanism is often referred to as:
Stop hunting
Liquidity sweep
Stop-loss raid
Smart money trap
Smart liquidity strategies attempt to take advantage of these manipulations.
Core Concepts Behind Smart Liquidity Trading
Below are the key building blocks every trader must understand before applying smart liquidity strategies.
1. Liquidity Pools
Liquidity pools are zones where large groups of traders have placed orders. Markets gravitate toward these pools to fill big institutional orders.
Two main types exist:
a) Buy-side liquidity (BSL)
This sits above swing highs.
Breakout buyers place buy stops.
Sellers place stop losses above highs.
When price moves up to sweep these, big players offload large sell positions.
b) Sell-side liquidity (SSL)
This sits below swing lows.
Breakout sellers place sell stops.
Buyers place their stop losses below lows.
Price often dips to sweep these orders before a sharp reversal upward.
2. Liquidity Grabs / Sweeps
These are fast price moves beyond a key high or low followed by sharp rejection.
This signals that:
Liquidity has been collected.
Big traders have executed their orders.
A reversal is highly probable.
Example:
Price breaks a major high → retail buys breakout → institutions sell into that buy-side liquidity → market reverses.
3. Market Structure Shifts
Once liquidity is taken, the next signal is a Market Structure Shift (MSS) or a Change of Character (CHOCH).
It shows that the previous trend ended and a new one is forming.
After sweeping sell-side liquidity, a bullish MSS means price is ready to move up.
After sweeping buy-side liquidity, a bearish MSS indicates downward movement.
This combination—liquidity sweep + structure shift—is the foundation of smart liquidity strategies.
4. Imbalance and Fair Value Gaps (FVG)
When institutions aggressively enter trades, price moves fast and leaves an imbalance—an area where few or no trades happened.
These gaps often get revisited later.
A typical smart liquidity sequence:
Liquidity sweep
Market structure shift
Price retraces to imbalance (FVG)
Smart entry zone triggers
This provides high-probability and low-risk setups.
Smart Liquidity Trading Strategies
Now let’s break down the most effective strategies used by traders following institutional and smart money concepts.
1. Liquidity Sweep + Market Structure Shift Strategy
This is the most popular and powerful strategy.
Steps:
Identify liquidity pool
Above previous highs (BSL)
Below previous lows (SSL)
Wait for price to sweep the liquidity
A quick wick or candle body breaching the zone.
Wait for Market Structure Shift (MSS)
A break in the current trend.
Enter on retracement
At the origin of displacement
Or at a fair value gap (FVG)
Place stop-loss
Below the sweep (for long)
Above the sweep (for short)
Target next liquidity pool
This strategy works on all timeframes.
2. Breaker Block Strategy (Post-Liquidity Grab)
Breaker blocks form when a previous support or resistance zone fails after liquidity collection.
Logic:
Market grabs liquidity beyond a key level.
Price reverses and breaks that level.
The broken zone becomes a powerful entry block.
How to trade:
Identify failed high/low.
Mark the breaker block.
Wait for a retest.
Enter with stop behind the block.
Breaker blocks are highly effective in trending markets.
3. Equal Highs / Equal Lows Targeting
Equal highs or lows attract liquidity because traders place stops or entries in these zones.
Smart traders:
Anticipate sweeps of equal highs/lows.
Enter after sweep.
Target the next liquidity level.
Double-top and double-bottom formations often become liquidity traps.
4. Inducement Strategy
Inducement refers to false setups designed to lure retail traders.
Example:
A mini double-top forms below a larger liquidity pool. Retail shorts early, providing liquidity for institutions to run the real move.
Steps:
Identify small equal highs/lows.
Understand they often induce premature entries.
Expect price to sweep inducement liquidity first.
Enter after true liquidity sweep at the major level.
This prevents entering too early.
5. Liquidity Mapping Multi-Timeframe Strategy
Smart traders never trade on one timeframe. Liquidity must be aligned.
Steps:
HTF (Daily/4H)
Identify major liquidity pools (key highs/lows).
MTF (1H/15M)
Identify intermediate liquidity and imbalance.
LTF (1M/5M)
Look for sweep + MSS to refine entries.
This produces sniper entries with minimal stop-loss.
6. Liquidity Void / Imbalance Filling Strategy
Markets often:
Create a liquidity void (fast, one-sided movement).
Later return to fill that void.
Continue moving in original direction.
Traders enter when price enters the imbalance and shows structure shift.
Why Smart Liquidity Strategies Work
Traditional indicators often lag and don’t explain why price behaves a certain way.
Smart liquidity strategies work because they are based on market logic:
Institutions cannot enter without liquidity.
Retail traders place predictable stop-losses.
Market makers move price to where orders sit.
Liquidity hunts are deliberate, not random.
Price must rebalance inefficiencies.
This makes smart liquidity trading a powerful approach for anticipating market manipulation and aligning with institutional flow.
Advantages of Smart Liquidity Strategies
✔ High accuracy
✔ Trades align with institutional flow
✔ Low stop-loss and high risk-to-reward
✔ Clear rule-based structure
✔ Works across forex, stocks, crypto, indices, commodities
✔ Helps avoid retail traps and fake breakouts
Final Thoughts
Smart liquidity trading strategies are not magic—they are based on understanding how institutional players operate. By learning to identify liquidity pools, sweeps, market structure shifts, imbalance zones, and inducement setups, traders gain a powerful edge over the market.
The key is patience:
You wait for liquidity to be swept, then enter on confirmation—not before.
Master this discipline, and your trading becomes more precise, logical, and consistently profitable.
Small Account Challenges for Indian Traders1. Limited Capital and High Risk Exposure
The primary and most obvious challenge for small account traders is limited capital. With a small account, traders are compelled to take higher risk positions, which often leads to:
A. Overleveraging
Indian brokers offer leverage mainly for intraday equity trades, but in recent years, SEBI regulations have significantly reduced the leverage available.
Small account traders often feel forced to:
Use full margin or near-full margin
Take oversized positions to achieve meaningful returns
Try to flip positions quickly to cover brokerage, taxes, and charges
This increases the probability of a margin call or forced liquidation.
B. Inability to Absorb Drawdowns
Markets naturally move in cycles of profits and losses. A small loss of ₹500 may be negligible for a trader with ₹5 lakh capital but can feel devastating for someone starting with ₹5,000.
This creates emotional stress and leads to irrational decisions like revenge trading.
2. Brokerage, Taxes, and Trading Charges Eat Into Profits
Trading in India involves multiple cost elements:
Brokerage
STT/CTT
Exchange Transaction Charges
GST
SEBI Fees
Stamp Duty
Slippage
For small accounts, these charges form a disproportionately large percentage of the capital. For example:
A trader with ₹10,000 may lose up to 1–2% per trade in costs alone.
Frequent intraday trading becomes unviable when costs exceed potential profits.
This pushes many small account traders toward high-risk segments like options buying, which has lower capital requirements but high volatility.
3. Pressure to Make Quick Profits
Indian traders with small accounts often enter the market with the mindset:
“I need to double this account fast.”
“I want to make monthly income from ₹10,000 capital.”
“I will start small and become full-time in a few months.”
This creates unrealistic expectations, leading to:
Overtrading
Aggressive option buying
Fear of missing out (FOMO)
Emotional swings
Impulsive decisions
The expectation to grow capital rapidly is one of the biggest psychological traps.
4. Limited Access to Diversification
With small capital, it’s difficult to diversify across:
Stocks
Sectors
Time frames
Trading strategies
Most small traders put all their capital into a single stock or a single futures or options position, which increases portfolio risk dramatically. A single bad trade can wipe out the account.
5. Options Buying Addiction
Because equity and futures require higher capital, small traders gravitate toward options buying, particularly:
Weekly Nifty/Bank Nifty options
Zero day expiry (0DTE) trades
Far OTM options
While these instruments offer high reward potential, they also carry:
Very fast time decay
High volatility risk
Frequent whipsaws
Low probability of consistent profitability
Most small account traders get trapped in a cycle of quick profits followed by large losses, ultimately destroying their capital.
6. Difficulty Implementing Proper Risk Management
Risk management requires rules like:
Risk 1–2% per trade
Maintain stop-loss discipline
Control position size
However, with small accounts, applying these rules becomes nearly impossible.
For example, with ₹10,000 capital:
1% risk = ₹100
Most trades cannot be structured within such tight risk limits
Even brokerage and charges exceed the risk budget
Thus, small traders are almost forced to violate risk rules, making professional-level discipline difficult to maintain.
7. Emotional and Psychological Challenges
Small account trading is mentally draining because:
Every loss feels bigger than it is.
Every profit seems insufficient.
A few losing trades can wipe out weeks of effort.
Fear of losing capital creates hesitation.
Greed pushes traders to take oversized bets.
This emotional instability leads to:
Overtrading
Lack of patience
Jumping between strategies
Chasing trending stocks
Continual strategy switching
Psychology becomes a greater barrier than capital itself.
8. Limited Access to Tools, Data, and Learning Resources
Professional traders use:
Advanced charting platforms
Real-time data feeds
Premium screeners
Algorithms and automation
Backtesting tools
For a small account trader, these tools feel expensive and unaffordable.
As a result, they rely on:
Free charting websites
Social media tips
Influencer trades
Telegram groups
Many of these sources are unreliable, biased, or manipulated.
9. Lack of Experience in Market Cycles
Small traders often enter the market during bull phases, where:
Almost every trade gives profit
Stocks keep rising
Market sentiment is positive
When the market shifts into a volatile or bearish phase, small traders struggle to adapt.
They lack experience in handling:
Downtrends
Range-bound markets
High volatility periods
Event-driven uncertainty
This inexperience leads to heavy losses.
10. Compounding Takes Time—People Want Immediate Results
Growing a small account through disciplined compounding requires:
Patience
Persistence
Realistic targets
Long-term vision
However, many small traders want:
Quick doubling
Daily profits
Constant action
High returns instantly
This mindset contradicts the reality of compounding, which is slow but powerful over time.
11. Social Pressure and Unrealistic Comparisons
Many traders compare themselves to:
Influencers showing big profits
Experienced traders posting daily screenshots
People claiming to double accounts regularly
This comparison creates unnecessary pressure, causing small traders to take irrational risks just to match those results.
Most don’t realize that successful traders today started small themselves—but with years of experience.
Conclusion
Small account trading is challenging in India due to limited capital, high transaction costs, emotional stress, and structural market restrictions. However, success is still possible with realistic expectations, disciplined risk management, and a focus on long-term skill development instead of quick profits.
By understanding these challenges deeply, Indian traders can avoid common traps, preserve their capital, and slowly build a strong foundation for future growth.
Global Market Shifts1. Technological Acceleration and Digitalization
Technology is one of the most powerful drivers of global market shifts. The acceleration of artificial intelligence, automation, blockchain, robotics, and data analytics is redefining industries from manufacturing to banking.
Automation has altered the cost dynamics of production, enabling companies to relocate certain activities back to their home countries despite previously outsourcing them to low-cost regions. This phenomenon, often referred to as reshoring or nearshoring, is driven by the desire for supply chain resilience and reduced dependency on global disruptions.
The digital economy has also enabled new business models. E-commerce, online services, cloud computing, and fintech innovations have created trillion-dollar markets and revolutionized consumer behavior. From remote work to digital payments, technology is not only transforming markets—it is reshaping the very structure of the global workforce and how companies operate.
Artificial intelligence has become a strategic asset for nations. Countries are competing to develop advanced AI capabilities, which has deep implications for productivity, defense, and global leadership. As AI integrates deeper into supply chains and decision-making, markets will continue to shift around countries with the most advanced digital infrastructure and innovation ecosystems.
2. Geopolitical Realignments and Trade Fragmentation
Global markets are increasingly influenced by geopolitics. Traditional alliances are being restructured, rivalries are intensifying, and economic power is becoming more multipolar.
The most notable geopolitical shift involves strategic competition between major powers—especially between large economies such as China, the United States, and other emerging regions. Trade wars, tariff battles, technology restrictions, and security concerns have introduced new uncertainties into global markets.
Countries are seeking strategic autonomy by diversifying their economic dependencies. This has resulted in the rise of regional trading blocs, bilateral agreements, and supply-chain partnerships based on political alignment rather than pure efficiency.
As global economic integration slows, companies must adapt to a fragmented trading environment where geopolitical risks directly impact currency markets, commodity prices, financial flows, and investment decisions.
3. Monetary Policy Shifts and Inflation Cycles
A major global market shift arises from changes in monetary policy, particularly from central banks in advanced economies. Inflation surges and interest rate cycles influence everything from asset valuations to consumer borrowing costs.
In recent years, inflation has resurfaced as a central challenge. Central banks responded with aggressive interest rate hikes, reshaping equity markets, bond yields, housing sectors, and currency movements.
Higher interest rates tend to strengthen currencies, reduce liquidity, increase the cost of capital, and cool down overheated markets. As rates rise or fall, global investors reallocate funds across emerging and developed markets.
These monetary shifts ripple through the world economy, affecting trade balances, debt sustainability, and foreign investment flows. Countries with high levels of external debt face heightened vulnerability when global liquidity tightens.
4. Supply Chain Reconfiguration
The global supply chain system that dominated the last few decades is undergoing significant transformation. For years, companies optimized supply chains for efficiency and low cost, relying heavily on global production networks.
However, recent disruptions—ranging from pandemics to shipping bottlenecks and geopolitical tensions—highlighted the fragility of hyper-globalized supply systems.
This has led to several structural shifts:
Reshoring: Bringing production back to home countries.
Nearshoring: Moving manufacturing closer to major consumer markets.
Friendshoring: Sourcing from politically aligned nations.
Multi-sourcing: Avoiding reliance on single suppliers.
Supply chains are becoming more diversified and resilient, but this transition increases costs in the short term. Markets are adjusting to a new reality where security and predictability often outweigh efficiency.
Industries like semiconductors, pharmaceuticals, EV batteries, and critical minerals are at the center of this supply chain revolution.
5. Energy Transition and Sustainability Trends
Another major global market shift is the transition from fossil fuels to cleaner energy sources. Climate change concerns, government mandates, and consumer expectations have accelerated the shift toward renewable energy, electric vehicles, sustainable manufacturing, and green finance.
Countries are investing billions in solar power, wind energy, hydrogen, and other low-carbon solutions. The energy transition is also reshaping commodity markets. Demand for oil may fluctuate, while demand for metals like lithium, cobalt, nickel, and rare earth elements is increasing rapidly.
Companies across all sectors are facing pressure to reduce emissions, adopt ESG (Environmental, Social, Governance) frameworks, and disclose carbon footprints. As sustainability becomes a competitive advantage, global capital is flowing towards greener projects.
This transition is not uniform. Some regions move faster while others rely on traditional energy sources. This creates a dynamic global landscape where new energy leaders emerge while others adapt gradually.
6. Shifting Consumer Preferences and Demographics
Global demographics are changing dramatically. Developed countries face aging populations, while emerging markets have young, expanding workforces. Consumption patterns are shifting accordingly.
Younger generations prioritize digital-first experiences, eco-friendly products, and personalized services. Meanwhile, rising middle classes in developing countries are driving demand for technology, healthcare, transportation, and modern retail.
The global consumer is becoming more interconnected yet more diverse. Companies must navigate cultural preferences, regulatory environments, and economic conditions across different markets.
These demographic forces have long-term implications, influencing everything from labor markets and productivity to healthcare demand and real estate trends.
Conclusion
Global market shifts are the result of multiple interconnected forces—technological innovations, geopolitical changes, monetary cycles, supply chain strategies, energy transitions, and evolving consumer behaviors.
Today’s world is moving away from a singular globalized model toward a more complex, multipolar system defined by resilience, regional alliances, and digital transformation. Understanding these shifts is essential for navigating investment decisions, business strategies, and policy development.
In this rapidly changing environment, adaptability, foresight, and innovation will define success for nations, companies, and individuals alike.

Part 2 Candle Stick PatternRisks in Option Trading
While options provide great opportunities, they are not without risk:
Leverage Risk: High leverage can magnify both gains and losses.
Time Decay: Options lose value as expiration approaches, especially if they are out-of-the-money.
Complexity: Advanced strategies can be complicated and require careful monitoring.
Liquidity Risk: Some options may have low trading volumes, making it harder to enter or exit positions at favorable prices.
Market Risk: Like all investments, options are subject to market volatility and external factors.

Super Cycle Outlook: The Big Picture in Financial MarketHistorical Perspective of Super Cycles
Historically, super cycles have often been observed in commodities, stock markets, and global trade patterns. For instance:
Commodity Super Cycles: The industrialization of the United States and Europe during the 19th century created the first global commodity super cycle, driven by massive demand for coal, iron, and raw materials. Similarly, the post-World War II economic expansion, especially between the 1950s and 1970s, fueled a commodities boom, creating a super cycle for oil, metals, and agricultural products. More recently, China’s industrial rise in the 2000s led to a demand-driven super cycle in base metals such as copper, iron ore, and aluminum.
Equity Market Super Cycles: Stock markets also experience long-term super cycles, often reflecting sustained technological innovation, demographic transitions, or globalization. The U.S. stock market experienced a super cycle from the 1980s through 1999, driven by technology adoption, financial deregulation, and globalization. Similarly, emerging markets like India and China have seen multi-decade super cycles as rapid urbanization, rising middle-class income, and industrial expansion drove sustained economic growth.
Drivers of Super Cycles
Super cycles are not random—they are typically fueled by a combination of structural factors that persist over decades:
Demographics: Population growth and urbanization play a central role in super cycles. A young, growing population increases labor force participation, consumer demand, and investment in infrastructure. For instance, Asia’s rapid urbanization in the early 2000s drove a long-term commodity super cycle.
Technological Innovation: Revolutionary technologies can create long-term growth trends in equity markets and certain sectors. The rise of the internet, renewable energy, electric vehicles, and artificial intelligence has the potential to fuel new super cycles, reshaping the global economic landscape.
Globalization and Trade Expansion: The integration of emerging economies into global supply chains often creates decades-long growth trends. China’s entry into the World Trade Organization (WTO) in 2001 triggered a commodity super cycle and reshaped global trade flows.
Monetary and Fiscal Policies: Low interest rates, expansive fiscal spending, and accommodative monetary policy can extend super cycles by encouraging investment and consumption. The post-2008 period of global quantitative easing, for example, contributed to sustained equity market rallies in developed countries.
Geopolitical Shifts: Wars, sanctions, and trade agreements can have long-lasting effects on commodity prices and market sentiment. For instance, oil price super cycles have often coincided with geopolitical disruptions in the Middle East or shifts in OPEC strategies.
Phases of a Super Cycle
Super cycles generally progress through distinct phases, each with unique characteristics:
Emergence Phase: This is the initial stage, marked by structural change, technological breakthroughs, or demographic shifts. Asset prices may begin rising slowly as markets recognize long-term trends.
Acceleration Phase: During this period, growth becomes more visible and widely accepted. Investor optimism builds, demand outpaces supply, and markets often experience rapid price appreciation. Commodities or equities enter a strong upward trajectory.
Peak Phase: At this stage, growth reaches its maximum. Prices are often overextended relative to historical norms, speculation may increase, and market volatility can rise. Structural imbalances, such as overproduction or inflated valuations, often become apparent.
Decline or Correction Phase: After the peak, the super cycle gradually cools. Prices may decline sharply or stabilize at a lower growth trajectory, often influenced by macroeconomic corrections, demographic slowdowns, or shifts in policy.
Consolidation or Reversal: In some cases, super cycles may transition into new cycles or periods of stagnation. For instance, a commodities super cycle might end as demand stabilizes and supply chains normalize, paving the way for a new cycle in another sector or geography.
Implications for Investors
Understanding super cycles is crucial for both short-term traders and long-term investors:
Long-Term Asset Allocation: Super cycles influence which asset classes are likely to outperform over decades. For example, during commodity super cycles, investing in metals, energy, or infrastructure stocks can yield substantial returns.
Risk Management: Super cycles often bring higher volatility in the mid-term. Being aware of the stage of a super cycle allows investors to adjust portfolios and hedge risks effectively.
Sector Rotation: Super cycles create sector-specific opportunities. In the technology-driven super cycle of the 1990s, tech and internet companies outperformed traditional sectors. Similarly, emerging markets outperform during demographic-driven cycles.
Global Diversification: Super cycles are often regional or sector-specific. By diversifying globally, investors can capture growth in regions or sectors that are entering new super cycles while mitigating risks from declining cycles elsewhere.
Current Super Cycle Outlook
As of 2025, several analysts believe the global economy may be entering a new super cycle driven by:
Green Energy Transition: The global shift toward renewable energy, electric vehicles, and decarbonization efforts is creating a new long-term demand pattern for commodities like lithium, cobalt, copper, and rare earth metals.
Technological Advancement: AI, robotics, cloud computing, and biotechnology are transforming productivity and creating multi-decade growth opportunities in equities and specialized sectors.
Demographics and Urbanization in Emerging Markets: Africa, Southeast Asia, and parts of Latin America are experiencing rapid urbanization and population growth, potentially fueling new super cycles in infrastructure, consumer goods, and financial services.
Monetary Policy Evolution: Central banks are navigating the post-pandemic environment with cautious monetary policy, balancing inflation control and growth stimulation, which may influence the timing and intensity of super cycles.
Challenges and Risks
While super cycles present opportunities, they also carry inherent risks:
Speculative Excess: Long-lasting uptrends can encourage excessive speculation, leading to bubbles and abrupt corrections.
Geopolitical Uncertainty: Conflicts, trade wars, or sanctions can disrupt supply chains and derail super cycle expectations.
Technological Disruption: While technology can drive growth, it can also render existing industries obsolete, creating winners and losers in the market.
Environmental Constraints: Resource depletion, climate change, and sustainability issues may cap the potential of certain super cycles, especially in commodities and energy markets.
Conclusion
Super cycles are among the most influential drivers of long-term financial market trends. Unlike normal market cycles, they reflect deep structural shifts in economies, technologies, demographics, and global trade patterns. Understanding super cycles allows investors to make strategic long-term decisions, manage risks, and identify sectors poised for decades of growth. While predicting the exact timing and magnitude of super cycles is challenging, analyzing macroeconomic trends, demographic shifts, technological innovation, and geopolitical developments can provide valuable insights into where the next long-term opportunities may lie.
In 2025, the global outlook suggests a transition into a super cycle shaped by green energy, technological transformation, and emerging market growth. Investors, policymakers, and strategists who recognize and adapt to these long-term trends are likely to capture the maximum benefits of the next multi-decade expansion, while carefully managing the risks inherent in any large-scale structural market movement.
Types of Financial Markets1. Capital Markets
Capital markets are long-term financial markets where instruments such as equities (shares) and long-term debt (bonds) are traded. These markets help businesses and governments raise funds for expansion, infrastructure, or other long-term projects.
a. Stock Market
The stock market enables companies to raise capital by issuing shares to investors. There are two segments:
Primary Market: Companies issue new shares for the first time through Initial Public Offerings (IPO). This is the market where securities are created.
Secondary Market: After issuance, shares are bought and sold among investors via stock exchanges like the NSE, BSE, NYSE, and NASDAQ.
Importance:
Provides companies with capital for expansion
Offers investors opportunities for wealth creation
Acts as a barometer of the economy
b. Bond Market
The bond market, also called the debt market, deals with the issuance and trading of bonds. These are typically issued by governments, corporations, or municipalities to borrow money.
Types of bonds include:
Government bonds
Corporate bonds
Municipal bonds
Convertible bonds
Role:
It offers stable returns, lower risk compared to equities, and is crucial for government financing.
2. Money Markets
Money markets deal with short-term debt instruments with maturities of less than one year. These markets help institutions manage short-term liquidity needs.
Instruments include:
Treasury bills (T-bills)
Commercial paper (CP)
Certificates of deposit (CDs)
Repurchase agreements (Repos)
Participants: Banks, financial institutions, corporations, mutual funds, and central banks.
Purpose:
To provide short-term funding, support liquidity, and stabilize the banking system.
3. Foreign Exchange (Forex) Market
The forex market is the world’s largest and most liquid financial market. It facilitates the global exchange of currencies.
Key features:
Operates 24/5 across global financial centers
Daily trading volume exceeds trillions of dollars
Involves participants like banks, hedge funds, corporations, retailers, and governments
Types of forex markets:
Spot Market: Immediate currency exchange
Forward Market: Future delivery at a pre-agreed rate
Futures Market: Standardized currency contracts traded on exchanges
Importance:
It enables international trade, investment flows, tourism, and global business operations.
4. Derivatives Markets
Derivatives markets trade financial contracts whose value is derived from an underlying asset—such as stocks, currencies, interest rates, or commodities.
Main derivative instruments:
Futures: Obligatory contracts to buy/sell assets at a future date
Options: Contracts giving the right but not the obligation to buy/sell
Swaps: Exchange of cash flows (e.g., interest rate swaps)
Forwards: Customized over-the-counter (OTC) contracts
Use cases:
Hedging risk (price risk, currency risk)
Speculation for profit
Arbitrage opportunities
Portfolio diversification
Derivative markets enhance liquidity and allow businesses to manage financial exposure efficiently.
5. Commodity Markets
Commodity markets deal with physical goods or raw materials such as:
Gold, silver
Crude oil, natural gas
Agricultural products (wheat, sugar, cotton)
Metals (aluminum, copper)
These commodities can be traded in two ways:
a. Spot Commodity Market
Immediate delivery and payment occur. Prices depend on real-time supply and demand.
b. Commodity Derivatives Market
Futures and options contracts allow traders to speculate or hedge commodity price fluctuations.
Importance:
Commodity markets help producers secure price stability and provide investors with opportunities beyond traditional financial assets.
6. Cryptocurrency and Digital Asset Markets
With rapid technological advancement, cryptocurrencies have created a new type of financial market. These markets trade digital tokens like Bitcoin, Ethereum, and thousands of altcoins.
Features:
Decentralized blockchain-based system
Trades through exchanges like Binance, Coinbase, and others
High volatility, high return potential
Instruments Include:
Spot trading
Futures and perpetual contracts
Staking and yield farming
Cryptocurrency markets are reshaping modern finance, introducing decentralized finance (DeFi), NFTs, and Web3 innovations.
7. Insurance Markets
Though not traditional trading markets, insurance markets play a crucial role in risk distribution. They allow individuals and businesses to transfer risks of financial loss to insurance companies.
Types of insurance markets:
Life insurance
Health insurance
Property and casualty insurance
Reinsurance
These markets support economic growth by offering financial protection and risk coverage.
8. Real Estate Markets
Real estate markets involve buying, selling, and leasing residential, commercial, and industrial properties.
Components:
Physical property market
Real estate investment trusts (REITs)
Mortgage-backed securities (MBS)
Real estate offers steady income through rent and long-term appreciation, making it a key investment category.
9. Credit Markets
Credit markets deal with borrowing and lending between parties. They include:
Bank loans
Credit lines
Mortgages
Consumer lending
These markets influence spending, investment, and economic growth by determining the availability and cost of credit.
10. Over-the-Counter (OTC) Markets
OTC markets involve decentralized trading without a centralized exchange. Participants trade directly through brokers or dealers.
Examples:
Currency forwards
Interest rate swaps
Corporate debt
Certain derivatives
OTC markets offer flexibility but carry higher counterparty risk.
11. Auction Markets
Auction markets match buyers and sellers by competitive bidding. The price is determined by supply and demand.
Examples:
Government bond auctions
Commodity auctions
IPO book-building auctions
These markets ensure transparency and fair price discovery.
Conclusion
Financial markets are diverse, interconnected systems that influence every part of the global economy. Each market—whether capital, money, forex, commodity, or derivatives—serves a unique role in facilitating investment, supporting business operations, managing risk, and driving economic growth. Understanding these markets helps investors, businesses, and policymakers make informed decisions. Together, these markets form the complex network through which money flows, value is created, and economies evolve.

Premium Chart Patterns Limitations of Chart Patterns
False breakouts are common.
Patterns may be subjective—two traders may interpret them differently.
Market news can disrupt even perfect setups.
Patterns on lower timeframes are less reliable due to noise.
Therefore, traders often combine patterns with:
Moving averages
RSI
MACD
Volume analysis
Market structure
This improves accuracy.

Part 10 Trade Like Institutions Option Trading in India (NSE)
In India, the National Stock Exchange (NSE) is the largest options market globally in terms of contracts traded.
Features of Indian Options:
Cash-settled for indices (NIFTY, FINNIFTY, BANKNIFTY)
Stock options are physically settled
Weekly expiries every Thursday (for index)
Monthly expiries for stocks
Index options are preferred because they:
Have high liquidity
Offer tight spreads
Enable sophisticated strategies

Part 9 Trading Master ClassRisks in Option Trading
1. High Losses for Option Sellers
Naked call sellers face unlimited loss potential.
2. Time Decay
An option loses value as it approaches expiry.
3. Complex Pricing
Options require understanding of volatility, Greeks, and probability.
4. Liquidity Problems
Illiquid options cause slippage and wide bid-ask spreads.
5. Emotional Trading
Fast-moving markets can cause panic among new traders.
