ANGELONE 1 Day Time Frame 📌 Key Levels (Daily)
Pivot (Classic): ≈ ₹2,675.77.
Resistance zones:
R1 (Classic): ~ ₹2,713.73
R2: ~ ₹2,747.97
Support zones:
S1 (Classic): ~ ₹2,641.53
S2: ~ ₹2,603.57
⚠️ Important Caveats
These levels are calculated from daily data — they do not guarantee the stock will only move within these ranges or behave exactly as outlined.
Market conditions, news, F&O flows, and broader sector moves can invalidate these levels rapidly.
Use these levels along with your own risk management: stop-losses, position size, and timeframe.
The data may have a delay or slight inaccuracy — always cross-verify with live quotes.
Trendlinebounce

Part 1 Ride The Big Moves What is an Option?
An option is a financial derivative whose value is derived from an underlying asset such as a stock, index, or commodity. Options come in two primary forms:
Call Option: It gives the holder the right to buy the underlying asset at a predetermined price (known as the strike price) before or on the expiry date.
Put Option: It gives the holder the right to sell the underlying asset at a predetermined strike price before or on the expiry date.
The buyer of an option pays a premium to the seller (also called the writer) for this right. The seller receives the premium as income but takes on the obligation to buy or sell the asset if the buyer chooses to exercise the option.

How Businesses Can Grow in the Trading Market1. Understanding the Trading Market
The trading market encompasses multiple segments—stock trading, forex (foreign exchange), commodity trading, derivatives, and cryptocurrency trading. Each market functions under different regulatory, economic, and technological frameworks but shares a common goal: facilitating the exchange of value and risk between buyers and sellers.
For businesses entering trading, the first step to growth is a deep understanding of the market structure, participant behavior, and factors influencing price movements. Knowledge of supply-demand dynamics, macroeconomic indicators, and geopolitical influences helps in making informed trading decisions. Companies that invest in market intelligence and data analysis often find themselves ahead of competitors.
2. Building a Strong Trading Infrastructure
A key driver of growth in the trading market is technological infrastructure. In today’s environment, speed, accuracy, and connectivity define success. Businesses must invest in:
Trading Platforms: Using robust platforms like MetaTrader, Bloomberg Terminal, or proprietary systems ensures efficiency in execution.
Data Analytics Tools: Real-time data processing, AI-driven insights, and predictive analytics help in identifying opportunities early.
Connectivity and APIs: Fast internet connections and integration with exchanges through APIs enhance automation and scalability.
Cybersecurity: As trading becomes digital, safeguarding systems from cyber threats is essential for operational continuity and client trust.
A business that leverages advanced technology can scale operations globally while minimizing transaction errors and latency.
3. Strategic Diversification
One of the fundamental principles for business growth in the trading market is diversification. Relying on a single asset class or market exposes a company to unnecessary risk. Successful trading businesses diversify in several ways:
Asset Diversification: Engaging in equities, forex, commodities, and derivatives reduces dependence on one market.
Geographical Diversification: Expanding into international markets allows firms to capitalize on regional opportunities and time-zone differences.
Product Diversification: Offering products like ETFs, mutual funds, or structured products can attract a broader client base.
Diversification not only stabilizes revenue but also opens multiple income streams that cushion the impact of market volatility.
4. Leveraging Technology and Automation
Technology plays a transformative role in the trading market. Automated and algorithmic trading systems have revolutionized how businesses operate. Algorithms can execute large volumes of trades within milliseconds based on pre-set strategies, removing emotional bias and increasing efficiency.
Key technological advancements supporting business growth include:
Artificial Intelligence (AI) and Machine Learning (ML): AI helps forecast price movements using pattern recognition and big data analysis.
Blockchain Technology: It enhances transparency and reduces settlement times, especially in cryptocurrency and cross-border trading.
Cloud Computing: Enables real-time access to trading data and remote operation, allowing global teams to collaborate seamlessly.
Firms that embrace automation and digital transformation gain a competitive advantage through reduced costs, higher accuracy, and faster decision-making.
5. Developing a Risk Management Framework
Trading is inherently risky due to market fluctuations, leverage, and liquidity issues. Businesses can grow sustainably only when they balance risk and reward. A strong risk management strategy involves:
Position Sizing: Limiting exposure per trade to a fixed percentage of total capital.
Stop-Loss Orders: Automatically exiting losing trades to prevent large losses.
Hedging: Using derivatives like options and futures to protect against adverse price movements.
Stress Testing: Simulating different market scenarios to assess potential impacts on the portfolio.
Risk management not only safeguards capital but also builds confidence among investors and clients.
6. Regulatory Compliance and Transparency
Growth in the trading market depends heavily on maintaining regulatory compliance. Governments and financial authorities such as SEBI (India), SEC (USA), and FCA (UK) impose rules to ensure fair trading and investor protection. Businesses that adhere to these regulations gain credibility and attract institutional clients.
Transparency in reporting, accurate record-keeping, and ethical conduct are vital for long-term growth. A reputation for integrity can distinguish a trading firm in a competitive marketplace.
7. Building a Skilled Team
A successful trading business requires a mix of analytical, technical, and strategic expertise. Recruiting skilled professionals—traders, analysts, risk managers, and developers—creates a strong foundation for growth. Additionally, ongoing training ensures the team stays updated with market trends, tools, and compliance requirements.
Companies should encourage knowledge sharing, foster innovation, and provide performance-based incentives. Human capital remains one of the most valuable assets in trading operations.
8. Adopting Data-Driven Decision Making
Data has become the new currency of the trading world. Businesses that leverage data effectively can identify trends, forecast market behavior, and optimize trading strategies. Using big data analytics allows traders to process massive volumes of historical and real-time information for better decision-making.
Predictive analytics tools can detect early signs of market shifts, while sentiment analysis (e.g., through news or social media data) provides insights into investor psychology. Data-driven approaches minimize guesswork and enhance precision.
9. Strategic Partnerships and Networking
Collaborations with financial institutions, liquidity providers, and technology vendors can accelerate growth. For instance, partnering with brokers or fintech platforms enables access to liquidity pools and advanced market tools. Networking at global financial conferences or online forums also helps in building relationships that open doors to new opportunities and insights.
Strategic alliances expand reach, enhance credibility, and reduce operational costs through shared resources.
10. Marketing and Branding in the Trading Sector
In a competitive trading environment, marketing and brand differentiation are crucial. Businesses must position themselves as reliable, transparent, and technologically advanced. Effective strategies include:
Content Marketing: Publishing insightful market analyses and trading education to attract clients.
Social Media Presence: Using platforms like LinkedIn, X (formerly Twitter), and YouTube to engage traders.
Client Support and Service Quality: Building trust through prompt assistance and transparent communication.
A strong brand helps attract both retail and institutional clients, fueling growth.
11. Expanding into New Markets
Globalization has made it easier for trading businesses to enter emerging markets where trading activity is growing rapidly. Markets in Asia, Africa, and Latin America offer rising participation and economic potential. Understanding local regulations and customizing products for regional demand helps in capturing new audiences.
Expanding internationally diversifies revenue and increases resilience against downturns in any single economy.
12. Continuous Innovation and Adaptability
The trading market evolves constantly with changing technologies, regulations, and investor preferences. To grow, businesses must remain adaptable—embracing new tools like decentralized finance (DeFi), sustainable investing, and tokenized assets.
Innovation in products, strategies, and services keeps a firm relevant and competitive. Regular review of trading models ensures alignment with current market realities.
Conclusion
Growth in the trading market is not achieved overnight—it results from a blend of strategic planning, technological investment, skilled management, and disciplined execution. Businesses that focus on diversification, automation, risk management, and compliance can build a robust foundation for sustainable expansion.
In a world where financial markets are interconnected and data-driven, success depends on how well a business can adapt to change, leverage technology, and maintain trust. By combining innovation with prudence, any trading enterprise can evolve from a small participant to a global leader in the dynamic world of trading.

Derivatives Trading Strategies and Option Trading ExplainedUnderstanding Derivatives
A derivative is a financial contract whose value depends on the performance of an underlying asset. Common derivatives include:
Futures contracts: Agreements to buy or sell an asset at a future date at a predetermined price.
Forwards: Similar to futures but traded over-the-counter (OTC), meaning they are privately negotiated.
Options: Contracts that give the holder the right, but not the obligation, to buy or sell an asset.
Swaps: Agreements to exchange cash flows or other financial instruments.
Derivatives help investors manage price risk, hedge exposure, or profit from volatility. However, they also carry significant leverage, which can amplify both profits and losses.
Major Derivative Trading Strategies
1. Hedging Strategies
Hedging is a risk management approach used to protect against adverse price movements. For instance, a farmer expecting to sell wheat in three months can use futures contracts to lock in the selling price, ensuring stable revenue even if prices fall later. Similarly, companies dealing in foreign currencies use currency futures or options to protect themselves from exchange rate volatility.
Example:
A portfolio manager holding large equity exposure may use index futures to hedge against a potential market downturn. If the market falls, losses in the stock portfolio can be offset by gains in the futures position.
2. Speculative Strategies
Speculators use derivatives to profit from anticipated price movements. They take positions based on their market outlook without owning the underlying asset.
For example, if a trader expects oil prices to rise, they might buy oil futures to benefit from price appreciation. If the prediction is correct, the trader profits from the difference between the buying and selling price.
Speculative trades are risky but can offer high rewards due to leverage. However, they require careful risk control to avoid substantial losses.
3. Arbitrage Strategies
Arbitrage exploits price discrepancies of the same asset across different markets or forms. Traders buy the asset where it’s undervalued and sell it where it’s overvalued, locking in risk-free profits.
Example:
If a stock’s price in the cash market differs from its futures price beyond theoretical limits, an arbitrageur can simultaneously buy the stock and sell the future, profiting when prices converge.
4. Spread Trading
Spread trading involves taking offsetting positions in related derivatives to profit from the price difference between them rather than outright price movements. Examples include:
Calendar spreads: Buying and selling futures with different expiry dates.
Inter-commodity spreads: Trading between related commodities, like crude oil and heating oil.
Inter-market spreads: Exploiting price differences between similar assets on different exchanges.
These strategies reduce exposure to market direction and focus on relative performance.
Introduction to Option Trading
Options are among the most versatile derivative instruments. An option contract gives the buyer the right, but not the obligation, to buy or sell an asset at a predetermined price (called the strike price) before or at the contract’s expiration date.
There are two main types of options:
Call Option: Gives the holder the right to buy the underlying asset.
Put Option: Gives the holder the right to sell the underlying asset.
The seller (or writer) of the option has the obligation to fulfill the contract if the buyer chooses to exercise it. Option trading strategies range from simple directional bets to complex multi-leg structures designed to profit in various market conditions.
Key Components of Option Trading
Premium: The price paid by the option buyer to the seller for the contract.
Strike Price: The price at which the asset can be bought or sold.
Expiration Date: The date the option contract expires.
Intrinsic Value: The actual value if the option were exercised today.
Time Value: The additional value based on volatility and time remaining until expiration.
Options are influenced by factors such as volatility, interest rates, time decay, and the price of the underlying asset.
Option Trading Strategies
1. Directional Strategies
These strategies aim to profit from a forecasted price move.
a) Long Call
A trader buys a call option expecting the asset’s price to rise.
Profit: Unlimited as price increases.
Loss: Limited to the premium paid.
Example: Buying a call on Nifty at 22,000 strike if you expect it to rise above that level.
b) Long Put
Used when expecting a decline in price.
Profit: Rises as asset price falls.
Loss: Limited to the premium paid.
c) Short Call and Short Put
Writing calls or puts allows traders to collect premiums, but they face potentially unlimited loss if the market moves against them. These are generally used by experienced traders or those with a hedge in place.
2. Neutral Strategies
When traders expect little movement, they use strategies that benefit from time decay or low volatility.
a) Covered Call
The trader holds the underlying asset and sells a call option on it.
Generates income from the premium.
Ideal when expecting limited upside.
b) Iron Condor
Combines both call and put spreads to earn premium income when the asset stays within a range.
Profit: Limited to net premium received.
Loss: Limited if price breaks out of the range.
c) Butterfly Spread
Involves buying one in-the-money option, selling two at-the-money options, and buying one out-of-the-money option. It profits when prices remain stable around the middle strike.
3. Volatility Strategies
These strategies target changes in volatility rather than price direction.
a) Straddle
Buying both a call and put at the same strike price and expiry.
Profits from large price movements in either direction.
Loss occurs if the price remains stable (premium decay).
b) Strangle
Similar to a straddle but uses different strike prices for the call and put. It is cheaper but requires a larger move to profit.
c) Calendar Spread
Involves buying and selling options of the same strike but different expiration dates, betting on changes in time decay or volatility.
Risk Management in Derivative Trading
Derivatives and options can magnify returns but also amplify losses. Therefore, risk management is critical:
Position sizing: Limit exposure to a fixed percentage of total capital.
Stop-loss orders: Automatically exit losing positions.
Diversification: Spread trades across assets and maturities.
Hedging: Use options to protect portfolios against extreme moves.
Greeks management: Monitor option sensitivities—Delta (price movement), Theta (time decay), Vega (volatility), and Gamma (rate of Delta change)—to understand risk dynamics.
Conclusion
Derivatives and option trading represent a sophisticated domain within financial markets, offering vast opportunities for hedging, speculation, and income generation. While derivatives like futures and forwards help manage risk or exploit arbitrage opportunities, options add flexibility through their asymmetrical payoff structure. Mastering derivatives requires understanding market behavior, volatility, and strategic planning. When used responsibly, derivatives can protect portfolios and generate consistent returns. However, due to leverage and complexity, disciplined risk control and continuous learning are essential for long-term success.
Volume Profile and Market Analysis1. Understanding Volume Profile
The Volume Profile is a histogram plotted on the price axis of a chart, showing the amount of traded volume at each price level during a specified period. Rather than displaying how much volume was traded per time unit (like a standard volume bar at the bottom of a chart), it shows where the majority of trading occurred within a price range.
This data allows traders to see which prices attracted the most attention from buyers and sellers, and which levels were quickly rejected. In essence, Volume Profile reveals the “market’s memory”—where the majority of market participants placed their bets.
2. Key Components of Volume Profile
To fully understand how to interpret Volume Profile, traders must become familiar with its key elements:
Point of Control (POC):
The price level with the highest traded volume during the selected period. It represents the fairest price—where buyers and sellers reached the greatest consensus.
Value Area (VA):
Typically, this covers about 70% of total traded volume and represents the range of prices considered “fair value” for the market. Prices outside this range are often seen as overbought or oversold.
Value Area High (VAH) and Value Area Low (VAL):
These boundaries mark the upper and lower limits of the Value Area. They act as important support and resistance levels.
High Volume Nodes (HVN):
Price zones where a large amount of trading occurred, indicating acceptance and stability. These levels often act as magnets for price.
Low Volume Nodes (LVN):
Price zones with very little trading activity, indicating rejection or imbalance. These often serve as breakout or reversal points.
3. Interpreting Volume Profile in Market Context
The market moves through cycles of accumulation, distribution, expansion, and contraction, and the Volume Profile helps visualize these phases:
Balanced Profile (D-shaped):
Indicates a period of consolidation where supply and demand are balanced. Price oscillates within a range around the POC, suggesting indecision. Breakouts from such zones often lead to strong directional moves.
Trending Profile (P-shaped or b-shaped):
A P-shaped profile shows a short-covering rally, where price moved upward and volume concentrated near the top of the profile. Conversely, a b-shaped profile indicates long liquidation—strong selling followed by stabilization at lower prices.
Double Distribution Profile:
This occurs when the market transitions between two value areas, indicating a shift in sentiment or a major fundamental change.
By reading these structures, traders can identify whether the market is in a state of balance (range-bound) or imbalance (trending), and adjust their strategies accordingly.
4. Volume Profile vs. Market Profile
Although they sound similar, Volume Profile and Market Profile are distinct:
Market Profile (developed by Peter Steidlmayer) organizes price and time data to show where the market spent the most time.
Volume Profile focuses purely on volume traded at each price level.
While Market Profile emphasizes time-based value areas, Volume Profile provides a clearer view of actual market participation, making it more precise for detecting liquidity zones and institutional activity.
5. Volume Profile in Different Market Types
a) In Forex Markets
Volume in spot forex is decentralized and not directly measurable like in stocks or futures. Traders often rely on tick volume as a proxy, using Volume Profile tools provided by brokers that aggregate order flow data. Volume analysis helps identify key price levels where large participants—such as banks or hedge funds—are active.
b) In Stock Markets
Volume Profile is particularly effective since exchanges record every share traded. Traders use it to find areas of institutional accumulation or distribution, often near earnings announcements, mergers, or economic reports.
c) In Futures and Commodities
Volume Profile is integral to futures trading because these markets are centralized. Traders often overlay Volume Profile with open interest and Cumulative Delta (buy vs. sell volume) to interpret real market intent.
6. Combining Volume Profile with Market Analysis
Volume Profile on its own is powerful, but when integrated into broader market analysis, it produces deeper insights.
a) Technical Analysis Integration
Support and Resistance:
VAH and VAL naturally act as strong support and resistance zones.
Breakouts:
Price breaking above VAH or below VAL with high volume often signals a continuation of the trend.
Trend Confirmation:
Aligning the slope of the profile with moving averages or trendlines helps confirm momentum.
b) Fundamental Analysis Connection
Fundamental events such as interest rate decisions, earnings reports, or geopolitical news can trigger high-volume shifts. By analyzing how the Volume Profile responds, traders can identify whether institutions are building or exiting positions in reaction to the news.
c) Sentiment and Order Flow
Volume Profile aligns naturally with order flow analysis—tracking buying and selling pressure at key price levels. Combining it with sentiment indicators (like COT reports or social sentiment data) helps validate whether retail traders or institutions dominate a move.
7. Institutional Trading and Volume Profile
Institutional players often execute trades at specific volume levels to mask their intentions. The Volume Profile reveals these footprints:
Accumulation Zones:
Large volumes at stable prices after a decline often indicate institutional buying.
Distribution Zones:
Heavy volume after an uptrend suggests institutions are offloading positions.
Liquidity Traps:
Price spikes into low-volume zones followed by rejections often represent false breakouts designed to trap retail traders.
By reading these patterns, retail traders can align with institutional behavior instead of being trapped by it.
8. Advantages of Volume Profile Analysis
Precision: Identifies key price levels where volume is concentrated.
Market Context: Reveals balance vs. imbalance zones.
Institutional Insight: Shows where large traders are active.
Support/Resistance Accuracy: More reliable than indicators based on time.
Adaptability: Works across all asset classes and timeframes.
9. Limitations of Volume Profile
Lagging Nature: It shows historical participation, not future intent.
Data Dependency: Requires accurate tick or trade data; less reliable in decentralized markets like spot forex.
Complex Interpretation: Needs context—volume alone can mislead without price action or trend confirmation.
Short-Term Noise: Small timeframes may show excessive detail that obscures meaningful levels.
10. Practical Application in Trading
A practical Volume Profile-based strategy might look like this:
Identify Balance Area: Observe where the majority of volume has occurred over recent sessions.
Mark VAH, VAL, and POC: These become your reference levels.
Wait for Imbalance: Watch for price breaking out of the value area with high volume.
Confirm with Price Action: Look for retests of VAH/VAL or the POC for potential entries.
Manage Risk: Use low-volume nodes or opposite side of the value area as stop-loss levels.
This method aligns trading decisions with institutional activity and real market structure rather than arbitrary indicators.
11. The Future of Volume and Market Analysis
As financial markets become increasingly algorithm-driven, volume-based analytics are evolving through machine learning, order book heatmaps, and real-time flow data visualization. These tools allow traders to not only see where the market has traded, but where orders are currently resting—providing predictive insight into potential price reactions.
Volume Profile remains the backbone of this new generation of trading tools, bridging the gap between traditional chart reading and data-driven market intelligence.
Conclusion
Volume Profile is more than a charting tool—it’s a framework for understanding the psychology of the market. By showing how volume is distributed across price levels, it uncovers the footprints of professional traders and institutions. When combined with technical, fundamental, and sentiment analysis, it allows traders to operate with greater precision, confidence, and understanding of market structure.
In a world of fast-moving markets and complex algorithms, mastering Volume Profile and integrating it into comprehensive market analysis is an essential skill for any serious trader seeking an edge in today’s global financial landscape.
Real Knowledge Premium Charts 🔶 What Are Premium Chart Patterns?
Premium chart patterns are advanced price structures that go beyond basic formations like triangles or flags. They reveal institutional activity, market psychology, and volume–price alignment.
These patterns often indicate major breakouts, reversals, or continuation trends — giving traders an edge when combined with volume profile, market structure, and confirmation indicators.

BAJFINANCE 1 Day time frame 🔍 Current Price Snapshot
Last quoted price: ₹1,012.30 (approx) on 12 Nov 2025.
Today’s intraday range: roughly ₹1,008.80 (low) to ₹1,017.70 (high).
52-week range: ~ ₹645.10 (low) to ~ ₹1,102.50 (high).
📌 Key Levels to Watch (1-day timeframe)
Resistance zone: Around ~ ₹1,100-₹1,105, near the 52-week high of ~ ₹1,102.50.
Support zone: Around ~ ₹1,000-₹1,020 — the current price area, with possible support below near ~ ₹990-₹1,000 if the price drifts downward.
If the stock breaks above ~ ₹1,100 with momentum, it may try to test higher levels. If it breaks down below ~ ₹1,000, watch for potential drop to next support zones (which could be ~ ₹950 or lower) though one would need to check historical intraday charts for those.

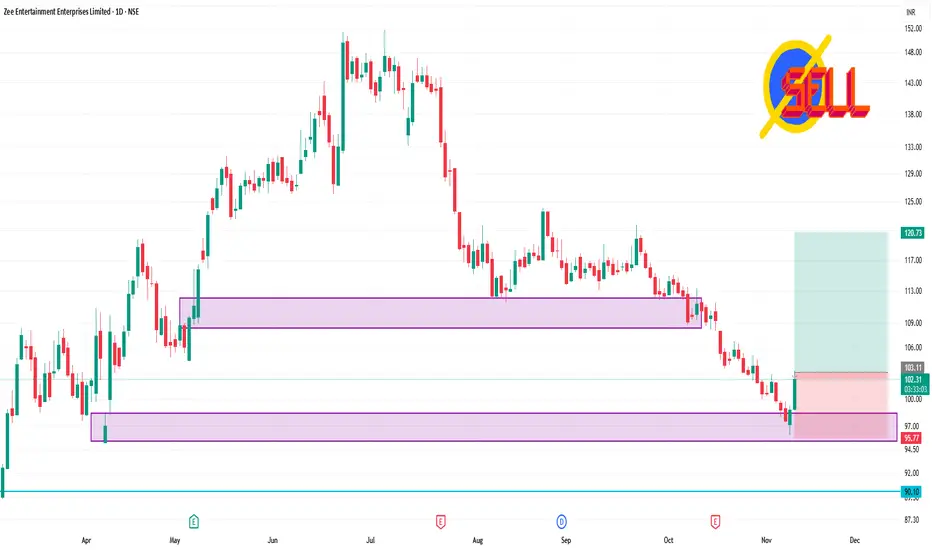
ZEEL 1 Day Time Frame ✅ Key price & range data
Previous close: ~ ₹ 98.78.
Intraday trade has reached ~ ₹ 102.49 (≈ +3.8%) from prior close.
Day’s low ~ ₹ 98.74 and high ~ ₹ 103.30.
🎯 Intraday trading plan (purely illustrative)
If you’re looking to enter long today: consider entry near support (~₹ 99) with stop-loss just below (e.g., ~₹ 97-98) and target near resistance (~₹ 103-105).
If you’re already long: you might trail a stop just under today’s low (~₹ 98.70) and look for a breakout above ~₹ 103.30 to add or hold.
If you’re considering shorting: only if price rejects resistance (~₹ 103.30) with strong volume and fails to breakout. Target back toward support (~₹ 99) with stop above resistance.
TCS 1 Month Time Frame 📊 1-Month Price Overview
On ~12 Nov 2025, TCS was trading at around ₹3,116.
Over the past month, highs in the ~₹3,120 range and lows around ~₹2,943.10 were observed.
The 1-month return is modest: about +2.9% according to one source.
Volatility: According to sector data, the beta over the last month is very low (~0.04) – indicating relatively low sensitivity in that timeframe.
✅ Key Levels
Support zone: ~₹2,940 to ~₹2,970 looks like a recent low range where the stock found some footing.
Resistance zone: ~₹3,090 to ~₹3,120 is a range where the stock has struggled to significantly break above in the past few weeks.
If those break:
A break above ~₹3,120 with conviction could open up upward move potential.
A break below ~₹2,940 may signal more downside risk in the near term.

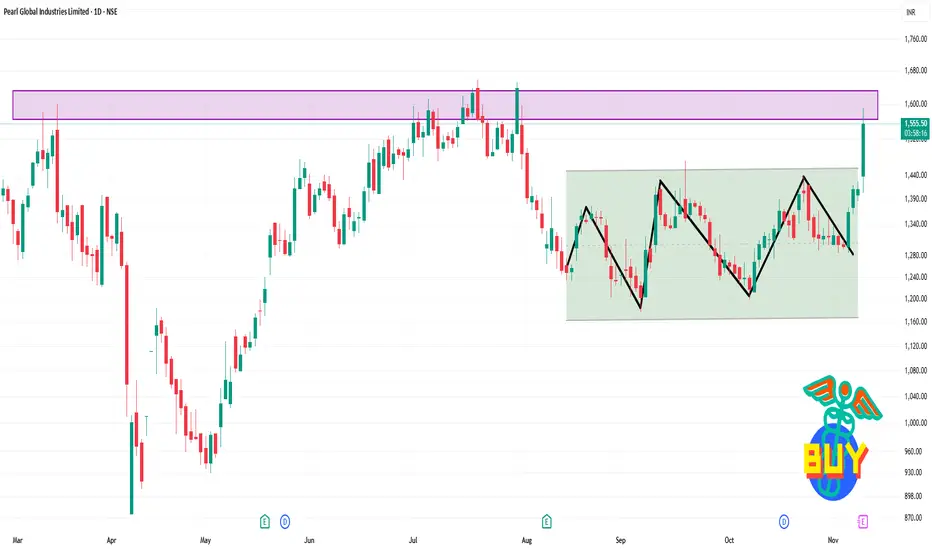
PGIL 1 Day Time Frame✅ What we know
The stock is trading around ₹1,550 (approx) as of today, having opened near ~₹1,440 and with prior close around ~₹1,411
52-week high ~ ₹1,717, and 52-week low ~ ₹875.
Recent few days show an upward trend: ~₹1,297 → ~₹1,364 → ~₹1,410+.
🔍 Key levels for today
Support zone: Around ~ ₹1,350–₹1,380. Given recent lows around ~₹1,360-1,375 in last few sessions.
Resistance zone: Around ~ ₹1,600–₹1,620. Since the stock is now near ₹1,550, this is the near ceiling before reaching recent high territory.
If momentum holds, breakout above ~₹1,620 may open room towards ~₹1,700+.
On the flip side, a drop below ~₹1,350 would signal weakening in the short-term and could target lower support.
CANFINHOME 1 Day View ✅ Current price
The stock is trading around ₹895.50-₹896.50.
On one site, the intraday range is shown as ~ ₹879.55 to ₹900.00.
52-week high around ~ ₹900.00 and low around ~ ₹558.50.
📉 Key support & resistance levels
Resistance zones
Around ₹900: This is near the 52-week high and recent intraday top.
A bit lower, some sources mark resistance at ~ ₹888-₹904.
Support zones
Close support zone around ₹872-₹856.
A stronger support bucket may lie around ₹781-₹789 (pivot / central point area).
Pivot / mid-levels
Central pivot point (daily) reported ~ ₹788.98.
🔍 My interpretation
Since the price is very close to its resistance (~₹900), the risk of a pull-back increases unless it breaks convincingly above that.
A break above ~₹900 with volume support could open higher levels (though evidence of those is weaker).
On the downside, should the price drop below ~₹872-₹856, the next meaningful support may be around the ~₹788 zone.
As always, major news, broader market trend, interest rates (given this is a housing finance company) will affect behaviour.

India’s IPO System:Securities and Exchange Board of India (SEBI)1. Understanding an IPO
An Initial Public Offering (IPO) is the process by which a privately held company offers its shares to the general public for the first time. Through an IPO, a company becomes publicly listed on a stock exchange, such as the National Stock Exchange (NSE) or the Bombay Stock Exchange (BSE). The primary goal of an IPO is to raise capital for expansion, reduce debt, fund research, or provide an exit opportunity for early investors and promoters.
An IPO marks a significant milestone in a company’s journey because it transitions from a private entity with limited ownership to a public entity with diverse shareholders. It also enhances the company’s visibility, credibility, and valuation in the market.
2. Regulatory Framework of the Indian IPO System
The IPO process in India is governed by SEBI, established in 1992, which regulates and ensures that companies follow strict norms before going public. SEBI’s guidelines protect investors’ interests and maintain transparency. Other regulatory bodies involved include:
Ministry of Corporate Affairs (MCA) – Oversees company law compliance.
Stock Exchanges (NSE/BSE) – Approve listing applications and trading permissions.
Registrar of Companies (ROC) – Records and validates company documents.
Depositories (NSDL/CDSL) – Facilitate electronic shareholding and transactions.
SEBI’s (Issue of Capital and Disclosure Requirements) Regulations, 2018 (ICDR) lay down the specific rules for disclosures, eligibility, and allotment in an IPO.
3. Types of IPO Issues in India
There are primarily two types of IPO issues based on pricing methods:
Fixed Price Issue:
The company sets a fixed price for each share in advance.
Investors know the share price before applying.
After closure, demand is revealed, and shares are allotted accordingly.
Book Building Issue:
The company sets a price band (e.g., ₹100–₹120).
Investors bid within the range, specifying the quantity and price they are willing to pay.
The final issue price is determined based on demand (cut-off price).
Most modern IPOs in India use this method due to market efficiency.
4. Eligibility Criteria for Companies
For a company to launch an IPO in India, SEBI mandates certain eligibility conditions:
Net Tangible Assets: Minimum of ₹3 crore in the preceding three years.
Net Worth: Minimum of ₹1 crore in the last three years.
Track Record: Positive operating profit for at least three out of the last five years.
Post-Issue Capital: Minimum ₹10 crore paid-up capital.
Promoter Contribution: Promoters must hold at least 20% of post-issue capital for one year.
If companies do not meet these conditions, they can still approach the market through alternative routes like the SME (Small and Medium Enterprises) Platform or offer for sale (OFS) mechanisms.
5. IPO Process in India
The IPO process involves several well-defined steps:
a. Appointment of Intermediaries
Companies hire financial and legal advisors, including:
Merchant bankers (lead managers)
Underwriters
Registrars to the issue
Auditors and legal consultants
These intermediaries help structure, price, and execute the IPO.
b. Due Diligence and Draft Red Herring Prospectus (DRHP)
The merchant banker prepares a Draft Red Herring Prospectus (DRHP), containing details like company background, financial statements, management, risks, and objectives of the issue.
SEBI reviews the DRHP to ensure full disclosure. After approval, it becomes the Red Herring Prospectus (RHP).
c. Marketing and Roadshows
Companies conduct roadshows to attract institutional and retail investors. The management team presents the company’s growth story, business potential, and financial performance.
d. Bidding and Allotment
In a book-building issue, bidding remains open for 3–5 working days.
Investors can bid through the Application Supported by Blocked Amount (ASBA) system, where funds remain blocked in their bank account until allotment.
Post-closure, the company determines the cut-off price and allots shares to investors.
e. Listing on the Stock Exchange
Once shares are allotted, they are credited to investors’ demat accounts.
The company’s shares are then listed on the NSE and/or BSE within six working days from the issue closure date (known as the T+6 timeline).
6. Categories of Investors in an IPO
SEBI divides investors into three main categories to ensure fair participation:
Qualified Institutional Buyers (QIBs):
Includes mutual funds, insurance companies, foreign portfolio investors (FPIs), and banks. They are allotted 50% of the issue size in book-built issues.
Non-Institutional Investors (NIIs):
High-net-worth individuals investing more than ₹2 lakh. Reserved quota is 15%.
Retail Individual Investors (RIIs):
Small investors investing up to ₹2 lakh. Reserved quota is 35%.
In some cases, an additional portion may be reserved for employees or shareholders.
7. Post-Listing Performance and Compliance
Once listed, companies must adhere to continuous disclosure norms, including quarterly results, corporate governance standards, and insider trading rules. SEBI and the stock exchanges monitor compliance to protect investors and maintain transparency.
Post-listing, share prices fluctuate based on demand, supply, and market perception, reflecting the company’s fundamentals and investor sentiment.
8. Role of Technology in India’s IPO System
India’s IPO ecosystem has become increasingly digitalized. Key advancements include:
ASBA system – Simplifies payment and ensures investor protection.
UPI integration – Allows retail investors to apply easily through mobile apps.
T+6 listing timeline – Reduces settlement time and enhances liquidity.
Online bidding platforms – Brokers and exchanges now offer real-time IPO bidding services.
These innovations have significantly increased retail participation in IPOs, especially among young investors.
9. Benefits of IPOs
For companies:
Access to large-scale capital for expansion.
Improved brand visibility and credibility.
Liquidity for existing shareholders and employees.
Easier access to debt financing post-listing.
For investors:
Opportunity to invest early in growing companies.
Potential for short-term listing gains.
Long-term wealth creation through equity growth.
10. Challenges and Risks
Despite its success, India’s IPO market faces certain challenges:
Market volatility – Global events can affect investor sentiment and pricing.
Overvaluation risk – Some IPOs are priced aggressively, leading to post-listing declines.
Information asymmetry – Retail investors may lack access to in-depth financial analysis.
Regulatory delays – SEBI’s scrutiny, while essential, can prolong the process.
However, ongoing reforms and improved investor education have made the system more resilient and transparent.
11. Recent Trends in the Indian IPO Market
A surge in tech-based IPOs (e.g., Zomato, Nykaa, Paytm).
Growing participation from retail and foreign investors.
Introduction of SME and startup platforms to support smaller firms.
Shift toward sustainable and ESG-compliant companies.
Pre-IPO placements and anchor investors strengthening price discovery.
12. Conclusion
India’s IPO system is a well-structured, transparent, and dynamic framework that bridges the gap between private enterprise and public capital. With the rise of digital platforms, regulatory reforms, and investor awareness, IPOs have become a cornerstone of India’s financial growth story. As India’s economy expands and more companies seek global exposure, the IPO ecosystem will continue to evolve, fostering innovation, inclusion, and wealth creation for millions of investors.
Option Chain: Powerful Tools for Traders and Investors1. What is an Option Chain?
An option chain, also known as an option matrix, lists all the available call and put options for a specific security. Each row represents an individual option contract with its strike price, expiry date, premium, and other key metrics. It helps traders compare multiple options to make informed decisions about trading strategies.
For example, on the NSE (National Stock Exchange of India), you can view the option chain for NIFTY 50, Bank NIFTY, or any stock. It displays both Call Options (CE) on the left and Put Options (PE) on the right.
2. Basic Terms in an Option Chain
a. Call Option (CE)
A Call Option gives the buyer the right, but not the obligation, to buy the underlying asset at a predetermined price (strike price) before or on the expiration date. Buyers of calls expect the underlying price to rise, while sellers (writers) of calls expect it to stay the same or fall.
b. Put Option (PE)
A Put Option gives the buyer the right, but not the obligation, to sell the underlying asset at a predetermined strike price before or on expiration. Buyers of puts expect the underlying asset’s price to fall, while sellers expect it to stay the same or rise.
c. Strike Price
The strike price is the price at which the option holder can buy (for a call) or sell (for a put) the underlying asset. Option chains list multiple strike prices around the current market price of the asset.
Example:
If NIFTY is trading at 22,000, the option chain may show strikes like 21,900, 22,000, 22,100, etc.
d. Expiry Date
The expiry date (or expiration date) is the date when the option contract ceases to exist. In India, options can have weekly or monthly expiries.
Weekly options expire every Thursday.
Monthly options expire on the last Thursday of the month.
After expiry, the option either becomes worthless (out-of-the-money) or is settled for profit/loss (in-the-money).
e. Option Type
Each contract specifies whether it is a Call (CE) or Put (PE). Traders choose the type based on their market outlook:
Bullish traders buy Calls or sell Puts.
Bearish traders buy Puts or sell Calls.
3. Option Chain Data Columns Explained
Each row in an option chain contains various data points. Let’s decode them one by one.
a. Last Traded Price (LTP)
The Last Traded Price is the most recent price at which the option contract was traded. It indicates the current market value or premium of the option.
Example:
If NIFTY 22,000 CE LTP = ₹120, that means the last buyer paid ₹120 for that call option.
b. Change and % Change
This shows how much the premium has moved compared to the previous trading session.
Change = LTP today – LTP yesterday
% Change = (Change / Previous LTP) × 100
It helps traders track intraday momentum and volatility.
c. Bid Price & Ask Price
Bid Price: The highest price a buyer is willing to pay.
Ask Price: The lowest price a seller is willing to accept.
The difference between them is the Bid-Ask Spread, which shows liquidity—narrow spreads indicate higher liquidity.
d. Bid Quantity & Ask Quantity
These represent how many contracts traders are willing to buy or sell at the bid or ask price.
Example:
If Bid Quantity = 1,200, it means traders want to buy 1,200 contracts at the bid price.
e. Open Interest (OI)
Open Interest is one of the most important metrics in an option chain. It represents the total number of outstanding (open) option contracts that have not been settled yet.
Rising OI indicates new positions being created.
Falling OI means positions are being squared off.
Interpretation Example:
Price ↑ and OI ↑ → Strong trend continuation (bullish).
Price ↓ and OI ↑ → Bearish trend strengthening.
Price ↑ and OI ↓ → Short covering.
Price ↓ and OI ↓ → Long unwinding.
f. Change in Open Interest
This shows how much the OI has changed compared to the previous session. It helps identify whether traders are entering new positions or exiting existing ones.
g. Volume
Volume indicates the number of option contracts traded during the day.
High volume shows active trading and high liquidity.
h. Implied Volatility (IV)
Implied Volatility reflects the market’s expectation of future volatility in the underlying asset.
High IV → Expensive premiums (greater uncertainty).
Low IV → Cheaper premiums (stable markets).
Traders use IV to assess whether options are overpriced or underpriced.
i. LTP vs. IV Relationship
If IV rises, option premiums generally increase (even if the underlying doesn’t move).
If IV falls, premiums tend to decline.
j. Intrinsic Value and Time Value
Each option premium consists of:
Intrinsic Value: The actual value if the option were exercised now.
Time Value: The extra value based on time to expiry and volatility.
Example:
If NIFTY = 22,100 and Call Strike = 22,000,
then Intrinsic Value = 100 (22,100 – 22,000).
4. In-the-Money (ITM), At-the-Money (ATM), Out-of-the-Money (OTM)
a. For Call Options:
ITM: Strike < Current Price
ATM: Strike ≈ Current Price
OTM: Strike > Current Price
b. For Put Options:
ITM: Strike > Current Price
ATM: Strike ≈ Current Price
OTM: Strike < Current Price
Traders often focus on ATM and nearby strikes, as they have higher liquidity.
5. Option Chain Analysis Techniques
a. OI Analysis
By comparing Call OI and Put OI, traders can estimate support and resistance levels:
High Call OI → Resistance zone (sellers active).
High Put OI → Support zone (buyers active).
b. Put-Call Ratio (PCR)
PCR = Total Put OI / Total Call OI
PCR > 1 → More Puts, bullish sentiment.
PCR < 1 → More Calls, bearish sentiment.
Traders use PCR as a contrarian indicator when extreme values appear.
c. Max Pain Theory
The Max Pain point is the strike price where the combined loss for option buyers is maximum and sellers benefit most.
At expiry, the underlying price often gravitates toward this level due to hedging and unwinding activity.
6. Real-World Example (NIFTY Option Chain)
Suppose NIFTY = 22,000, and we analyze the option chain:
Strike Call OI Put OI CE LTP PE LTP
21,900 25,000 10,000 160 70
22,000 30,000 28,000 120 120
22,100 45,000 20,000 80 160
Interpretation:
Strong Call OI at 22,100 → Possible resistance.
Strong Put OI at 22,000 → Possible support.
Market range: 22,000–22,100.
7. Advanced Option Chain Terms
a. Delta
Measures how much an option’s price moves for every ₹1 change in the underlying.
Call Delta: 0 to +1
Put Delta: 0 to –1
Example: Delta = 0.5 means the premium moves ₹0.50 for every ₹1 move in the asset.
b. Theta
Represents time decay—how much the option loses in value each day as expiry nears.
c. Gamma
Shows the rate of change of Delta. High Gamma means Delta will change rapidly with price movements.
d. Vega
Measures sensitivity of an option’s price to changes in volatility. High Vega means the option is more affected by IV changes.
e. Rho
Represents sensitivity of option price to interest rate changes.
8. Conclusion
Understanding option chain terms is essential for anyone involved in derivatives trading. The data helps traders:
Gauge market sentiment (bullish or bearish).
Identify support/resistance zones through OI.
Track volatility via IV.
Recognize trading opportunities through volume and price changes.
A skilled trader doesn’t just read numbers — they interpret the psychology behind them. With consistent analysis, the option chain becomes not just a data sheet, but a strategic roadmap for profitable trading decisions in dynamic markets like India’s NSE.
Trading Secrets in the Indian Market1. Understanding Market Structure
One of the most fundamental secrets of successful trading in India lies in mastering the market structure. The Indian market operates through multiple participants: retail traders, domestic institutional investors (DIIs), foreign institutional investors (FIIs), and algorithmic traders. Each group behaves differently, influencing price trends and volatility.
FIIs, for instance, often drive large movements due to their massive volumes, while DIIs provide stability by investing in long-term opportunities. Observing the data from NSE’s FII/DII activity reports can reveal the underlying sentiment of the market. Smart traders align their trades with institutional flow instead of going against it.
2. The Power of Technical Analysis
Technical analysis remains a key secret weapon for traders. Charts reveal the footprints of big players, showing where buying or selling pressure is concentrated.
Common tools like support and resistance, moving averages, candlestick patterns, and indicators such as RSI, MACD, and Bollinger Bands help traders anticipate price movements. However, the real secret lies in combining multiple signals for confirmation. For example, if a stock breaks above a resistance level with high volume and RSI crosses above 50, it indicates strong bullish momentum.
Professional traders also focus on price action trading, which eliminates noise and focuses on pure price movement — a strategy that works well in Indian stocks with high liquidity.
3. Fundamental Strength Matters
While short-term traders often focus on charts, long-term success in the Indian market is built on strong fundamentals. Knowing a company’s business model, revenue growth, debt levels, and profit margins can protect traders from speculative traps.
One secret many professionals use is the combination of technical and fundamental analysis — entering technically strong stocks that are also fundamentally solid. For instance, during bull markets, stocks like HDFC Bank, Infosys, or Reliance Industries often outperform because they have strong fundamentals along with technical confirmation.
4. Risk Management: The Hidden Key
Most traders lose not because of bad strategy, but due to poor risk management. The golden secret of trading is to protect capital first and aim for profit later.
A disciplined trader uses a stop-loss in every trade. The general rule is never risk more than 1–2% of total capital on a single trade. Moreover, position sizing ensures that even a series of losses doesn’t wipe out one’s account.
For instance, if your capital is ₹1,00,000, risking ₹1,000–₹2,000 per trade ensures survival through market volatility. As Warren Buffett famously said, “The first rule of investing is don’t lose money. The second rule is don’t forget rule number one.”
5. Market Psychology and Emotion Control
Another major secret lies in mastering one’s psychology. The Indian market, like any other, tests patience and emotions daily. Fear and greed drive most traders’ decisions — buying when prices soar and selling when panic hits.
Experienced traders, however, do the opposite. They follow a contrarian approach, buying when others are fearful and selling when others are greedy. For example, during market corrections, quality stocks often become undervalued — a golden opportunity for long-term positions.
Maintaining emotional balance through journaling, back-testing, and following a trading plan is essential for consistent performance.
6. Sector Rotation and Market Cycles
The Indian market operates in cycles — not all sectors move together. Understanding sector rotation is one of the least known but most powerful trading secrets.
At times, IT and pharma sectors perform well, especially when the rupee weakens, while banking and infrastructure rally during economic expansion. By tracking sector indices like NIFTY BANK, NIFTY IT, or NIFTY FMCG, traders can identify where money is flowing.
For instance, if NIFTY IT starts outperforming the benchmark NIFTY 50, traders can focus on stocks like TCS or Infosys for better risk-adjusted returns.
7. The Role of Volume and Open Interest
Volume and open interest (OI) provide deep insights into the strength of a trend. Increasing volume during a price rise signals strong buying interest, while high open interest in futures indicates active participation by large traders.
For example, in the derivatives market, if both price and open interest rise simultaneously, it indicates a long build-up. Conversely, rising OI with falling prices shows short build-up.
Smart traders monitor OI data from NSE to confirm the direction before entering trades, especially in index futures like NIFTY and BANKNIFTY.
8. The Secret of Compounding in Positional Trading
While day trading offers quick rewards, positional trading can yield exponential results through compounding. Holding fundamentally strong stocks for weeks or months allows traders to benefit from both price appreciation and dividend payouts.
For instance, investors who held Maruti Suzuki, HDFC Bank, or Infosys for several years witnessed multi-fold returns. The secret lies in letting profits run instead of booking gains too early — a habit that differentiates successful traders from inconsistent ones.
9. News, Events, and Economic Indicators
Another secret weapon is staying informed about macroeconomic and corporate events. In India, announcements like RBI policy decisions, GDP data, inflation rates, and quarterly corporate earnings influence short-term price movements.
Professional traders often anticipate these events and adjust their positions accordingly. For example, during the Union Budget or RBI policy week, volatility spikes — offering opportunities for both breakout and options traders.
10. Algorithmic and Automated Trading
In recent years, algorithmic trading has emerged as a major force in Indian markets. Many institutions and advanced retail traders use automated systems to execute trades based on predefined strategies.
The secret benefit is precision and discipline — algorithms remove emotional bias and can execute hundreds of trades per second. With platforms like Zerodha Streak and AlgoTest, even retail traders can now automate strategies based on indicators or price action, increasing their efficiency.
11. Patience and Discipline Over Prediction
A hidden truth most traders learn late is that discipline beats prediction. No one can predict the market perfectly, but consistent execution of a proven strategy yields results over time.
The best traders focus on probability, not certainty. They understand that losses are part of the game and use them as feedback to refine strategies. Maintaining discipline — following stop-losses, not overtrading, and adhering to trading plans — builds long-term success.
12. The Power of Continuous Learning
The Indian market evolves rapidly. New instruments like index options, ETFs, and sectoral funds constantly appear. Hence, continuous learning becomes a secret ingredient for staying ahead.
Top traders read books, follow market experts, and backtest new strategies regularly. They treat trading as a business, not a gamble — focusing on skill improvement rather than quick profits.
Conclusion
The “secrets” of trading in the Indian market are not hidden in mystery but in discipline, knowledge, and psychology. Success depends on understanding market behavior, managing risks, following technical and fundamental cues, and maintaining emotional balance.
The Indian stock market offers immense opportunities for those who approach it with strategy and patience. By applying these principles — reading institutional flow, following sector trends, using proper risk control, and embracing continuous learning — traders can move from random speculation to consistent profitability.
Ultimately, the biggest secret of trading is simple: there are no shortcuts — only systems, discipline, and experience.

Understanding the Master Candle ConceptOption trading is one of the most exciting and flexible segments of the financial markets. It allows traders to profit not only when prices rise, but also when they fall — and even when they stay relatively stable. In simple terms, an option is a financial contract that gives the buyer the right, but not the obligation, to buy or sell an underlying asset at a predetermined price within a specified period. In India, options are primarily traded on stock indices (like NIFTY 50 or BANK NIFTY) and individual stocks on exchanges like the NSE (National Stock Exchange) and BSE (Bombay Stock Exchange).
Option Trading in India – Regulations
Option trading in India is regulated by the Securities and Exchange Board of India (SEBI).
Contracts are standardized and traded through exchanges like NSE and BSE.
All participants must trade through SEBI-registered brokers, and margins are monitored daily to control risk.

Advanced Option Trading StrategiesHedging and Portfolio Protection Strategies
Options are not just for speculation; they are powerful tools for hedging existing stock portfolios. Hedging means protecting against potential losses due to adverse price moves.
Popular Hedging Techniques:
Protective Put: Buy a put option against long stock holdings to limit downside.
Collar Strategy: Hold stock, sell a call, and buy a put — ideal when you expect limited movement.
Index Options for Portfolio Hedge: Traders holding multiple stocks often hedge using Nifty or Bank Nifty puts instead of individual stock options.

Part 8 Trading master Class Types of Option Trading Strategies
Options strategies are broadly divided into single-leg and multi-leg strategies.
Single-leg strategies: Involve buying or selling one option.
Multi-leg strategies: Combine two or more options (calls and puts) to create structured trades for specific market conditions.
Let’s discuss each category in detail.

WELSPUNLIV 1 Day Time Frame📌 Current price
Last seen around ₹129–130.
The 52-week high is ~ ₹180.70 and the 52-week low ~ ₹104.80.
📊 Key 1-day support & resistance / pivots
From recent technical data:
Daily pivot (central) around ~ ₹131.08.
Support levels (approx):
S1 ~ ₹129.07
S2 ~ ₹125.88
Resistance levels (approx):
R1 ~ ₹134.27
R2 ~ ₹136.28

Premium Chart Knowledge Strategy and Leverage
Option trading allows traders to speculate on price movements or hedge positions with limited capital, offering leverage and flexibility through calls (buy) and puts (sell) contracts.
Risk and Reward
Options carry high profit potential but significant risk due to time decay and volatility. Successful trading requires analysis, discipline, and understanding of premium pricing and expiry.

Candle Pattern Explained There are two primary types of options: Call Options and Put Options. A Call Option gives the buyer the right to purchase an underlying asset at a specific price (called the strike price) before or on a certain date (known as the expiry date). Traders buy calls when they expect the price of the asset to rise. Conversely, a Put Option gives the buyer the right to sell the asset at the strike price within a specific period. Traders buy puts when they anticipate the asset’s price will fall.

Part 6 Institutional Trading Option Trading in India
In India, option trading is available on major exchanges like NSE and BSE, primarily for:
Equity Options (Stocks)
Index Options (NIFTY, BANK NIFTY, FINNIFTY)
Contracts are settled in cash, and trading happens in defined lot sizes. Most retail traders prefer index options due to liquidity and low margin requirements.

Part 3 Institutional Trading Uses of Option Trading
Hedging: Protecting an existing portfolio from adverse price movements.
Example: Buying a Put Option to hedge a long stock position.
Speculation: Betting on price movement direction with limited capital.
Example: Buying Call Options if expecting a stock to rise.
Income Generation: Selling options to collect premiums in range-bound markets.
Example: Covered Call Writing.

Part 2 Ride The Big MovesUses of Option Trading
Hedging: Protecting an existing portfolio from adverse price movements.
Example: Buying a Put Option to hedge a long stock position.
Speculation: Betting on price movement direction with limited capital.
Example: Buying Call Options if expecting a stock to rise.
Income Generation: Selling options to collect premiums in range-bound markets.
Example: Covered Call Writing.
Types of Option Trading Styles
American Options: Can be exercised any time before expiry.
European Options: Can be exercised only on the expiry date.
(In India, most index and stock options are European style.)
