Renewable & Energy Transition Stocks – The Future of Sustainable1. Introduction: The Global Energy Shift
The 21st century has witnessed a dramatic transformation in how the world generates and consumes energy. The era of fossil fuels — coal, oil, and gas — which once powered industrial revolutions and global economies, is now giving way to cleaner, sustainable alternatives. This shift, termed the Energy Transition, refers to the movement from carbon-intensive energy sources to low-carbon and renewable ones like solar, wind, hydro, bioenergy, and green hydrogen.
The driving forces behind this transition are multifold:
Climate Change Concerns: Rising global temperatures and carbon emissions have triggered urgent calls for decarbonization.
Technological Advancements: The cost of solar and wind energy has fallen by over 80% in the last decade.
Government Policies: Global accords like the Paris Agreement and domestic policies such as India’s National Green Hydrogen Mission are pushing clean energy adoption.
Investor Sentiment: ESG (Environmental, Social, Governance) investing has grown exponentially, favoring companies aligned with sustainability.
As a result, renewable and energy transition stocks have emerged as one of the most exciting themes in modern markets, offering long-term growth prospects while aligning with global sustainability goals.
2. Understanding Renewable & Energy Transition Stocks
Renewable and energy transition stocks are companies involved in producing, developing, or enabling clean and sustainable energy technologies. These may include:
Renewable energy producers – Solar, wind, hydro, geothermal.
Equipment manufacturers – Solar panels, wind turbines, inverters.
Energy storage & battery companies – Lithium-ion, solid-state batteries.
Green hydrogen producers – Companies working on electrolysis and hydrogen fuel infrastructure.
Electric vehicle (EV) ecosystem firms – Battery suppliers, charging network operators, EV manufacturers.
Grid modernization and smart energy firms – Companies enabling efficient distribution and storage of renewable energy.
These businesses are at the forefront of what is often called the “Green Industrial Revolution.”
3. The Global Landscape of Renewable Energy
Globally, renewable energy has reached an inflection point. According to the International Energy Agency (IEA), renewables are expected to account for more than 50% of global electricity generation by 2030.
Key trends include:
Solar Power Boom: Solar PV capacity is doubling roughly every three years, making it the cheapest energy source in many regions.
Wind Energy Expansion: Offshore wind is gaining strong momentum in Europe and Asia.
Battery Storage Growth: Global battery capacity is projected to grow 20-fold by 2030, crucial for stabilizing intermittent renewable sources.
Green Hydrogen Revolution: Countries like Japan, Germany, and India are investing billions to develop hydrogen as a clean fuel alternative for heavy industries and transport.
Carbon Trading & ESG Investing: Institutional investors are allocating capital towards companies that meet sustainability benchmarks.
4. India’s Renewable Energy Revolution
India has emerged as a global leader in renewable energy adoption. With a strong policy push, ambitious targets, and a growing domestic industry, India’s clean energy ecosystem is rapidly expanding.
Key Highlights:
Installed Renewable Capacity: Over 190 GW (as of 2025), out of a total power capacity of ~440 GW.
Target: 500 GW of non-fossil fuel-based capacity by 2030.
Solar Energy: India ranks among the top 5 globally in solar installations, driven by states like Rajasthan, Gujarat, and Tamil Nadu.
Wind Power: Tamil Nadu and Gujarat lead India’s onshore wind capacity.
Hydrogen & EV Push: The National Green Hydrogen Mission aims to make India a global hub for hydrogen production and export.
Government Support: Initiatives like the PLI (Production Linked Incentive) schemes, Renewable Purchase Obligations (RPOs), and Carbon Credit Frameworks are fueling sectoral growth.
5. Major Segments in the Energy Transition Ecosystem
A. Solar Energy
Solar power is the crown jewel of the renewable revolution. Falling panel costs, improved efficiency, and government subsidies have made it highly competitive.
Key Indian Players:
Adani Green Energy Ltd. (AGEL): One of the world’s largest solar power developers with over 20 GW pipeline projects.
Tata Power Renewable Energy Ltd.: Focused on solar EPC, rooftop solar, and battery storage.
Waaree Energies & Vikram Solar: Leading module manufacturers benefiting from domestic demand and exports.
B. Wind Energy
Wind remains a crucial pillar, particularly for coastal and high-wind states.
Key Players:
Suzlon Energy Ltd.: India’s leading wind turbine manufacturer, rebounding from past debt with new orders.
Inox Wind Ltd.: Active in turnkey projects and turbine manufacturing.
C. Energy Storage & Battery Technology
The renewable revolution is incomplete without storage solutions. Batteries stabilize grid supply and support EVs.
Leading Firms:
Amara Raja Energy & Mobility Ltd.
Exide Industries Ltd.
Tata Chemicals (in EV battery materials).
Reliance Industries Ltd. (building Giga factories for cell manufacturing).
D. Electric Vehicles & Charging Infrastructure
EVs are a cornerstone of the clean energy transition. With government incentives (FAME II, PLI), India’s EV ecosystem is expanding fast.
Top Stocks:
Tata Motors: Leading EV carmaker.
Olectra Greentech: Electric bus manufacturer.
Exicom Tele-Systems & Servotech Power Systems: EV charging infrastructure.
Ola Electric: Upcoming IPO; focuses on two-wheelers and battery tech.
E. Green Hydrogen & Fuel Cells
Hydrogen is expected to revolutionize industrial and heavy transport sectors.
Top Indian Participants:
Reliance Industries: Investing heavily in green hydrogen and solar.
NTPC & IOC: Setting up pilot hydrogen projects.
Larsen & Toubro (L&T): Partnering in electrolyzer manufacturing.
F. Power Utilities Transitioning to Green
Traditional energy companies are also diversifying into renewables.
Examples:
NTPC Green Energy Ltd.
JSW Energy Ltd.
Torrent Power Ltd.
These firms are gradually reducing coal dependency and increasing renewable capacity.
6. Financial Performance & Market Trends
Renewable energy stocks have been among the top performers globally over the past five years.
In India, several renewable and transition-related stocks have delivered multibagger returns due to strong project pipelines, policy support, and rising energy demand.
Key Market Drivers:
Falling Input Costs: Lower cost of solar modules, wind turbines, and storage systems.
Strong Policy Support: Clear long-term targets and PLI incentives.
Rising Institutional Interest: ESG and green funds are channeling massive capital into this space.
Corporate Decarbonization Goals: Large corporations are sourcing renewable power for sustainability commitments.
However, volatility remains due to:
Supply chain disruptions (solar modules, lithium).
Interest rate fluctuations impacting capital-intensive projects.
Policy execution delays in large-scale installations.
7. Global Leaders in Renewable & Transition Stocks
Globally, several companies lead the charge:
NextEra Energy (USA): One of the world’s largest renewable power generators.
Enphase Energy & SolarEdge (USA): Specialize in solar inverters and microinverters.
Vestas (Denmark) & Siemens Gamesa (Spain): Global wind turbine giants.
Plug Power (USA) & Nel ASA (Norway): Leaders in hydrogen technology.
Tesla (USA): Beyond EVs, Tesla’s energy division is revolutionizing battery storage and solar solutions.
These global firms often set benchmarks for innovation and profitability in the sector, influencing investor sentiment in emerging markets like India.
8. Government Policies Driving India’s Energy Transition
India’s renewable momentum is underpinned by robust government initiatives:
National Solar Mission: Aims to make India a global solar leader.
PLI Scheme for Solar & Batteries: Incentives for domestic manufacturing to reduce import dependency.
Green Hydrogen Mission (₹19,744 crore): To produce 5 MMT of green hydrogen annually by 2030.
Energy Conservation Act Amendment (2022): Introduced carbon trading and stricter emission norms.
State-level Net Metering Policies: Promote rooftop solar adoption.
Such initiatives provide long-term policy stability and investor confidence.
9. Challenges Facing the Sector
Despite rapid growth, several hurdles persist:
High Capital Costs: Initial investments remain steep.
Land Acquisition Issues: Large-scale solar and wind projects need vast land areas.
Transmission Constraints: Renewable energy is often produced far from consumption centers.
Storage Limitations: Battery technology, though improving, remains expensive.
Policy Uncertainty: Frequent regulatory changes at the state level can affect project timelines.
Nevertheless, technology improvements and economies of scale are expected to reduce these challenges over time.
10. Future Outlook (2025–2035)
The next decade is expected to be transformational for renewable and energy transition stocks.
Growth Catalysts:
India’s commitment to Net Zero by 2070 ensures decades of policy and investment support.
Corporate Power Purchase Agreements (PPAs) will boost renewable demand.
Hydrogen & Battery Ecosystem Development will attract global partnerships.
Digitalization & AI Integration in energy management will improve efficiency.
Global Capital Inflows: Sovereign and ESG funds are increasing allocations to clean energy projects.
By 2030, India could see over $250 billion in renewable investments, creating immense opportunities for investors.
11. Investment Perspective: How to Approach the Sector
From an investment standpoint, renewable & transition stocks can be categorized as:
Core Energy Producers: Adani Green, NTPC Green, JSW Energy.
Equipment Manufacturers: Waaree Energies, Suzlon, Inox Wind.
Storage & Battery Makers: Amara Raja, Exide, Tata Chemicals.
EV Ecosystem Players: Tata Motors, Olectra, Servotech Power.
Diversified Conglomerates: Reliance, L&T, IOC (expanding into hydrogen and renewables).
Investors should focus on:
Long-term vision: These are structural growth stories, not short-term trades.
Strong balance sheets: Many players are capital-intensive.
Government-backed projects: Ensure visibility of revenues.
Technological advantage: Efficiency and innovation lead to higher margins.
12. Conclusion: The Dawn of a Green Era
The energy transition is not merely a policy trend — it’s a paradigm shift reshaping the global economy. Renewable and energy transition stocks are at the heart of this transformation, symbolizing the movement toward a sustainable, low-carbon future.
India stands at a unique juncture: with abundant sunlight, a vast coastline for wind potential, supportive policies, and entrepreneurial drive, it is poised to become one of the world’s top green energy hubs.
For investors, the renewable energy sector offers not just returns, but an opportunity to participate in building the energy foundation of the future. While short-term volatility may persist, the long-term trajectory is unmistakably upward — driven by innovation, necessity, and the world’s collective pursuit of sustainability.
Trend Line Break

Banking Sector Leadership & PSU Bank Rally – A Deep Dive1. Introduction
The Indian stock market has witnessed several phases of leadership rotation over the years. At times, technology stocks dominate; at other times, energy or infrastructure sectors take the front seat. However, whenever the broader market gears up for a major uptrend or a new bull cycle begins, the Banking sector often takes the leadership role — and within that, Public Sector Undertaking (PSU) banks frequently emerge as key outperformers.
The recent rally in PSU banks and the resurgence of the banking sector as a whole highlight not just cyclical market behavior but also deep structural changes in the Indian economy. To understand this movement, it’s important to analyze both why banking leads and what’s fueling the PSU bank rally in particular.
2. Why Banking Sector Often Leads the Market
a. Core to Economic Growth
Banks are the financial backbone of any economy. When economic activity expands — whether through manufacturing, infrastructure, or consumer spending — banks benefit directly. Credit growth picks up, deposit bases rise, and loan demand strengthens. Therefore, the health and momentum of the banking sector often act as a mirror of economic strength.
b. Credit Cycle Expansion
A strong economy usually corresponds to an expanding credit cycle. When businesses borrow more for expansion, and individuals take more loans for consumption (homes, vehicles, education), banks record higher net interest income (NII) and better profitability.
During the early-to-mid phase of a bull market, credit growth typically accelerates sharply, turning the banking sector into a market leader.
c. Interest Rate Cycle and Net Interest Margins
The interest rate environment plays a crucial role. When rates stabilize after a hiking cycle, banks — especially those with a large low-cost deposit base — witness margin expansion. With loan yields rising faster than deposit costs, Net Interest Margin (NIM) improves.
This scenario often unfolds in the mid-stages of economic recovery — precisely when the stock market’s optimism about growth is at its peak.
d. Heavy Market Weightage
In indices like the Nifty 50 and Bank Nifty, banking and financial services account for around 35–40% of total weightage. Naturally, whenever large investors — both domestic and foreign — turn bullish on India, their first entry point is often the banking sector, leading to index-level leadership.
3. Banking Sector’s Structural Transformation
The Indian banking landscape has undergone a major transformation over the last decade — both in private and public sectors.
a. Clean-up of Balance Sheets
Post the 2014–2018 NPA crisis, Indian banks, particularly PSUs, faced massive challenges due to bad loans, corporate defaults, and poor asset quality. The Insolvency and Bankruptcy Code (IBC) and RBI’s asset quality reviews forced banks to recognize, provision, and resolve bad assets.
Today, most major banks — especially SBI, Bank of Baroda, Canara Bank, and Union Bank — have net NPA ratios below 1%–1.2%, compared to 5–6% a few years ago. This clean-up has set the stage for a sustainable recovery.
b. Digitization & Efficiency Gains
The digital transformation in banking — UPI, mobile apps, digital KYC, and paperless loans — has enhanced operational efficiency, reduced cost-to-income ratios, and improved customer acquisition. PSU banks, once lagging behind in technology, have now made significant progress through partnerships with fintechs and internal digital drives (like SBI’s YONO or BoB World).
c. Government Recapitalization and Consolidation
Between FY2017 and FY2021, the Indian government infused over ₹3 lakh crore into PSU banks, strengthening their capital buffers. Additionally, bank mergers created stronger entities — for example:
Bank of Baroda absorbed Dena and Vijaya Bank,
Canara Bank merged with Syndicate Bank,
Union Bank merged with Andhra and Corporation Bank.
This consolidation reduced fragmentation, created scale, and enhanced competitiveness.
4. The PSU Bank Rally – What’s Driving It?
The PSU bank rally has been one of the most notable themes in the Indian stock market in recent years. After a decade of underperformance, these stocks have turned into multi-baggers, with several PSU banks delivering 200–500% returns in just 2–3 years.
Let’s decode the reasons behind this rally:
a. Massive Valuation Re-rating
For a long time, PSU banks traded at deep discounts to book value — often between 0.3x to 0.6x — reflecting investor pessimism. With the clean-up of balance sheets, profitability return, and stable management, the market started to re-rate these banks.
Currently, large PSU banks trade at 1.0–1.5x P/B, still lower than private peers (2.5x–4x), leaving room for further revaluation.
b. Return of Profitability
Post-2020, PSU banks started showing consistent quarterly profits, driven by lower provisioning costs and higher NII.
Example:
SBI’s FY2025 profits are expected to exceed ₹75,000 crore,
Canara Bank, BoB, and Union Bank are recording ROEs above 15%, levels not seen in over a decade.
These results changed investor sentiment from skepticism to confidence.
c. Credit Growth Momentum
PSU banks are witnessing robust credit growth of 12–14%, led by retail loans (housing, personal, auto), SME lending, and corporate capex revival. Their strong presence in rural and semi-urban areas gives them an edge in deposit mobilization, leading to stable funding costs.
d. Capital Adequacy & Improved Asset Quality
Thanks to recapitalization and internal profit generation, most PSU banks now have Capital Adequacy Ratios above 14%, giving them room to expand their balance sheets. Their Gross NPA ratios have fallen below 4%, compared to 10–12% in 2018.
e. FII and DII Interest
Foreign Institutional Investors (FIIs) and Domestic Institutional Investors (DIIs) have both turned net buyers of PSU banks. The segment is considered a proxy for India’s growth story — benefiting from both cyclical and structural drivers.
Moreover, PSU banks offer attractive dividend yields (3–5%) and stable earnings visibility, making them a favorite in the current interest rate environment.
5. Comparing PSU vs Private Banks
Parameter PSU Banks Private Banks
Valuation (P/B) 0.9–1.5x 2.5–4.0x
ROE/ROA Improving (12–15%) High (16–18%)
NIM 3–3.3% 3.5–4.5%
Asset Quality Improved, but slightly lower Very strong
Technology Adoption Rapidly catching up Already advanced
Growth Drivers Retail, Infra, SME, Rural Credit Premium Retail, Digital, Corporate
Investor Sentiment Recovering fast Already strong
The valuation gap between PSU and private banks has started narrowing, but PSUs still remain value plays, whereas private banks are seen as quality growth plays.
6. Banking Sector as Market Leader in 2025 Cycle
In the ongoing market cycle, banking is again showing signs of leadership emergence, driven by several factors:
a. Capex Revival
India’s private and public sector capex is gaining momentum — from roads and ports to data centers and manufacturing. Banks will play a financing role in this multi-trillion-rupee expansion phase.
b. Liquidity & Deposit Growth
Despite competition from small finance and fintech banks, traditional banks — especially PSUs — have maintained strong CASA (Current Account Savings Account) ratios, ensuring liquidity. This gives them pricing power in a tightening liquidity environment.
c. Credit Quality Cycle at Its Best
With low slippages and strong recoveries, India is in the best credit quality cycle in two decades. Credit costs (provisions as a % of assets) are at multi-year lows, directly boosting profitability.
d. Government Support & Reforms
The government continues to push for PSU bank modernization, privatization of smaller entities, and improvement in governance. The “bad bank” (NARCL) initiative has further helped clear legacy NPAs.
e. Rising Financialization of Savings
With rising income levels and formalization, more money is flowing into banking and financial systems — deposits, mutual funds, and loans — further deepening the sector’s dominance.
7. Technical & Market Structure Perspective
From a market structure angle, the Bank Nifty index is often the leading indicator for Nifty’s trend direction. Historically:
When Bank Nifty outperforms Nifty, it signals broad-based bullishness.
When PSU banks outperform private banks, it often indicates a mid-stage bull market, where value stocks catch up with growth stocks.
As of 2025, both Bank Nifty and Nifty PSU Bank Index are trading near record highs, showing strong volume support, healthy price structure, and institutional accumulation — confirming that leadership lies with the banking pack.
8. Risks & Challenges
Despite strong fundamentals, certain risks remain:
Interest Rate Volatility: A sharp rate hike cycle can squeeze margins.
Global Slowdown: If export demand or global growth falters, corporate loan demand may soften.
Competition from Fintechs: Fintechs may eat into certain profitable retail segments.
Policy Risks: Privatization delays or regulatory tightening can temporarily hurt PSU valuations.
However, these are manageable risks in the current macro setup, as most PSU and private banks maintain high provisioning buffers and stable management practices.
9. Outlook for 2025 and Beyond
The outlook for the banking sector remains constructive and bullish. Analysts expect:
Credit growth of 12–14% CAGR,
NIMs to remain steady,
ROEs to sustain above 14%,
Asset quality to remain stable.
PSU banks are expected to narrow the valuation gap with private banks as they continue to deliver consistent profits, higher dividends, and improved governance.
In the medium term (2025–2027), the PSU Bank Index could potentially outperform broader indices, supported by:
Credit growth in infrastructure, housing, and MSMEs,
Rising investor confidence,
India’s macroeconomic resilience.
10. Conclusion
The Banking sector’s leadership in the market is not accidental — it is rooted in economic cycles, financial system dominance, and investor psychology. Every major bull market in India’s history has been led, directly or indirectly, by banks.
The PSU Bank rally represents not just a price recovery but a structural turnaround story — from being crisis-hit entities plagued by NPAs and inefficiency to becoming profitable, tech-savvy, dividend-paying institutions aligned with India’s growth narrative.
As India’s GDP moves toward the $5 trillion mark, and capex, consumption, and credit cycles expand together, banks — both private and public — will remain the torchbearers of the next leg of India’s equity bull market.

Part 1 Candle Stick PatternOption Greeks – Measuring Risk Factors
Option traders use Greeks to analyze the sensitivity of an option’s price to various factors:
Delta: Measures the rate of change of option price relative to the underlying asset.
Gamma: Measures the rate of change of Delta itself.
Theta: Measures time decay — how much value the option loses as expiry nears.
Vega: Measures sensitivity to volatility.
Rho: Measures sensitivity to interest rates.
Understanding Greeks helps traders manage their portfolio risk effectively.

Part 2 Support and ResistanceOption Pricing – The Black-Scholes Model
The price of an option (premium) is determined using models like the Black-Scholes Model, which considers several factors:
Underlying Asset Price
Strike Price
Time to Expiry
Volatility of the Underlying Asset
Risk-Free Interest Rate
Dividends (if applicable)
Of these, volatility and time decay have the most significant influence. As expiry approaches, options lose value due to time decay, especially for out-of-the-money contracts.

Part 1 Support and Resistance Participants in Option Markets
Different types of traders participate in option markets for various reasons:
Hedgers: Use options to protect their portfolio from adverse price movements.
Speculators: Aim to profit from price fluctuations in the underlying asset.
Arbitrageurs: Exploit price differences between related instruments to earn risk-free profits.
Institutional Investors: Use complex option strategies for portfolio management and risk control.

Part 1 Intraday Trading Masterclass What Are Options?
An option is a financial derivative that gives the holder the right, but not the obligation, to buy or sell an underlying asset (like a stock, index, or commodity) at a predetermined price on or before a specific date.
There are two main types of options:
Call Option: Gives the holder the right to buy the underlying asset.
Put Option: Gives the holder the right to sell the underlying asset.
The buyer of an option pays a premium to the seller (also called the writer) for this right. The premium depends on various factors like time to expiry, volatility, and the price of the underlying asset.

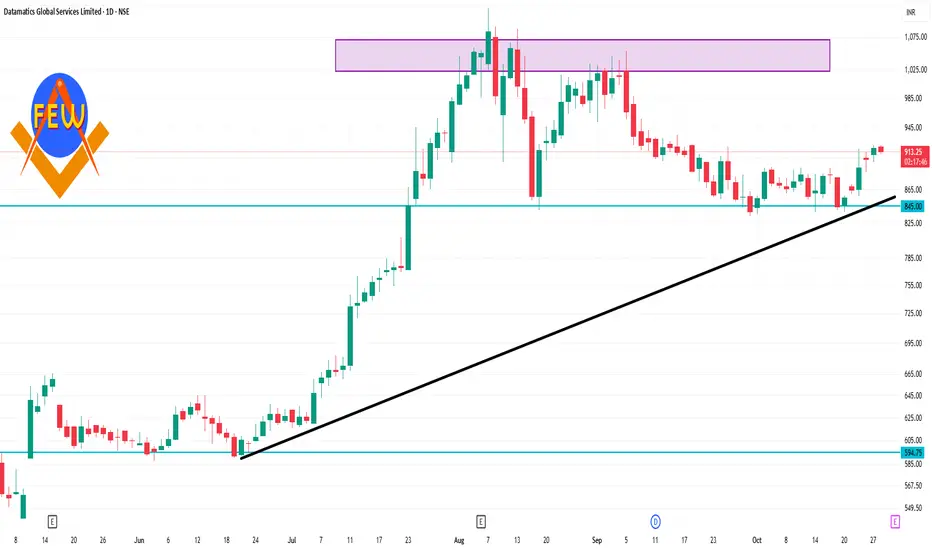
DATAMATICS 1 Day Time Frame ✅ Key current context
The stock is trading around ₹900-₹915 (last close ~₹903.60).
The 52-week high is ~ ₹1,120, low ~ ₹515.
Short-term momentum indicators show bullish bias: e.g., moving averages across 5, 10, 20, 50, 100, 200 days are all signalling “buy”.
Technical services list daily pivot/support/resistance levels for the stock.
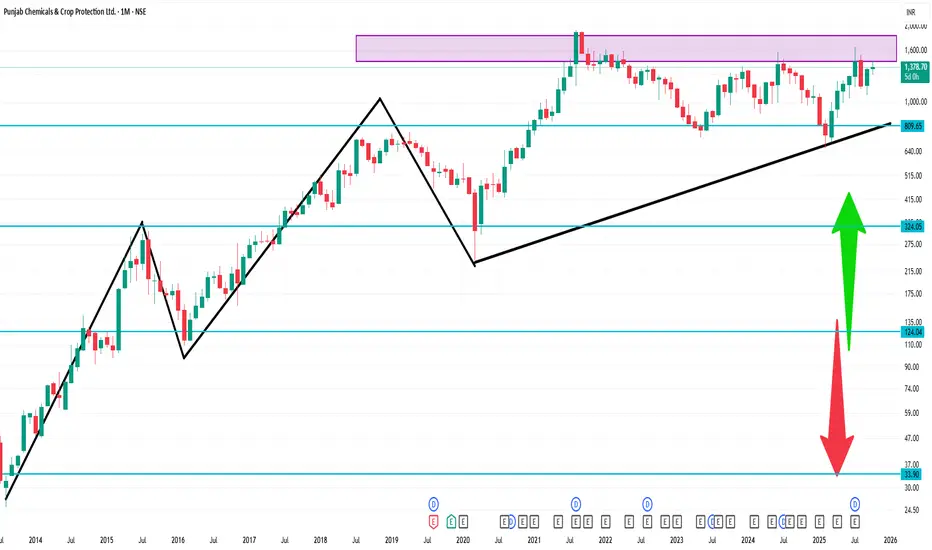
CGPOWER 1 Month Time Frame 🔍 Current snapshot
Last close around ₹723.85.
52-week low ≈ ₹517.70, 52-week high ≈ ₹811.40.
Technical indicators show: 20 day SMA around ~₹746, 100 day SMA ~₹705.86.
🎯 My Outlook / Scenario Planning
Base case: The stock trades between ~₹716 and ~₹740 over the next month, oscillating around the current zone.
Bull case: If it clears resistance around ~₹740 with good volume, it may push toward ~₹755-₹770.
Bear case: If it breaks below ~₹716, watch for slide toward ~₹690-₹700 as next margin of support.

LiamTrading - XAUUSD: SCENARIO AHEAD OF FOMCLiamTrading - XAUUSD: SCENARIO AHEAD OF FOMC - The $3840 Mark Awaits a Bottom Catch Reaction Wave
Hello trading community,
The Gold market is exhibiting a strong and sustainable downtrend. We are witnessing a crash after the price broke through key support zones. With the upcoming FOMC event, our strategy is to seek Buy opportunities at deep liquidity zones and continue to Sell when the price recovers to retest the broken trend.
📰 MACRO ANALYSIS & CASH FLOW CONTEXT
Gold is currently under dual pressure:
Bearish Pressure 🔴: Optimism about the US-China trade progress has significantly weakened the demand for Gold, traditionally a safe-haven commodity. Spot Gold prices have fallen below $3950, hitting a three-week low, down about 0.78% on the day (28/10).
Short-term Support 🟢: Bets on the possibility of Fed rate cuts continue to weaken the US Dollar (USD), which is the only factor that could potentially support this precious metal.
Conclusion: This tug-of-war makes bottom identification challenging. The bearish scenario remains the top priority.
📊 TECHNICAL ANALYSIS: THE DOWNWARD WAVE CONTINUES
Based on the H4 chart (image_5fa7fa.png):
Current Trend: The price has successfully broken the key liquidity support zone near $3950 and is continuing its downward momentum.
Current Fibonacci Level: The price is touching and reacting at the 1.618 Fibonacci level (around $3950).
Next Target: The next target for Gold will be the 2.618 Fibonacci area (around $3840), which is a large liquidity zone expected to see strong reactions.
Main Strategy: We focus on two scenarios: Catching the bottom reaction at 3840 and continuing to Sell when the price rebounds.
🎯 DETAILED TRADING PLAN (ACTION PLAN)
We have two detailed scenarios based on the current price level:
🟢 BUY Reversal Scenario
We wait for the price to hit the deep liquidity bottom at 3840 to execute a buy order with the expectation of a technical recovery.
Entry Zone: 3840
Stop Loss (SL): 3832 (tight SL)
Take Profit Targets (TP): TP1: $3872 | TP2: $3898 | TP3: $3925 | TP4: $3950
🔴 SELL Retest Scenario
If Gold recovers without breaking the downtrend structure:
Entry Zone: Watch for a Sell retest at $4091
Stop Loss (SL): $4099
Take Profit Targets (TP): TP1: $4065 | TP2: $4033 | TP3: $4004 | TP4: $3965
SUMMARY & DISCIPLINE (Steven's Note)
Gold is in a strong decline ahead of the FOMC, with significant volatility expected. Capturing deep Fibonacci and Liquidity zones is key.
Note: Always adhere to the set Stop Loss. Capital management is the top priority, risking only 1-2% of the account per trade.
Wishing traders a successful and disciplined new trading week!

Institutional Trading SecretsUnderstanding the Power Behind the Markets
Institutional trading refers to the buying and selling of securities by large financial organizations such as mutual funds, hedge funds, pension funds, insurance companies, and investment banks. These institutions handle large pools of capital and have the ability to influence market movements significantly. Unlike retail traders, institutions operate with complex algorithms, proprietary research, and vast resources. Understanding the secrets behind institutional trading provides insights into how professional money moves and how markets truly function beneath the surface.
1. The Foundation of Institutional Trading
Institutional trading is built on the principles of scale, strategy, and information. Institutions are responsible for managing billions of dollars in assets, meaning their trades can affect prices, liquidity, and volatility. Unlike individual traders, institutional players do not focus on small daily profits; they aim for consistent, risk-adjusted returns over the long term.
Their edge comes from three primary advantages:
Access to superior information and research
Advanced trading technology and algorithms
Ability to influence market microstructure
These institutions employ teams of analysts, quants, and traders who specialize in market data interpretation, economic forecasting, and risk management. Every trade is calculated with precision, often based on complex quantitative models rather than emotion or speculation.
2. The Role of Liquidity and Market Impact
One of the biggest secrets of institutional trading lies in liquidity management. Because institutions deal with massive order sizes, they cannot simply place all their trades at once. Doing so would cause the market to move against them — a phenomenon known as market impact.
To avoid this, institutions use execution algorithms that break large orders into smaller chunks. These algorithms might spread trades across different times of the day or execute them across multiple exchanges. Common strategies include:
VWAP (Volume-Weighted Average Price): Trades are executed based on the average trading volume to minimize deviation from the day’s average price.
TWAP (Time-Weighted Average Price): Orders are distributed evenly over a specific time period to reduce visibility.
Iceberg Orders: Only a small portion of the total order is visible in the order book, hiding the true size of the position.
This ability to manage liquidity allows institutions to build or exit massive positions quietly, without alerting other market participants.
3. The Power of Information and Data Analysis
Institutional traders rely on information asymmetry — having better data and faster insights than others. While retail traders might use chart patterns or news, institutions have access to:
Real-time data feeds from multiple exchanges
Proprietary research reports
Satellite data and alternative data sources (such as shipping volumes, credit card transactions, and social media sentiment)
High-frequency data on order flow and market depth
Using these datasets, institutions employ quantitative analysts (quants) to create predictive models. These models identify statistical relationships between variables, helping predict short-term price movements or long-term trends.
For example, a hedge fund may use machine learning models to detect patterns in market volatility before major announcements, or to identify correlations between commodities and currency pairs.
The key advantage lies not just in the quantity of data, but in the speed and accuracy of interpretation. Milliseconds can make the difference between profit and loss — hence, institutions invest heavily in low-latency systems and high-speed trading infrastructure.
4. Algorithmic and High-Frequency Trading (HFT)
A large portion of institutional trading today is algorithmic. These trades are executed by automated systems that use predefined rules and mathematical models. High-Frequency Trading (HFT), a subset of algorithmic trading, takes this to an extreme — executing thousands of trades per second to capture small inefficiencies.
HFT firms exploit microstructure inefficiencies, such as latency arbitrage or temporary mispricing between markets. They use co-location, placing their servers physically close to exchange servers to gain microsecond advantages.
Some common institutional algorithmic strategies include:
Statistical Arbitrage: Profiting from temporary pricing discrepancies between correlated assets.
Market Making: Providing liquidity by continuously quoting buy and sell prices, earning the spread.
Momentum Ignition: Detecting and amplifying short-term momentum in a stock to profit from price continuation.
Event-Driven Trading: Reacting instantly to earnings announcements, mergers, or macroeconomic data.
While these methods are controversial for their speed and complexity, they enhance overall market liquidity and efficiency — though often at the cost of retail traders who cannot compete with their speed.
5. Institutional Order Flow and “Smart Money” Movement
Another secret weapon of institutional trading is order flow analysis — tracking where the “smart money” is moving. Institutions often coordinate trades across different asset classes to hedge risk or exploit correlations. For example, when an institution buys a large amount of NIFTY futures, it may simultaneously hedge by shorting correlated global indices or purchasing options to manage volatility exposure.
This coordinated movement of funds creates institutional footprints, often visible in sudden spikes in volume, price momentum, or open interest. Professional traders and market analysts try to detect these footprints to “follow the smart money.”
For instance, if heavy institutional buying is detected in the banking sector, it may signal a longer-term bullish trend that retail traders can align with.
6. Dark Pools and Hidden Liquidity
One of the lesser-known aspects of institutional trading is the use of dark pools — private exchanges where large trades are executed anonymously.
Unlike public exchanges (like NSE or BSE), dark pools allow institutions to buy or sell significant quantities without revealing their intentions to the market. This protects them from adverse price movement caused by front-running or speculation.
Dark pools help maintain stability in the market by preventing sudden volatility. However, they also reduce transparency, which can disadvantage smaller market participants who cannot see these hidden orders.
7. Risk Management and Portfolio Hedging
Institutions never trade without a comprehensive risk management framework. Every position is assessed based on its potential drawdown, volatility, and correlation with other holdings.
They use Value-at-Risk (VaR) models, stress testing, and scenario analysis to simulate potential losses under various conditions. For example, a portfolio manager may test how their portfolio would perform if oil prices drop 20% or interest rates rise by 1%.
Institutions also employ hedging instruments such as:
Derivatives (futures, options, and swaps) to offset market exposure.
Currency hedges to protect international investments.
Interest rate swaps to manage bond portfolio risks.
By combining multiple hedging layers, institutions ensure consistent performance even in volatile markets.
8. Behavioral and Sentiment Analysis
Beyond numbers, institutional traders also study market psychology. They monitor sentiment indicators like the VIX (Volatility Index), Put-Call Ratios, and Institutional Investor Confidence Index to gauge crowd behavior.
Some advanced firms apply natural language processing (NLP) to scan news headlines, earnings transcripts, and even social media posts in real time. The goal is to quantify sentiment and anticipate how collective emotions might affect price movements.
This behavioral edge allows institutions to stay one step ahead — buying when fear dominates and selling when euphoria peaks.
9. The Role of Prime Brokers and Custodians
Institutions do not operate alone. They rely on prime brokers and custodians to execute, clear, and settle trades efficiently. Prime brokers offer leverage, research, and risk management tools. They also provide access to short-selling opportunities and synthetic products.
Custodians, on the other hand, ensure safekeeping of assets and manage compliance, reporting, and settlements. This interconnected network ensures that large volumes of capital can move globally without friction or error.
10. Institutional Trading in India
In the Indian market, institutional participation is dominated by Foreign Institutional Investors (FIIs) and Domestic Institutional Investors (DIIs) such as mutual funds, insurance companies, and pension funds.
Their trades have a massive influence on the direction of the NIFTY and SENSEX indices. For instance, sustained FII inflows usually push the market upward, while heavy outflows can trigger sharp corrections.
Indian institutions are also embracing algorithmic and quantitative strategies, aided by the rapid modernization of exchanges like the NSE, which support co-location and API-based trading. The growth of mutual funds and ETFs has further increased institutional control over market liquidity and price discovery.
11. How Retail Traders Can Learn from Institutions
While retail traders cannot match institutional power, they can learn from their principles:
Trade with a plan: Use a disciplined, data-driven strategy rather than emotion.
Focus on risk: Limit losses with proper stop-losses and portfolio diversification.
Follow liquidity: Trade in stocks or sectors where institutions are active — their presence adds predictability and stability.
Analyze institutional activity: Track FII/DII data, open interest changes, and large block trades to infer smart money direction.
Adopt technology: Use algorithmic tools, scanners, and analytics to level the playing field.
12. The Future of Institutional Trading
The future of institutional trading lies in AI-driven decision-making, blockchain integration, and decentralized finance (DeFi). Artificial intelligence is already helping institutions automate not just execution but also research and portfolio optimization.
With blockchain, trade settlements may become instantaneous, reducing counterparty risk. Meanwhile, DeFi could open institutional access to tokenized assets and decentralized liquidity pools.
As markets evolve, the line between institutional and retail trading will continue to blur — but institutions will remain the key players shaping market trends and innovations.
Conclusion
Institutional trading is the invisible hand guiding global markets. Behind every price movement lies a calculated series of actions from funds and institutions managing vast sums of money. Their “secrets” are not mystical — they stem from disciplined execution, superior data, advanced algorithms, and rigorous risk management.
For retail traders, understanding these mechanisms provides not only perspective but also opportunity. By studying how institutional money flows, aligning trades with their direction, and adopting their disciplined mindset, individuals can navigate markets more intelligently.
In essence, the greatest secret of institutional trading is consistency — a relentless pursuit of efficiency, precision, and control. Institutions may move billions, but their real strength lies in the strategy and science behind every move.

High-Frequency Trading (HFT) in the Indian MarketIntroduction
High-Frequency Trading (HFT) represents one of the most advanced and technology-driven forms of trading in modern financial markets. It relies on powerful algorithms, lightning-fast computers, and low-latency connections to execute a large number of orders within microseconds. In India, HFT has gradually become an integral part of the trading ecosystem, especially after the introduction of sophisticated trading infrastructure by exchanges like the National Stock Exchange (NSE) and the Bombay Stock Exchange (BSE). Though often controversial, HFT contributes significantly to liquidity, efficiency, and price discovery in Indian capital markets.
Understanding High-Frequency Trading (HFT)
HFT is a subset of algorithmic trading where computers make decisions to buy or sell securities based on pre-programmed instructions. The key distinction lies in speed — trades are executed in microseconds, a fraction of the time it takes a human to blink.
HFT algorithms analyze multiple market conditions such as order book depth, price trends, and volatility to identify fleeting profit opportunities. These opportunities often exist for mere milliseconds, so the ability to react faster than competitors determines success.
The backbone of HFT includes:
Colocation services – where trading firms place their servers close to exchange data centers to minimize latency.
Ultra-low latency networks – to ensure rapid data transmission and order execution.
High-speed data feeds – providing real-time updates on prices and market depth.
Evolution of HFT in India
HFT made its first appearance in India in the late 2000s, when the NSE introduced colocation services in 2010. This allowed institutional traders and brokers to place their servers within exchange premises, significantly reducing order execution times.
By 2012, the share of HFT and algorithmic trades in total market volume had reached approximately 30–40%, primarily led by institutional investors and proprietary trading firms.
Over the years, the Indian market has witnessed:
Growth of technology infrastructure – The NSE and BSE adopted advanced trading systems and low-latency networks.
Entry of domestic and global algorithmic trading firms – Many firms specializing in market making and statistical arbitrage began operating in India.
Regulatory oversight – The Securities and Exchange Board of India (SEBI) introduced several guidelines to ensure fairness and transparency, including mandatory audits, approval processes, and controls against manipulative practices.
Today, estimates suggest that over 50% of trades in Indian equity and derivatives markets involve some form of algorithmic or high-frequency trading activity.
How HFT Works
HFT firms rely on a combination of mathematics, computer science, and finance. The typical HFT process involves several stages:
Market Data Collection
HFT systems continuously collect tick-by-tick data from multiple sources – stock exchanges, news feeds, and global markets.
Signal Generation
Algorithms process this data using statistical models and machine learning techniques to identify potential trading opportunities, such as arbitrage or momentum signals.
Order Execution
Once a signal is generated, orders are executed automatically. HFT systems use smart order routing to send orders to the exchange with the best available price and liquidity.
Risk Management
Real-time risk monitoring ensures that exposure limits are not breached and that orders conform to regulatory and internal compliance standards.
Post-Trade Analysis
After trades are completed, systems analyze performance metrics to refine future strategies.
The entire cycle – from data analysis to trade execution – can occur within microseconds.
Popular HFT Strategies in the Indian Market
HFT encompasses various strategies, each designed to exploit short-term inefficiencies:
Market Making
Market makers continuously quote buy and sell prices to provide liquidity. They profit from the bid-ask spread and help reduce market volatility. Many Indian brokers engage in HFT-based market making on NSE’s derivatives and currency segments.
Statistical Arbitrage
This involves identifying mispricings between correlated assets or instruments. For example, if two stocks historically move together but temporarily diverge, HFT algorithms can exploit the spread before it converges again.
Index Arbitrage
HFT systems arbitrage between an index and its constituent stocks. For instance, if the Nifty 50 futures deviate from its underlying basket’s fair value, algorithms execute trades to capture the difference.
Latency Arbitrage
This strategy leverages speed advantages to exploit price discrepancies that exist for milliseconds between exchanges or instruments.
Event-Based Trading
HFT systems respond instantly to news events, economic data releases, or corporate announcements by analyzing sentiment and trading accordingly.
Liquidity Detection (Sniffing)
Some algorithms attempt to detect large hidden orders (iceberg orders) placed by institutional investors and trade strategically around them.
Infrastructure Enabling HFT in India
The success of HFT heavily depends on the trading infrastructure. Indian exchanges have developed world-class facilities to support low-latency trading:
Colocation Services: NSE and BSE offer colocation racks where brokers can install their trading servers next to the exchange’s systems.
Dedicated Leased Lines and Microwave Networks: For ultra-fast data transfer, firms use optical fiber or microwave links that minimize latency.
Advanced Matching Engines: Exchange engines are optimized to match orders in microseconds.
Smart Order Routers: These ensure that trades are executed at the best available price across multiple exchanges.
Regulatory Framework by SEBI
The Securities and Exchange Board of India (SEBI) has been proactive in regulating HFT to ensure fair and transparent markets. Some key guidelines include:
Colocation Access Norms (2010)
Exchanges were directed to ensure equal access to colocation facilities without favoritism.
Algorithmic Trading Approval (2012)
Brokers using algos must get each strategy approved by the exchange.
Order-to-Trade Ratio Limits (2015)
To discourage excessive order cancellations, SEBI set limits on the ratio of orders placed to trades executed.
Randomization of Order Processing (2017)
To reduce latency advantage, exchanges were asked to randomize the order queue slightly.
Audit and Reporting Requirements
Regular algorithmic audits ensure compliance with market integrity and prevent manipulative practices like spoofing or layering.
Latency Equalization Plans (LEP)
SEBI and exchanges have discussed measures to equalize latency across participants, ensuring that small brokers and retail investors are not disadvantaged.
Advantages of HFT in the Indian Market
Enhanced Liquidity
HFT provides continuous buy and sell orders, reducing bid-ask spreads and ensuring smoother price discovery.
Efficient Price Discovery
By reacting instantly to new information, HFT ensures that prices reflect available data faster.
Reduced Transaction Costs
Higher liquidity translates into tighter spreads, benefiting all market participants.
Improved Market Depth
HFT firms add orders at multiple price levels, enhancing overall market depth and stability.
Technological Advancement
The presence of HFT has encouraged Indian exchanges and brokers to adopt cutting-edge technology and infrastructure.
Risks and Criticisms
Despite its advantages, HFT has drawn criticism due to concerns about fairness, stability, and manipulation.
Market Manipulation
Practices like “spoofing” (placing fake orders) or “quote stuffing” (flooding the market with orders to slow competitors) can distort prices.
Systemic Risk
A malfunctioning algorithm can trigger flash crashes. The 2012 Knight Capital incident in the U.S. and minor glitches in Indian markets highlight this risk.
Unequal Access
Large institutions with access to colocation enjoy a speed advantage over smaller brokers and retail traders, raising fairness concerns.
Reduced Investor Confidence
Rapid and unexplained price movements may discourage long-term investors.
Regulatory Complexity
Constant monitoring and evolving technology make regulation challenging for SEBI and exchanges.
Case Studies and Incidents
NSE Co-location Controversy (2015–2018)
Allegations emerged that certain brokers received unfair access to NSE’s trading systems via colocation, giving them a latency advantage. SEBI imposed fines on NSE and directed reforms to ensure transparency.
Flash Crashes and Volatility Events
On several occasions, Indian markets witnessed sudden sharp movements attributed to algorithmic errors. For instance, in October 2012, a rogue algorithm triggered a 15% intraday fall in Nifty, causing temporary panic before recovery.
These incidents emphasized the need for robust surveillance and fail-safes.
The Role of HFT in Derivatives and Currency Markets
HFT plays a particularly vital role in futures, options, and currency derivatives, where speed and liquidity are crucial.
In the Nifty futures segment, HFT accounts for nearly 40–50% of the trading volume.
In currency derivatives, HFT improves market depth and helps maintain efficient exchange rate discovery.
By arbitraging between futures, options, and cash markets, HFT participants ensure alignment in prices across instruments.
Impact on Retail and Institutional Investors
For retail investors, HFT’s influence is both positive and negative:
Positive: Better liquidity, tighter spreads, and faster execution.
Negative: Limited ability to compete on speed; occasional volatility spikes may trigger stop-losses.
Institutional investors, on the other hand, leverage algorithmic systems for better execution and reduced slippage, often partnering with HFT firms for liquidity provision.
Technological Trends Shaping the Future of HFT
The next decade of HFT in India will be shaped by:
Artificial Intelligence (AI) and Machine Learning – Algorithms capable of adaptive decision-making and predictive analytics.
Quantum Computing – Offering potentially exponential speed gains.
Blockchain and Distributed Ledger Technology – Could revolutionize trade settlements.
5G and Edge Computing – Further reducing latency for real-time data transmission.
Integration of Global Markets – Cross-border HFT strategies as regulatory harmonization improves.
Future Outlook of HFT in India
The future of HFT in India is promising yet requires balanced oversight.
SEBI’s regulatory vigilance ensures that technology-driven efficiency doesn’t come at the cost of fairness or stability. With the Digital India initiative, expanding broadband infrastructure, and growing fintech innovation, India is set to witness a new wave of algorithmic sophistication.
HFT will likely extend beyond equities into commodities, bonds, and crypto-like regulated digital assets once frameworks evolve. However, the emphasis must remain on equal access, ethical algorithm design, and investor protection.
Conclusion
High-Frequency Trading has transformed India’s financial landscape, introducing speed, precision, and efficiency at unprecedented levels. While it brings liquidity and innovation, it also introduces challenges of fairness, stability, and ethical conduct.
The Indian regulatory system, guided by SEBI and supported by exchanges like NSE and BSE, continues to evolve to strike the right balance between technological progress and market integrity.
In the years ahead, as technology continues to reshape trading, HFT will remain a defining force in India’s journey toward becoming a globally competitive, transparent, and technology-driven financial market.
Financial Future Plan: A Roadmap to Sustainable ProsperityIntroduction
In today’s dynamic and unpredictable world, financial planning is not merely a choice—it is a necessity. The global economy constantly evolves with technological innovation, inflationary pressures, changing job markets, and shifting investment opportunities. Against this backdrop, a financial future plan acts as a guiding framework to achieve financial stability, security, and long-term wealth creation. It provides clarity about one’s income, expenses, savings, investments, and risk management strategies. A well-crafted financial plan enables individuals and families to meet their short-term needs while securing their future aspirations such as education, retirement, home ownership, and legacy planning.
1. Understanding Financial Planning
Financial planning refers to the process of managing one’s finances to achieve life goals systematically. It involves assessing current financial conditions, identifying objectives, and developing strategies to meet those goals through savings, investments, insurance, and debt management.
A financial future plan is both proactive and adaptive. It not only addresses current needs but also anticipates future uncertainties like medical emergencies, job loss, or economic downturns. It provides a sense of control and peace of mind, ensuring that financial decisions are made with a long-term perspective rather than short-term impulses.
2. Importance of Financial Future Planning
The significance of planning for the financial future cannot be overstated. It provides multiple benefits, including:
Goal Achievement:
Financial planning transforms dreams into achievable goals—whether it’s buying a home, starting a business, or ensuring a comfortable retirement.
Budget Discipline:
It instills financial discipline by tracking income and expenses, helping avoid unnecessary spending and encouraging consistent saving.
Crisis Preparedness:
By building an emergency fund and obtaining insurance, a financial plan shields individuals from unexpected financial shocks.
Wealth Creation:
Strategic investments across asset classes like equities, bonds, and real estate ensure capital appreciation and income generation.
Tax Efficiency:
Proper planning helps minimize tax liability through legal avenues like deductions, exemptions, and investment-linked benefits.
Financial Independence:
Ultimately, a sound plan enables individuals to live life on their own terms without depending on others for financial support.
3. Core Components of a Financial Future Plan
A comprehensive financial plan integrates multiple elements that work together to build long-term financial health. These components include:
a) Goal Setting
Every financial journey begins with goal setting. Goals must be SMART — Specific, Measurable, Achievable, Relevant, and Time-bound. Examples include:
Saving ₹20 lakhs for a child’s education within 10 years
Buying a home worth ₹80 lakhs in 15 years
Accumulating ₹1 crore for retirement by age 60
Setting clear goals helps determine the investment amount, time horizon, and risk appetite.
b) Budget Management
Budgeting forms the foundation of financial control. It involves listing monthly income sources, categorizing expenses, and ensuring savings are prioritized. The 50-30-20 rule serves as a useful guideline — allocating 50% to needs, 30% to wants, and 20% to savings or debt repayment.
c) Emergency Fund
An emergency fund acts as a financial cushion against unforeseen circumstances such as job loss, hospitalization, or urgent repairs. Ideally, it should cover 6–12 months of essential expenses and be parked in a liquid, low-risk instrument such as a savings account or money market fund.
d) Debt Management
Debt, if unmanaged, can derail financial progress. A strong plan involves reducing high-interest loans first (like credit card dues or personal loans) and maintaining a healthy credit score. Strategic borrowing for productive assets such as education or housing can be beneficial when aligned with repayment capacity.
e) Insurance and Risk Protection
Insurance is a critical risk-mitigation tool. Life, health, and asset insurance ensure financial security in case of unforeseen events. Term life insurance provides income replacement for dependents, while health insurance covers escalating medical costs, which are often financially draining.
f) Investment Planning
Investment planning transforms savings into wealth. Diversification across asset classes—equities, mutual funds, bonds, real estate, gold, and alternative assets—balances risk and return. Asset allocation should match the investor’s goals, time horizon, and risk tolerance.
Short-term goals may use fixed deposits or short-duration funds.
Medium-term goals may favor balanced or hybrid mutual funds.
Long-term goals can leverage equity mutual funds or direct equity for higher returns.
g) Retirement Planning
Retirement planning ensures financial independence during non-earning years. Early planning leverages the power of compounding, allowing small, regular contributions to grow substantially. Instruments such as the National Pension System (NPS), Public Provident Fund (PPF), and Employee Provident Fund (EPF) serve as reliable long-term savings avenues.
h) Tax Planning
Tax optimization enhances returns by reducing liabilities. Investors can utilize deductions under Sections 80C, 80D, and 80G of the Indian Income Tax Act through investments in ELSS mutual funds, insurance premiums, and health coverage. Efficient tax planning aligns with overall financial goals without compromising liquidity.
i) Estate and Legacy Planning
This ensures a smooth transfer of wealth to the next generation. Drafting a will or creating a trust prevents legal disputes and preserves wealth continuity. It reflects responsible financial stewardship and secures the family’s future.
4. Steps to Create a Financial Future Plan
Crafting an effective financial plan involves a structured, step-by-step approach:
Step 1: Assess Your Current Financial Position
Analyze income, expenses, assets, and liabilities to understand your financial baseline. This assessment reveals strengths, weaknesses, and areas for improvement.
Step 2: Define Clear Objectives
List your short-term (1–3 years), medium-term (3–10 years), and long-term (10+ years) financial goals. Prioritize them based on urgency and importance.
Step 3: Evaluate Risk Appetite
Every investor’s risk tolerance differs based on age, income, and financial obligations. Younger investors can take higher equity exposure, while older individuals may prefer stable income instruments.
Step 4: Design an Investment Strategy
Create a diversified portfolio that aligns with your time horizon and goals. Review and rebalance periodically to adapt to market or personal changes.
Step 5: Build an Emergency Fund
Set aside a dedicated corpus for unexpected expenses before aggressively investing in growth assets.
Step 6: Protect with Insurance
Ensure adequate life and health coverage. For dependents, term insurance with a sum assured 10–15 times the annual income is advisable.
Step 7: Implement and Monitor
Execution is the bridge between planning and success. Regularly review your plan—annually or after significant life events—to ensure alignment with changing circumstances.
5. The Role of Technology in Financial Planning
Digital transformation has revolutionized personal finance management. Today, individuals can track expenses, analyze investments, and plan for goals using fintech platforms, robo-advisors, and mobile applications.
Robo-advisory platforms provide algorithm-driven portfolio suggestions based on individual risk profiles.
Investment apps enable systematic investing through SIPs (Systematic Investment Plans).
AI-driven analytics offer insights into spending patterns, credit behavior, and tax-saving opportunities.
Technology has made financial planning more accessible, transparent, and data-driven, even for beginners.
6. Challenges in Financial Future Planning
Despite its importance, many individuals face hurdles in developing a robust financial plan:
Lack of Awareness:
Many people underestimate the value of long-term planning, focusing instead on immediate needs.
Inflation and Lifestyle Creep:
Rising costs erode purchasing power, while lifestyle upgrades often outpace income growth.
Market Volatility:
Fluctuating markets can test investors’ patience and confidence, leading to impulsive decisions.
Over-Reliance on Debt:
Easy credit availability can create long-term liabilities, restricting future financial flexibility.
Inconsistent Saving Habits:
Irregular savings and lack of budgeting discipline delay wealth creation.
Addressing these challenges requires awareness, education, and a disciplined approach to money management.
7. Financial Future Planning Across Life Stages
Financial priorities evolve over time. Hence, the plan must adapt to life stages:
Early Career (20s–30s):
Focus on budgeting, building emergency funds, and starting early investments. Opt for aggressive asset allocation (higher equity exposure) to leverage compounding.
Mid-Life (30s–50s):
Balance growth and stability. Prioritize child education, home loans, and insurance coverage while maintaining consistent retirement contributions.
Pre-Retirement (50s–60s):
Shift towards capital preservation. Rebalance portfolios toward fixed income, annuities, and low-risk instruments.
Retirement and Beyond:
Emphasize steady income streams, healthcare coverage, and estate management. Avoid risky investments and focus on liquidity and stability.
8. The Psychological Aspect of Financial Planning
Money management is as much about mindset as mathematics. Emotional biases—such as overconfidence, fear of loss, or herd behavior—can distort rational decision-making. Successful financial planning requires emotional intelligence, patience, and goal-focused discipline. Adopting a long-term view helps investors ride through volatility and resist impulsive behavior.
9. Role of Financial Advisors
Professional financial advisors play a crucial role in designing, executing, and monitoring financial plans. They offer expertise in portfolio diversification, tax efficiency, and estate management. With regulatory oversight and fiduciary responsibility, advisors ensure that strategies align with clients’ best interests.
10. Conclusion
A financial future plan is the blueprint for achieving stability, growth, and independence in an uncertain world. It combines analytical rigor with practical wisdom—balancing today’s needs with tomorrow’s aspirations. Whether one earns modestly or abundantly, financial success ultimately depends on discipline, consistency, and informed decision-making.
By budgeting wisely, investing intelligently, and preparing for risks, individuals can secure not only their financial well-being but also the peace of mind that comes with control over their economic destiny. As the saying goes, “A goal without a plan is just a wish.” A financial plan transforms that wish into reality—building a secure, prosperous, and confident future.

Derivatives Hedge RisksIntroduction
In the intricate and volatile world of finance, risk management stands as a central pillar for investors, corporations, and financial institutions alike. Among the most sophisticated tools available for mitigating financial uncertainty are derivatives. These financial instruments derive their value from an underlying asset, such as stocks, bonds, commodities, currencies, or interest rates. Derivatives have evolved over the decades from simple forward agreements between merchants into a complex ecosystem of futures, options, swaps, and other innovative contracts. Their fundamental purpose remains the same — to hedge risks and ensure stability in uncertain market environments.
This essay explores how derivatives hedge risks, the various types of derivatives used for hedging, real-world applications, and the benefits and challenges of their use in modern financial systems.
1. Understanding Derivatives
A derivative is a financial contract whose value depends on, or is “derived” from, the value of an underlying asset or benchmark. The main types of underlying assets include:
Equities (Stocks)
Commodities (Oil, Gold, Wheat, etc.)
Interest rates
Foreign currencies
Market indices (Nifty, S&P 500, etc.)
The most common types of derivatives are forwards, futures, options, and swaps. Each type serves a unique purpose in risk management.
2. The Concept of Hedging
Hedging is a strategy designed to protect against potential losses from adverse price movements. It is akin to purchasing insurance. Just as an individual buys health or car insurance to reduce exposure to personal financial loss, investors or companies use derivatives to insure against financial risks.
For example, a farmer expecting to harvest wheat in three months worries that wheat prices might drop. By entering a futures contract to sell wheat at a predetermined price, the farmer locks in the selling price today, thus hedging against future price declines. Similarly, an airline company worried about rising jet fuel prices might use derivatives to lock in current fuel costs.
3. Types of Derivatives Used for Hedging
3.1 Forwards
A forward contract is a customized agreement between two parties to buy or sell an asset at a specified future date for a price agreed upon today.
Example: A coffee exporter expects to sell 1,000 kilograms of coffee beans in six months. To protect against a potential fall in coffee prices, the exporter enters into a forward contract with a buyer to sell the coffee at ₹250 per kg in six months.
Hedging Impact: Regardless of future price fluctuations, the exporter knows exactly how much revenue will be received, eliminating uncertainty.
However, forwards carry a counterparty risk, as there is no centralized exchange to guarantee contract fulfillment.
3.2 Futures
Futures contracts are standardized versions of forward contracts, traded on regulated exchanges like the NSE or BSE in India. They obligate the buyer and seller to transact the underlying asset at a fixed price and date.
Example: A gold jewelry manufacturer expects to buy 10 kg of gold in two months. To hedge against potential price increases, the manufacturer buys gold futures today at ₹60,000 per 10 grams. If gold prices rise to ₹65,000, the manufacturer benefits because the futures contract offsets the increased cost.
Key Advantage: Futures contracts eliminate counterparty risk through exchange clearing houses, which act as intermediaries guaranteeing the trade.
3.3 Options
An option provides the right, but not the obligation, to buy or sell an asset at a predetermined price (called the strike price) before or at expiration.
Call Option: Gives the right to buy the underlying asset.
Put Option: Gives the right to sell the underlying asset.
Example (Put Option for Hedging):
A stock investor holding shares of Infosys worries that its price might fall. The investor buys a put option with a strike price of ₹1,500. If Infosys drops to ₹1,300, the investor can sell at ₹1,500, limiting losses.
Example (Call Option for Hedging):
An importer expecting to pay in U.S. dollars in three months can buy a call option on USD/INR. If the dollar strengthens, the importer exercises the option and locks in a favorable exchange rate.
Options are highly flexible tools and are widely used for both portfolio protection and speculative strategies.
3.4 Swaps
Swaps are contracts between two parties to exchange cash flows or other financial instruments. The most common forms are interest rate swaps and currency swaps.
Interest Rate Swap Example:
A company with a variable-rate loan fears rising interest rates. It enters an interest rate swap to convert its floating payments into fixed payments, thus stabilizing its interest expenses.
Currency Swap Example:
An Indian firm borrowing in U.S. dollars but earning revenue in rupees may enter into a currency swap with a U.S. firm that needs rupees, effectively exchanging currency obligations and reducing exchange rate exposure.
Swaps are primarily used by corporations and financial institutions to manage interest rate and currency risks.
4. How Derivatives Hedge Specific Types of Risk
4.1 Price Risk
Price risk refers to the uncertainty of future market prices for commodities, securities, or other assets.
Hedging with Futures: Farmers, manufacturers, and commodity traders lock in prices to protect against unfavorable movements.
Example: Oil producers sell crude oil futures to hedge against a potential decline in oil prices.
4.2 Currency Risk
Currency or foreign exchange risk arises when transactions or investments involve multiple currencies.
Hedging with Forwards or Options: Exporters and importers use currency forwards or options to fix exchange rates.
Example: An Indian IT firm expecting dollar revenue may hedge by selling USD-INR forwards to avoid losses from a depreciating dollar.
4.3 Interest Rate Risk
Interest rate fluctuations can impact loan costs, bond prices, and investment returns.
Hedging with Swaps or Futures: Companies convert floating-rate debt to fixed-rate using swaps or use interest rate futures to stabilize borrowing costs.
Example: A bank holding fixed-rate loans but funding them with variable-rate deposits can use an interest rate swap to balance its risk exposure.
4.4 Credit Risk
Credit derivatives, such as credit default swaps (CDS), hedge against the risk of borrower default.
Example: A bank holding corporate bonds buys a CDS to receive compensation if the issuer defaults, thus transferring credit risk to another party.
4.5 Portfolio Risk
Investors use index options and futures to hedge entire portfolios.
Example: A mutual fund anticipating short-term market volatility sells Nifty futures to protect its holdings from a potential downturn. When prices fall, profits from the futures offset losses in the portfolio.
5. Real-World Applications of Derivative Hedging
1. Corporate Sector
Airlines: Hedge against fuel price volatility using oil futures.
Exporters: Protect against foreign exchange fluctuations using currency forwards.
Manufacturers: Lock input costs with commodity futures to stabilize production costs.
2. Banking and Financial Institutions
Banks and mutual funds use derivatives to manage interest rate, credit, and market risks. Derivatives allow them to protect profit margins and maintain asset-liability stability.
3. Investors and Portfolio Managers
Investors use derivatives to hedge positions or reduce volatility. For instance, a fund manager may use put options on indices to safeguard portfolios during uncertain markets.
6. Advantages of Using Derivatives for Hedging
Risk Reduction:
Derivatives minimize exposure to adverse market movements, providing financial stability.
Cost Efficiency:
Derivative contracts often require less capital compared to holding physical assets.
Flexibility:
Options and swaps can be customized to specific risk needs, offering tailored protection.
Liquidity:
Major derivatives markets (like NSE, CME, or LME) offer high liquidity, making entry and exit easy.
Global Integration:
Derivatives enable international firms to manage risks across multiple markets and currencies seamlessly.
7. Risks and Challenges in Using Derivatives
While derivatives serve as powerful hedging instruments, they come with their own set of risks:
Leverage Risk:
Small price changes in the underlying asset can lead to large losses because derivatives often involve high leverage.
Counterparty Risk:
In over-the-counter (OTC) derivatives like forwards or swaps, one party may default on obligations.
Complexity:
Some derivatives are highly complex, requiring advanced understanding and monitoring. Misuse can lead to significant losses.
Speculative Misuse:
Although derivatives are designed for hedging, they can be used for speculation, amplifying market volatility.
Regulatory and Legal Risks:
Changes in regulations or lack of oversight may affect contract enforceability and transparency.
8. Case Studies of Derivative Hedging
1. Southwest Airlines (U.S.)
Southwest famously hedged against rising oil prices by using long-term crude oil futures. When oil prices surged in the 2000s, Southwest’s fuel costs remained low, giving it a major competitive edge.
2. Infosys Technologies (India)
Infosys, a major exporter of software services, uses currency derivatives to hedge against rupee appreciation. By locking in exchange rates, Infosys protects its dollar revenues from currency volatility.
3. Tata Steel
Tata Steel uses commodity derivatives to hedge against fluctuations in iron ore and coal prices, stabilizing input costs and ensuring consistent profitability.
9. The Indian Derivatives Market
India’s derivatives market has expanded rapidly since the early 2000s, driven by the National Stock Exchange (NSE) and the Bombay Stock Exchange (BSE).
The NSE introduced index futures in 2000, followed by index options and stock derivatives.
Commodity derivatives are traded through exchanges such as the Multi Commodity Exchange (MCX).
Currency and interest rate derivatives have enabled corporations and investors to hedge efficiently in a globally connected economy.
Regulatory oversight by SEBI ensures transparency, standardization, and risk management practices in derivative trading.
10. The Future of Derivative Hedging
The future of derivatives lies in technological innovation, blockchain-based smart contracts, and AI-driven risk management. With globalization, financial products are increasingly interconnected, and derivatives will continue to evolve as essential instruments for financial stability.
Emerging areas include:
Environmental Derivatives: For hedging carbon credits and climate risks.
Crypto Derivatives: Managing risks in digital asset markets.
AI-Enhanced Hedging Models: Predictive analytics improving hedge accuracy.
Conclusion
Derivatives are indispensable tools in modern finance for hedging and managing risks. They empower corporations, investors, and governments to stabilize cash flows, lock in prices, and protect portfolios from adverse market movements. Whether it’s a farmer securing crop prices, a multinational corporation mitigating currency fluctuations, or an investor guarding against market downturns, derivatives act as the financial world’s safety net.
However, their power must be wielded with caution. When used responsibly, derivatives strengthen financial resilience and promote global economic stability. When misused, they can amplify systemic risks, as seen during past financial crises.
In essence, derivatives are not inherently risky — it is how they are managed that determines their impact. When effectively structured and properly regulated, derivatives remain one of the most potent instruments for hedging risks and ensuring long-term financial security in an unpredictable world.

Technical Market Explode: Understanding Sudden Market Breakouts1. What Is a Technical Market Explosion?
A technical market explosion refers to a sharp, sudden, and high-volume move in an asset’s price that breaks through established technical levels such as resistance, support, or trendlines. It often happens when price consolidates for a long time and then breaks out, leading to a surge in volatility and directional momentum.
In simpler terms, the market “explodes” because:
Buyers or sellers rush in together after a key breakout.
Stop-losses and pending orders trigger en masse.
Volume multiplies, creating a snowball effect.
Momentum traders, algorithms, and institutions join the move.
These explosions can occur in either direction — bullish or bearish — but they share similar technical signatures.
2. The Psychology Behind Explosive Moves
Every explosive technical move is rooted in trader psychology. Markets are driven by human emotion — primarily fear and greed. When prices are trapped in a range, uncertainty dominates. But once a decisive move breaks that range, traders who were waiting on the sidelines jump in, while those on the wrong side rush to exit.
For example:
When a stock breaks above long-term resistance, greed fuels buying as traders fear missing out.
When it breaks below support, fear dominates as investors panic-sell to cut losses.
This feedback loop of emotion and momentum creates the conditions for an explosive market.
3. Technical Patterns That Lead to Explosions
There are several chart patterns and price structures that often precede a market explosion. Recognizing them early is key to anticipating the move.
A. Consolidation Breakout
When prices trade in a narrow range for weeks or months — forming a rectangle or sideways pattern — energy builds up. Once a breakout happens with volume, the stored pressure is released explosively.
B. Triangle Patterns
Symmetrical, ascending, or descending triangles represent contracting volatility. As the apex nears, traders prepare for a breakout. The tighter the triangle, the stronger the eventual explosion.
C. Cup and Handle
This bullish continuation pattern shows accumulation followed by a small pullback (handle). When price breaks the handle with volume, an explosive upward trend often begins.
D. Flag and Pennant
After a strong move, a flag or pennant forms as a short pause. The breakout from these continuation patterns triggers another sharp move — often matching the length of the prior trend.
E. Double Bottom / Top Breakouts
When prices fail to make new lows or highs twice and then reverse, the breakout past the neckline triggers a major directional explosion.
These patterns are visual representations of market tension. Once the tension releases, price often moves swiftly in the breakout direction.
4. Indicators Signaling an Impending Explosion
Technical traders use indicators to identify potential explosive setups before they happen. Some of the most reliable tools include:
A. Volume Expansion
Volume is the lifeblood of any breakout. A sudden spike in volume after a period of contraction signals that a big move is underway. Traders often look for volume confirmation — the move must be supported by higher-than-average trading activity.
B. Bollinger Bands Squeeze
When Bollinger Bands narrow, volatility is low. A breakout of the bands usually precedes an explosive move as volatility expands. This is one of the most accurate signals for volatility-based trading.
C. Moving Average Crossovers
A short-term moving average crossing above a longer one (like the 20-day above 50-day) often precedes an upside explosion. Conversely, a bearish crossover may signal a downside blast.
D. RSI Divergence
When price consolidates but RSI shows divergence, it can indicate hidden accumulation or distribution before a breakout.
E. MACD Histogram Expansion
A rising MACD histogram after a long flat period shows increasing momentum — a key precursor to a technical breakout.
F. Average True Range (ATR) Expansion
ATR measures volatility. A sudden increase in ATR suggests that the market is gearing up for larger price movements.
5. The Role of Volume and Liquidity
In any explosive move, volume and liquidity play crucial roles. When liquidity is thin, even modest orders can move prices significantly. Conversely, when a breakout happens with institutional-level volume, it confirms strong participation.
An explosive market generally shows:
High relative volume (2–3x the average daily volume)
Sharp price gaps
Low liquidity at key levels
Aggressive order book imbalances
For traders, watching volume-weighted average price (VWAP) can help confirm whether the breakout is genuine or merely a false spike.
6. Institutional and Algorithmic Triggers
Modern markets are heavily influenced by algorithms and institutional trading systems. These entities monitor technical levels across thousands of assets and execute large orders once certain thresholds are crossed.
When price breaks a critical resistance:
Algorithms trigger buy programs.
Stop orders from short-sellers are hit.
Momentum funds pile in.
The combined force creates an amplified price surge, making the market appear to “explode” in one direction. Similarly, when the market breaks down, sell programs trigger a cascading effect.
This is why explosive moves are often synchronized across sectors or even global markets — algorithms act simultaneously across correlated instruments.
7. Phases of a Technical Explosion
A technical market explosion generally unfolds in three phases:
Phase 1: Buildup (Compression)
Price trades within a narrow range.
Volatility contracts.
Volume dries up.
Traders get bored or uncertain.
This is the “quiet before the storm” stage.
Phase 2: Breakout (Ignition)
A sudden surge in volume breaks key levels.
Price moves decisively in one direction.
Stop-losses and pending orders trigger.
Momentum builds rapidly.
This is the explosion phase — the most profitable for short-term traders.
Phase 3: Continuation or Reversal (Aftershock)
The market either continues strongly (trend formation) or retraces due to profit-taking.
Technical traders watch for retests of the breakout zone.
New participants join if the trend sustains.
Understanding these phases helps traders enter during ignition and exit before exhaustion.
8. Real-World Examples of Explosive Technical Moves
A. Indian Stock Market Breakouts
Adani Enterprises (2020–2022): A long consolidation near ₹200–₹300 followed by a massive breakout, driven by volume and institutional inflow, resulted in a 10x explosion.
Reliance Industries (2020): The stock exploded after breaking out of a multi-year consolidation, aligning with heavy foreign investment and digital business announcements.
B. Global Examples
Bitcoin (2020): Broke the $12,000 resistance after months of tight range, leading to an explosive rally past $60,000.
NASDAQ 100 (2023): Tech-driven rally exploded after breaking a major downtrend line as AI adoption surged.
Each of these examples followed a technical setup, consolidation, breakout, and momentum phase, confirming that explosions are technically driven rather than random.
9. How to Trade an Explosive Market
A. Identify the Setup Early
Look for signs of volatility compression — narrow Bollinger Bands, flat ATR, and tight price ranges. These are your early alerts.
B. Confirm With Volume and Price
Never enter on a weak breakout. Ensure that the breakout is supported by above-average volume and a strong close beyond resistance/support.
C. Use Multi-Timeframe Analysis
A breakout on the daily chart confirmed by a weekly trendline often leads to a more sustainable explosion. Multi-timeframe alignment reduces false signals.
D. Manage Risk Aggressively
Explosive markets are volatile. Use:
Tight stop-losses below key breakout zones.
Trailing stops to lock in profits.
Partial profit-taking during strong moves.
E. Watch for Retests
Often, after an explosion, the price pulls back to test the breakout zone. This retest offers a safer entry with reduced risk.
F. Don’t Chase Late Moves
Once the explosion has run too far, risk-reward deteriorates. It’s better to wait for the next consolidation.
10. Risks and False Breakouts
Not every breakout turns into an explosion. False breakouts — when price briefly breaks out and then reverses — can trap traders. These occur due to:
Lack of follow-through volume.
Market maker manipulation.
News-based volatility spikes.
To avoid false moves:
Confirm volume and closing price beyond breakout levels.
Wait for candle confirmation (at least one strong close above/below level).
Avoid trading during uncertain macroeconomic announcements.
11. The Role of News and Fundamentals
While “technical explosion” is largely chart-driven, fundamentals often align with technicals to strengthen the move. For instance:
Positive earnings or government policy can ignite a technical breakout.
Geopolitical shocks or rate hikes can trigger bearish explosions.
Thus, the best explosive trades occur when technical structure and fundamentals converge.
12. Long-Term Implications
Explosive market moves often mark the beginning of new trends or reversal of old ones. For example:
A breakout from multi-year resistance can signal a new bull cycle.
A breakdown below long-term support can mark the onset of a bear market.
These explosions can redefine sector leadership, influence macroeconomic flows, and create multi-year opportunities for investors.
13. Key Takeaways
A technical market explosion is a powerful breakout driven by volume, momentum, and emotion.
It originates from compression, followed by ignition, and often leads to trend formation.
Recognizing patterns, volume confirmation, and volatility contraction helps traders anticipate the move.
Risk management and discipline are critical — not every explosion sustains.
Combining technical signals with market context ensures the best results.
Conclusion
A technical market explosion is one of the most thrilling and profitable phenomena in trading. It represents the moment when chart patterns, trader sentiment, and institutional forces converge to drive massive price movement. While such explosions can yield extraordinary returns, they also demand discipline, preparation, and technical mastery. By studying historical breakouts, monitoring volatility compression, and aligning with momentum, traders can anticipate and participate in these market surges with confidence. In essence, the ability to identify and trade a technical market explosion transforms a trader from a follower of price to a predictor of power — turning volatility into opportunity.
Sector Rotation Strategies in IndiaIntroduction
In the dynamic landscape of financial markets, investors constantly seek methods to outperform benchmarks and manage risks effectively. One such approach is sector rotation—a strategy that capitalizes on the natural ebb and flow of different sectors within the economy. In the Indian context, where cyclical and structural shifts frequently influence market behavior, sector rotation strategies have gained immense significance. By identifying which sectors are poised for growth and reallocating capital accordingly, investors can ride the momentum of economic cycles and maximize returns.
Sector rotation strategies are not new, but their relevance in India has grown in recent years due to rapid economic transformation, evolving government policies, and increased participation by institutional and retail investors. Understanding how to implement this strategy effectively can help both short-term traders and long-term investors optimize their portfolios.
What Is Sector Rotation?
Sector rotation refers to the practice of shifting investments from one industry sector to another based on the anticipated performance of sectors during different phases of the economic or market cycle. The core belief behind this strategy is that different sectors perform better at different times depending on economic conditions, interest rates, inflation, and government policy.
For example:
During an economic expansion, sectors like banking, infrastructure, capital goods, and consumer discretionary often outperform.
In a slowdown or recession, defensive sectors such as healthcare, FMCG (fast-moving consumer goods), and utilities tend to provide stability.
The idea is to rotate capital ahead of market trends—buying into sectors expected to outperform and exiting those likely to lag.
Economic Cycle and Sector Performance
To apply sector rotation effectively, one must understand the economic cycle, which typically consists of four stages:
Early Recovery / Expansion Phase:
The economy emerges from a slowdown.
Interest rates are low, liquidity is abundant, and corporate earnings begin to recover.
Sectors that tend to perform well: Banking, Auto, Infrastructure, Capital Goods, Metals.
Mid-Cycle (Growth Phase):
Economic activity strengthens, credit growth improves, and employment rises.
Consumer demand is high, and profits grow across industries.
Leading sectors: Technology, Consumer Discretionary, Financials.
Late-Cycle (Peak Phase):
Inflationary pressures increase, central banks may hike interest rates.
Input costs rise, margins narrow, and economic growth plateaus.
Beneficiaries: Energy, Commodities, Real Estate (short-term), while defensive sectors start gaining interest.
Recession / Slowdown Phase:
Demand slows down, earnings decline, and risk appetite decreases.
Safe-haven sectors outperform: FMCG, Healthcare, Utilities, Telecom.
Understanding these cycles and aligning sector exposure accordingly can significantly enhance portfolio returns.
Sector Rotation in the Indian Context
India’s economy is highly diverse and cyclical, influenced by factors such as monsoons, global demand, fiscal policy, and political stability. This makes it fertile ground for sector rotation strategies.
Over the past decade, India’s markets have demonstrated how different sectors come into prominence at different times:
2014–2017: A strong bull run in banking, infrastructure, and auto sectors, driven by reforms and policy push.
2018–2019: IT and FMCG sectors led due to global uncertainty and domestic consumption stability.
2020 (Pandemic): Pharmaceuticals and IT outperformed amid lockdowns.
2021–2023: A rebound in capital goods, energy, and PSU stocks, aligned with the government’s infrastructure focus.
2024–2025: Defence, renewable energy, and railways emerged as key performers.
Such patterns reflect how rotating between sectors based on macro trends can capture performance waves across cycles.
Key Drivers of Sector Rotation in India
Macroeconomic Indicators:
GDP growth, inflation, interest rates, and fiscal policies shape sector outlooks.
Example: Falling interest rates typically favor banks and real estate, while rising inflation benefits commodities and energy.
Government Policies and Budget Allocations:
The Union Budget can drastically shift sectoral fortunes.
For example, higher capital expenditure boosts infrastructure and cement, while healthcare allocations support pharma stocks.
Global Trends and Commodity Prices:
India’s dependence on global trade means commodity cycles affect sectors like metals, oil & gas, and IT (via currency movements).
Corporate Earnings Cycles:
Investors rotate toward sectors with improving earnings momentum.
Quarterly earnings season often triggers sectoral moves in Indian markets.
Technological Disruption and Innovation:
Rapid digital adoption has pushed investors toward IT, fintech, and e-commerce sectors, reflecting a long-term structural shift.
Approaches to Implement Sector Rotation
There are several ways investors can execute sector rotation strategies in India, depending on their investment horizon, risk appetite, and analytical tools.
1. Top-Down Approach
This involves analyzing the macroeconomic environment first, identifying the economic phase, and then selecting sectors likely to perform well.
Example: If the Reserve Bank of India (RBI) cuts interest rates, sectors like housing finance, auto, and banks are likely to benefit.
Tools: GDP data, inflation reports, RBI monetary policy statements.
2. Quantitative Models
Some investors use quantitative indicators such as:
Relative Strength Index (RSI) to gauge sector momentum.
Moving Averages (MA) for sector trend identification.
Sector Rotation Index (SRI) or ratio charts comparing sector indices (e.g., NIFTY IT vs. NIFTY Bank).
These methods help traders identify which sectors are gaining strength relative to the broader market.
3. Earnings Momentum and Valuation Shifts
Investors track sectors showing strong earnings upgrades and favorable valuation multiples.
For instance, analysts might rotate from overvalued IT stocks to undervalued manufacturing or PSU companies showing improving profits.
4. ETF and Mutual Fund Rotation
Investors can also rotate exposure via sectoral ETFs or mutual funds, such as:
Nippon India Pharma Fund
ICICI Prudential Infrastructure Fund
UTI Transportation and Logistics Fund
These allow diversified exposure within a targeted sector without picking individual stocks.
Practical Example of Sector Rotation in India
Let’s consider a simplified rotation from 2020 to 2025:
2020 (Pandemic Phase):
Pharma, IT, and FMCG surged due to health concerns and work-from-home trends.
2021–2022 (Recovery Phase):
Infrastructure, auto, and banking gained momentum as the economy reopened and credit demand rose.
2023 (Rising Capex and Defence Spending):
Sectors like capital goods, defence, and PSU stocks led the rally.
2024–2025 (Green Transition and Energy Shift):
Renewable energy, EVs, and power sector stocks dominated as the government pushed for sustainability and net-zero goals.
An investor following this sequence could have achieved strong portfolio performance by rotating across these themes.
Advantages of Sector Rotation
Enhanced Returns:
Capturing sectoral upswings often results in outperformance compared to passive investing.
Diversification with Focus:
While rotating sectors, investors maintain diversification but concentrate capital on high-probability opportunities.
Risk Management:
Moving away from underperforming sectors helps mitigate downside risk.
Tactical Flexibility:
Allows investors to adapt quickly to changing economic conditions or policy changes.
Alignment with Economic Reality:
This strategy mirrors real economic developments, making investment decisions more grounded in fundamentals.
Risks and Challenges
Despite its benefits, sector rotation comes with certain risks:
Timing Risk:
Identifying the correct phase of the economic cycle is challenging, and mistimed rotations can lead to underperformance.
Overtrading:
Frequent switching can increase transaction costs and reduce net returns.
False Signals:
Short-term market noise or speculative rallies may mislead investors.
Policy Uncertainty:
Sudden regulatory changes or geopolitical shocks can reverse sector trends.
Limited Data for Emerging Sectors:
Newer industries like electric vehicles or renewable energy may lack long-term performance history, complicating analysis.
Tools and Indicators for Sector Rotation
To successfully apply this strategy in Indian markets, investors often rely on:
NSE Sectoral Indices: (e.g., NIFTY Bank, NIFTY IT, NIFTY FMCG, NIFTY Infra).
Sectoral Ratio Charts: Comparing each sector index against the NIFTY 50 to spot outperformers.
Economic Indicators: RBI policy updates, inflation data, IIP (Index of Industrial Production), and fiscal budgets.
Technical Indicators: MACD crossovers, relative momentum charts, and sector breadth analysis.
Advanced investors may also use AI-based predictive models or factor-based analytics to anticipate rotation opportunities.
Sector Rotation and Institutional Activity
In India, foreign institutional investors (FIIs) and domestic institutional investors (DIIs) play a crucial role in sector rotation. Their capital inflows often dictate sectoral leadership:
When FIIs buy heavily into India, sectors like banks and IT usually lead due to global exposure.
During risk aversion phases, FIIs move to defensives like FMCG and healthcare.
Tracking institutional flow data (available on NSE or AMFI) provides valuable clues for rotation strategies.
Long-Term Structural Rotations in India
Beyond cyclical rotations, India is also witnessing structural sector shifts:
Digital Transformation: Boosting IT services, fintech, and digital platforms.
Manufacturing and Defence: Driven by “Make in India” and self-reliance initiatives.
Renewable Energy & EVs: Supported by green transition policies.
Consumer Upgradation: Growing middle-class demand benefiting retail, luxury goods, and financial services.
Investors combining cyclical and structural perspectives can enjoy both short-term alpha and long-term wealth creation.
Conclusion
Sector rotation strategies in India represent a powerful yet disciplined approach to navigating the complexities of the stock market. By understanding economic cycles, policy dynamics, and sectoral interrelationships, investors can tactically position themselves in outperforming industries while minimizing exposure to laggards.
While this approach demands active monitoring, analytical rigor, and timing precision, it offers immense potential in a fast-evolving economy like India’s. Whether through direct stock selection or via sectoral funds and ETFs, a well-executed sector rotation strategy can enhance portfolio performance, protect capital in downturns, and align investments with the pulse of India’s economic transformation.

Essential Infrastructure Investment The Foundation of Sustainable Growth
Infrastructure is the backbone of any modern economy. It encompasses the fundamental systems and facilities that support a nation's economic and social well-being, such as transportation networks, energy grids, communication systems, water supply, and social amenities like healthcare and education. Investment in essential infrastructure is not merely a financial commitment; it is an investment in the future prosperity, resilience, and inclusivity of a society. In the 21st century, as global economies face the challenges of urbanization, climate change, technological transformation, and population growth, infrastructure investment has become more crucial than ever.
1. Understanding Essential Infrastructure Investment
Essential infrastructure investment refers to the allocation of capital and resources toward the development, maintenance, and modernization of basic systems that ensure the smooth functioning of an economy. These investments can be made by governments, private entities, or through public-private partnerships (PPPs). The goal is to provide long-term value by improving efficiency, connectivity, productivity, and quality of life.
Infrastructure investment can be divided into several categories:
Economic Infrastructure – Transport (roads, railways, ports, airports), energy (power plants, transmission grids), telecommunications, and water management.
Social Infrastructure – Education facilities, healthcare systems, housing, and public safety institutions.
Digital Infrastructure – Internet connectivity, data centers, cybersecurity systems, and smart city frameworks.
Green Infrastructure – Renewable energy installations, sustainable waste management, and climate-resilient urban planning.
Each category plays a vital role in creating a foundation upon which economies can grow and societies can thrive.
2. The Importance of Infrastructure Investment
The significance of investing in infrastructure can be seen from multiple dimensions — economic, social, and environmental.
a. Economic Growth and Productivity
Infrastructure fuels economic expansion by facilitating trade, mobility, and industrial development. Efficient transportation systems reduce logistics costs and time, while reliable energy supply enhances industrial output. The World Bank estimates that every 1% increase in infrastructure spending can increase GDP growth by up to 2%. Moreover, infrastructure investments generate employment opportunities during both construction and operational phases, creating a multiplier effect across various sectors.
b. Enhancing Competitiveness
Nations with advanced infrastructure attract more domestic and foreign investments. Investors are drawn to regions with reliable electricity, transport connectivity, and digital systems. For instance, well-developed logistics networks lower production costs, improving global competitiveness. This is why emerging economies like India, Indonesia, and Vietnam have prioritized infrastructure modernization to attract manufacturing and service industries.
c. Reducing Regional Inequality
Infrastructure investments can bridge regional development gaps. By improving access to transportation, communication, and education, remote areas can become economically viable. This inclusivity promotes social stability and reduces urban overcrowding. For example, rural electrification projects in Africa and Asia have dramatically improved agricultural productivity and small business growth.
d. Promoting Environmental Sustainability
Green infrastructure investments in renewable energy, waste management, and sustainable transport reduce carbon emissions and combat climate change. Building climate-resilient infrastructure — such as flood-resistant roads or water recycling systems — ensures long-term sustainability. The global push for “net-zero” emissions has made green infrastructure an essential pillar of modern economic strategy.
e. Enhancing Quality of Life
Reliable infrastructure ensures access to clean water, healthcare, and education — fundamental human rights that underpin a decent standard of living. Smart city initiatives and digital infrastructure enhance safety, convenience, and access to public services, improving the overall quality of life.
3. Key Sectors of Essential Infrastructure Investment
a. Transportation Infrastructure
Transportation is the lifeblood of commerce. Roads, highways, ports, airports, and railways connect producers to markets and people to opportunities. Countries that invest in integrated transport systems experience enhanced trade efficiency and reduced costs. For instance, China’s Belt and Road Initiative (BRI) demonstrates how massive transport infrastructure investments can foster international connectivity and trade growth.
b. Energy Infrastructure
Energy is critical for industrial development, urbanization, and modern living. Investment in power generation, transmission, and distribution systems ensures reliable access to electricity. With the shift toward renewable energy sources like solar, wind, and hydroelectric power, the energy sector has become a hotspot for sustainable infrastructure investment. Smart grids and battery storage technologies are transforming how energy is produced, stored, and consumed.
c. Water and Sanitation Systems
Water infrastructure ensures the availability and quality of water for consumption, agriculture, and industry. Investments in desalination plants, irrigation networks, and wastewater treatment facilities improve public health and agricultural productivity. Poor water infrastructure, conversely, can lead to water scarcity, disease outbreaks, and economic inefficiencies.
d. Digital Infrastructure
In the digital era, connectivity is as crucial as physical roads and bridges. High-speed internet, 5G networks, data centers, and cybersecurity systems form the backbone of digital economies. Nations investing in digital infrastructure experience exponential growth in e-commerce, fintech, and information technology sectors. For example, the expansion of broadband networks in India has empowered millions of small businesses and enabled remote education and telemedicine services.
e. Social Infrastructure
Education and healthcare facilities form the foundation of human capital development. Investments in schools, universities, and hospitals ensure a healthy, skilled workforce capable of sustaining long-term economic growth. Modern social infrastructure integrates technology — such as telehealth and online learning platforms — to increase access and efficiency.
4. Funding Models for Infrastructure Investment
Infrastructure projects require massive capital outlays, often running into billions of dollars. Several funding models exist to mobilize these resources:
Public Financing: Governments allocate budgetary resources or issue bonds to finance infrastructure projects. This model ensures public ownership but can strain fiscal budgets.
Public-Private Partnerships (PPPs): A collaborative model where private investors finance, build, and operate infrastructure projects while sharing risks and returns with the government. PPPs have been widely successful in transport and energy projects worldwide.
Private Financing: Large institutional investors, such as pension funds and sovereign wealth funds, often invest in infrastructure for long-term stable returns.
Multilateral and Development Banks: Institutions like the World Bank, Asian Infrastructure Investment Bank (AIIB), and IMF provide financing, guarantees, and technical assistance for infrastructure development in emerging economies.
5. Challenges in Infrastructure Investment
Despite its importance, infrastructure investment faces several challenges:
a. Financing Gaps
The global infrastructure financing gap is estimated at over $15 trillion by 2040. Many developing nations struggle to attract sufficient capital due to fiscal constraints, political instability, or lack of investor confidence.
b. Regulatory and Bureaucratic Hurdles
Complex approval processes, land acquisition disputes, and corruption can delay projects and escalate costs. Transparent governance and streamlined regulatory frameworks are essential for project success.
c. Technological Obsolescence
With rapid technological advancement, infrastructure systems can quickly become outdated. Therefore, investments must incorporate flexibility and scalability to adapt to new technologies.
d. Environmental and Social Concerns
Large infrastructure projects can have negative environmental and social impacts, such as displacement, deforestation, or pollution. Sustainable and inclusive planning is necessary to minimize such effects.
e. Maintenance and Lifecycle Costs
Many countries focus on building new infrastructure but neglect maintenance, leading to deterioration and inefficiency. Regular upkeep and modernization are vital to maximize the lifespan of assets.
6. Emerging Trends in Infrastructure Investment
a. Green and Sustainable Infrastructure
Governments and investors are increasingly prioritizing projects that align with environmental, social, and governance (ESG) principles. Renewable energy, electric vehicle infrastructure, and sustainable housing are at the forefront of this shift.
b. Smart Infrastructure
Integration of technology such as AI, IoT, and big data enables “smart” infrastructure — intelligent systems that monitor, manage, and optimize resources in real time. Smart grids, smart transportation systems, and smart cities represent the future of infrastructure investment.
c. Resilient Infrastructure
With climate risks on the rise, resilience has become a key investment criterion. Infrastructure must withstand extreme weather events, earthquakes, and other disruptions to ensure continuity of essential services.
d. Inclusive and Equitable Infrastructure
There is growing recognition of the need for infrastructure that benefits all citizens, including marginalized and rural populations. Inclusive planning ensures equal access and opportunity, supporting social cohesion.
e. Digital Transformation
Digitalization is redefining infrastructure priorities. Governments are investing in 5G, cloud computing, and cybersecurity to build the foundation for data-driven economies.
7. Case Studies: Successful Infrastructure Investments
a. Singapore
Singapore’s meticulous planning and heavy investment in infrastructure have made it one of the most efficient and competitive economies in the world. Its integrated transport systems, advanced digital infrastructure, and world-class port facilities are models for global best practices.
b. India’s Infrastructure Push
India’s National Infrastructure Pipeline (NIP) and initiatives like Gati Shakti aim to modernize transportation, logistics, and energy networks. The focus on renewable energy, highways, and digital connectivity has significantly improved economic efficiency.
c. Europe’s Green Deal
The European Union’s Green Deal allocates billions toward clean energy, sustainable transport, and digital transformation. This initiative exemplifies how infrastructure investment can drive both economic growth and environmental protection.
8. The Future of Infrastructure Investment
The future of infrastructure investment lies in integration, innovation, and inclusivity. As the world becomes more interconnected, the boundaries between physical and digital infrastructure are blurring. Future investments will emphasize:
Carbon-neutral projects and green financing,
AI-driven urban management systems,
Sustainable public transport and energy systems,
Cross-border infrastructure cooperation.
Governments, investors, and international institutions must collaborate to close the global infrastructure gap while ensuring social and environmental responsibility.
9. Conclusion
Essential infrastructure investment is more than building roads, bridges, or power plants — it is about constructing the framework for human progress. It fosters economic growth, reduces inequality, enhances resilience, and improves quality of life. As the world faces mounting challenges from climate change, digital disruption, and population pressures, strategic and sustainable infrastructure investment will determine which nations thrive in the decades ahead.
In essence, investing in infrastructure is investing in the foundation of civilization itself — ensuring that societies remain connected, productive, and prepared for the future.

[XAUUSD] New Week Scenario: Accumulation Awaiting Drop New Week Scenario: Accumulation Awaiting Drop - Watch for Selling at Liquidity Zone $4195
Hello traders community,
The new week begins with XAUUSD (Gold) being "restrained" in a sideways structure. However, don't let this calm deceive you. Technically, this is an accumulation pattern with a clear bearish bias.
The market is in "wait" mode, and patience will be the key to catching the next big wave.
📰 MACRO ANALYSIS: TUG OF WAR AHEAD OF FOMC
The market is caught between two opposing streams of information:
Bearish Pressure: Positive signs of a US-China trade deal are reducing the demand for safe-haven assets, putting pressure on Gold prices.
Bullish Support: The weakening USD due to expectations that the Fed will continue to cut interest rates, inadvertently provides some short-term support for the precious metal.
Decisive Factor: Traders are "lying low" waiting for this week's two-day monetary policy meeting (FOMC). This will be the main event, determining the medium-term trend of USD and Gold.
📊 TECHNICAL ANALYSIS: CONTINUATION OF BEARISH STRUCTURE
The H1 chart shows a very clear "Sell" scenario:
Price Structure: After a strong drop from the peak, the price is moving sideways in an accumulation pattern of a bearish pennant. This is a continuation structure, indicating that the Sellers are "resting" before pushing the price further down.
Ideal Sell Zone: The $4195 zone is an extremely strong resistance confluence, marked as "Liquidity strong" on the chart.
This is the 0.5 Fibonacci level, the "golden" retracement point of the entire previous decline.
This is the old support zone now turned into new resistance.
Optimal Scenario: We will wait for the price to pull back to test the $4195 liquidity zone. This is an opportunity for Sellers to enter the market with low risk and high profit potential.
🎯 TRADING PLAN (SELL SETUP)
Absolute priority is to Watch for Selling (Sell) in line with the main trend.
ENTRY (Sell): $4195
STOP LOSS: $4205
TAKE PROFIT: TP1: $4168-TP2: $4145-TP3: $4122-TP4: $4102
SUMMARY
In the context of the market awaiting FOMC news, Gold is likely to make a final "pullback" to the $4195 zone before continuing its downtrend. Be patient and wait for signals at this ideal sell zone.
Wishing traders a successful and disciplined new trading week!

IRB trendline breakout on support level1. trendline breakout on support level
2. Inverse head and shoulder pattern on support level
3. good for swing upside movement

PNBHOUSING 4 Hour Time Frame PNB Housing Finance Ltd is trading at ₹907.30, reflecting a 2.68% increase from the previous close.
📊 Key Support and Resistance Levels
Support Levels: ₹885.15 (recent low), ₹826.72 (Super Trend level).
Resistance Levels: ₹912.15 (recent high), ₹1,141.90 (52-week high).
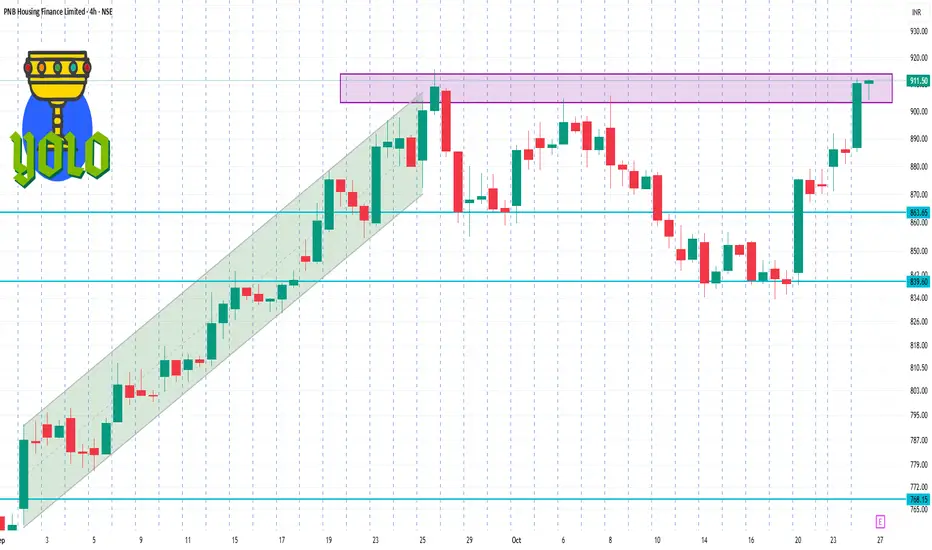
KPITTECH 1 Hour Time Frame 📈 Current Price Overview
Latest Price: ₹1,178.70
Day’s Range: ₹1,161.00 – ₹1,180.40
50-Day Moving Average (DMA): ₹1,206.21
200-Day Moving Average (DMA): Data not specified
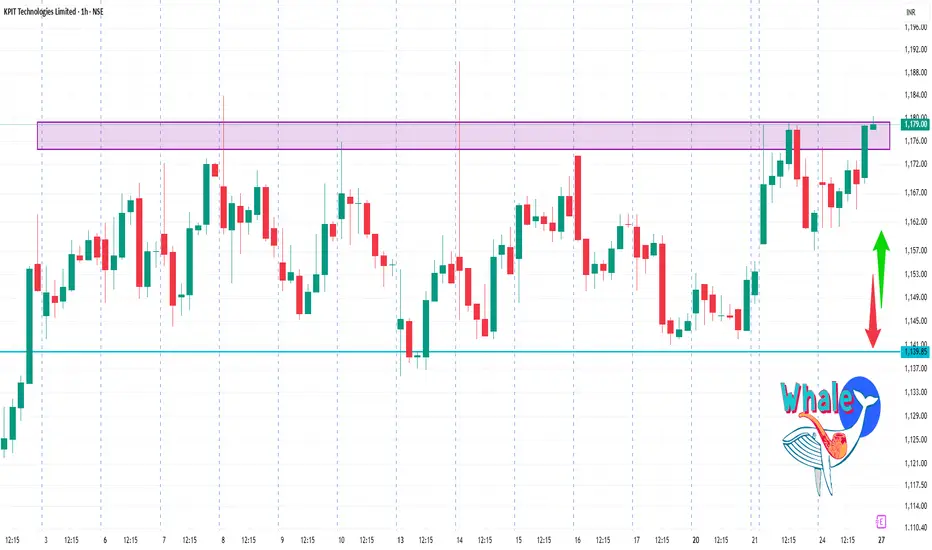
PREMIERENE 1 Week Time Frame Key Weekly Metrics:
Opening Price (Oct 20): ₹1,052.00
Closing Price (Oct 24): ₹1,070.70
Weekly High: ₹1,080.70
Weekly Low: ₹1,003.70
Average Price: ₹1,036.22

POCL 1 Week Time Frame🔍 Technical Highlights
52-Week Range: ₹490.00 – ₹1,507.05
Current Price: ₹1,372.90
Beta: -0.68, indicating lower volatility compared to the market
Relative Strength Index (RSI): 59.08, suggesting the stock is neither overbought nor oversold
50-Day Moving Average: ₹1,222.79
200-Day Moving Average: ₹886.54
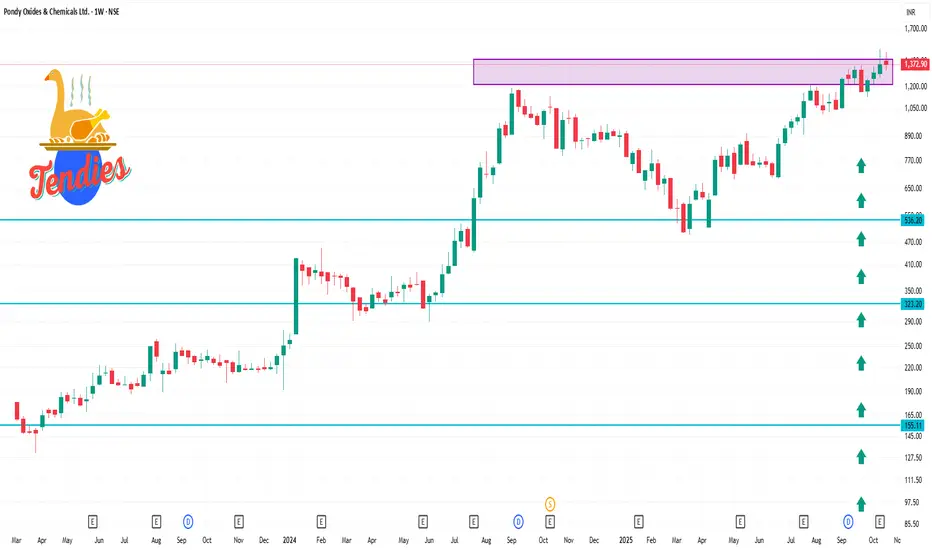
PUNJABCHEM 1 Month Time Frame 📈 1-Month Price Range (September 24 – October 24, 2025)
High: ₹1,407.50 on October 17
Low: ₹1,320.30 on October 14
Closing on October 24: ₹1,378.70
📊 Summary
Over the past month, PUNJABCHEM has experienced a decline, trading within a range of ₹1,320.30 to ₹1,407.50. Technical indicators suggest a bearish trend, with the stock trading below key moving averages and a negative MACD. However, the low RSI indicates potential for a rebound if buying interest returns.