Divrgence Secrets The Indian Options Market
In India, NSE (National Stock Exchange) is the major platform for options trading.
Most trading occurs in index options like NIFTY and BANKNIFTY, and in stock options of large companies.
Options are settled in cash, and expiry usually happens weekly (for indices) and monthly (for stocks).
Trend Line Break

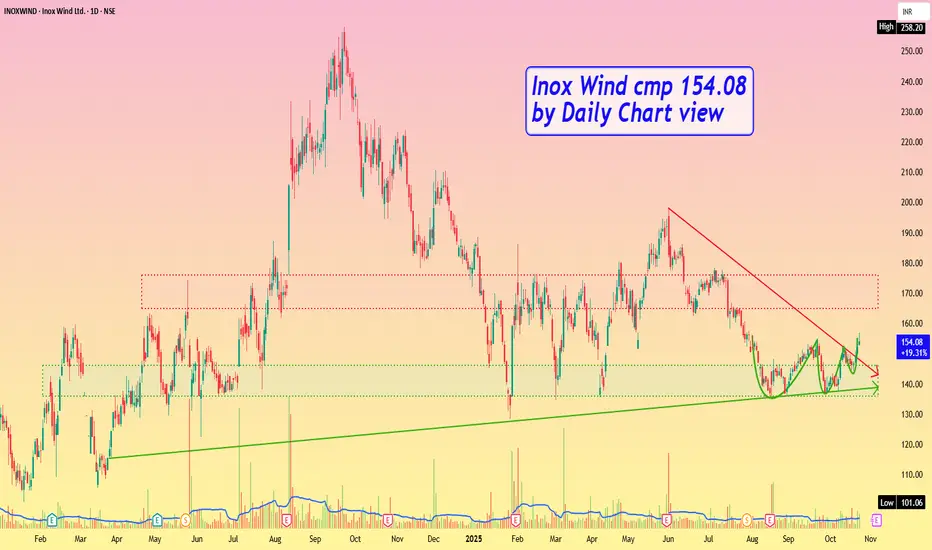
Inox Wind cmp 154.08 by Daily Chart viewInox Wind cmp 154.08 by Daily Chart view
- Support Zone 136 to 146 Price Band
- Resistance Zone 165 to 176 Price Band
- Volumes in good sync with avg traded quantity
- Falling Resistance Trendline Breakout seems sustained
- VCP pattern seems in making process by technical chart setup
PCR Trading StrategiesWhy Traders Use Options
Options are used for several strategic purposes:
Hedging: Protecting existing positions from price fluctuations.
Speculation: Earning profits from expected price movements with limited capital.
Income Generation: Selling options to collect premiums regularly.
Leverage: Controlling large positions with smaller amounts of money.

Part 2 Intraday TradingTypes of Options
There are two main types of options:
a. Call Option
A Call Option gives the holder the right to buy an asset at a specific price within a set time.
Traders buy call options when they expect the price of the asset to rise.
Example:
If a stock is trading at ₹100 and you buy a call option with a strike price of ₹110, you will profit if the stock rises above ₹110 before expiry.
b. Put Option
A Put Option gives the holder the right to sell an asset at a specific price within a set time.
Traders buy put options when they expect the price of the asset to fall.
Example:
If the stock is at ₹100 and you buy a put option with a strike price of ₹90, you will profit if the stock price falls below ₹90 before expiry.

Part 1 Intraday TradingKey Terms in Option Trading
To understand option trading well, you must know these important terms:
Strike Price: The fixed price at which the underlying asset can be bought or sold.
Premium: The price paid to purchase an option.
Expiry Date: The date when the option contract ends.
In the Money (ITM): When exercising the option is profitable.
Out of the Money (OTM): When exercising the option is not profitable.
At the Money (ATM): When the asset’s price is equal to the strike price.

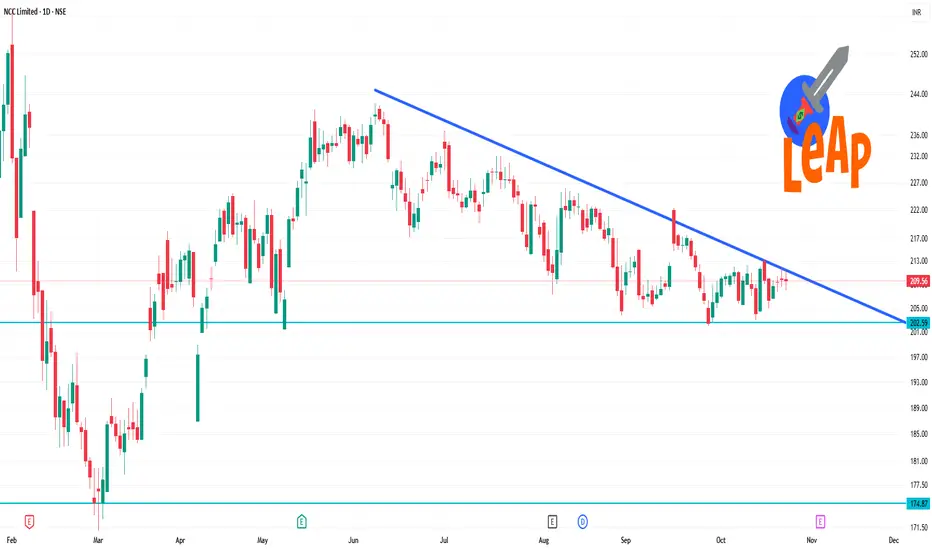
NCC 1 Day Time Frame ✅ Key data & current state
The stock is trading around ~₹ 206-₹ 209 as quoted recently.
On the daily chart:
14-day RSI is ~54 (neutral zone) according to one source.
Moving averages: 5-day MA ~208.19, 50-day ~208.28 (both slightly above current price) → bullish sign short term.
200-day MA ~209.77 is slightly above current price, meaning price is just below a longer-term average.
Technical indicators show mixed signals: some “buy” signals from moving averages, but overall “neutral” from aggregate indicators.
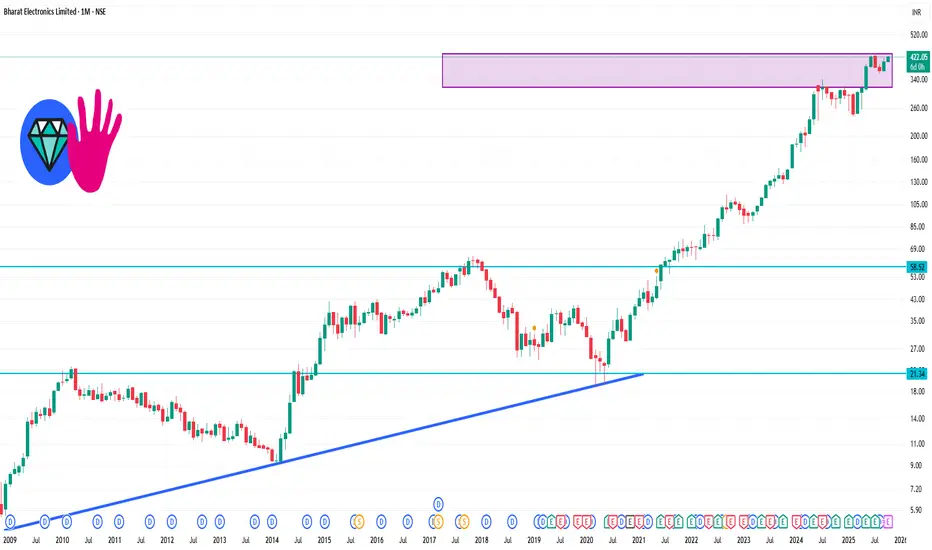
BEL 1 Month Time Frame 📊 Current data
As of 24 Oct 2025: BEL is trading around ₹422.05 as per the 24 Oct 2025 close.
Key valuation metrics: P/E ~ 56×, P/B ~ 15×.
52-week range: Low ~ ₹240.25, High ~ ₹436.00.
Company is debt‐free.
⏳ One‐Month performance
Over the past month, the share price has gained approximately +6.73%.
Historical daily data from ~ 25 Sept to 24 Oct: price ranged from ~ ₹392.45 to ~ ₹423.70.
NSE 1 Month Time Frame 🔍 Key levels (1-month horizon)
Support zone: ~ ₹136-₹140 – Price is above ~₹136.99 support according to one chart.
Resistance zone: ~ ₹150-₹155 – Resistance around ~₹152.43 from same chart.
Current trading band: With price ~₹146, the stock is roughly mid-band between support and resistance.

Sensex 1 Day Time frame The current value is around ₹84,211.88, down about -344.52 points (-0.41%) for the day.
The intraday range was roughly ₹83,957.15 (low) to ₹84,707.44 (high).
Over the past 24 hours the swing has been relatively modest (-0.07% according to one source).

PRIMESECU 1 Day Time Frame 📊 Intraday Support & Resistance Levels
Based on recent technical analysis, here are the key intraday levels for PRIMESECU:
Resistance Levels:
R1: ₹288.02
R2: ₹295.63
R3: ₹301.37
Support Levels:
S1: ₹278.85
S2: ₹286.32
These levels are derived from pivot points and recent price action, providing a framework for potential entry and exit points during intraday trading.

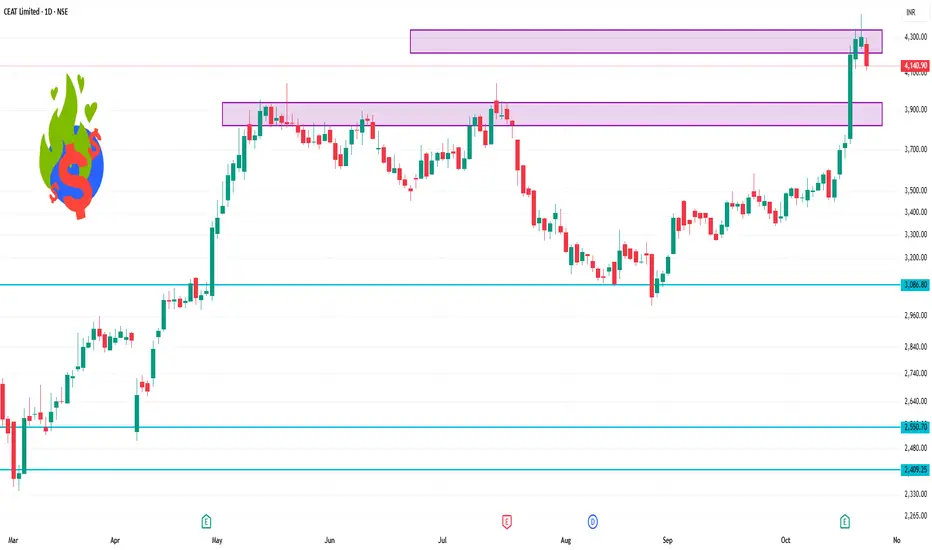
CEATLTD 1 Day Time Frame 📊 Key Intraday Levels
Opening Price: ₹4,262.50
Closing Price: ₹4,140.90
Day’s Range: ₹4,111.70 – ₹4,299.00
VWAP (Volume-Weighted Average Price): ₹4,218.63
Upper Circuit Limit: ₹5,163.20
Lower Circuit Limit: ₹3,442.20
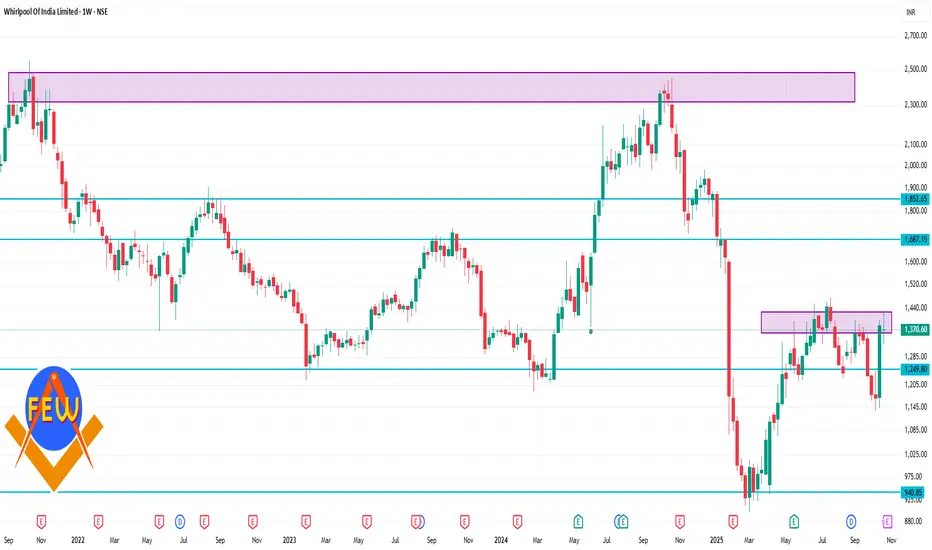
WHIRLPOOL 1 Week Time frame Weekly Performance:
Current Price: ₹1,370.60
Weekly Change: +9.49%
Technical Indicators:
1-Week Trend: Bullish
1-Month Trend: Bearish
Relative Strength Index (RSI): 55.25 (Neutral)
Moving Averages: The stock is above its 50-day and 200-day moving averages, indicating a bullish outlook.
Support and Resistance Levels:
Support: ₹1,269.45
Resistance Targets: ₹1,738.45, ₹1,888.40, ₹2,246.90, ₹2,435.95
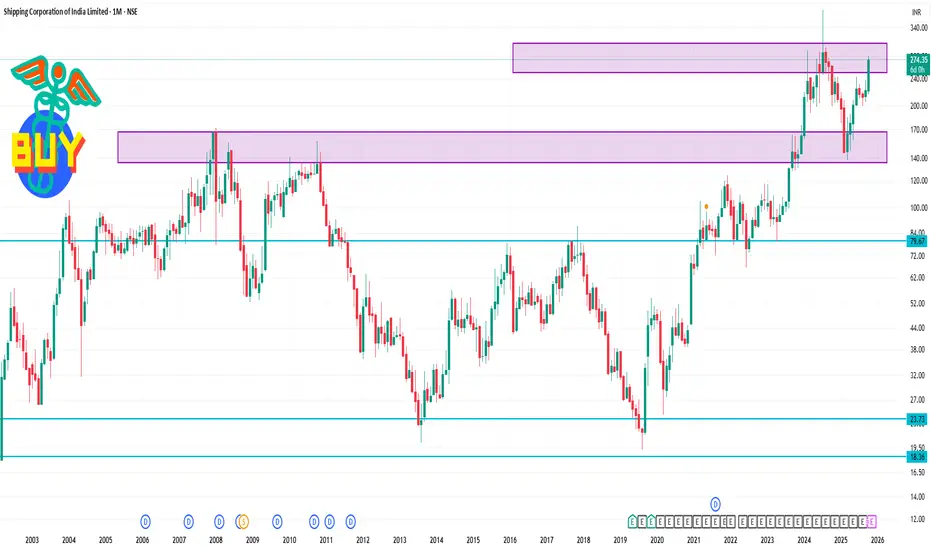
SCI 1 Month Time Frame Opening Price (Sep 25, 2025): ₹233.64
Closing Price (Oct 24, 2025): ₹274.34
Price Change: +₹40.70 (+17.4%)
Highest Price: ₹280.50 (Oct 24, 2025)
Lowest Price: ₹216.40 (Oct 8, 2025)
Average Price: ₹229.59
Volume: Approximately 66.86 million shares on Oct 24, 2025
Part 11 Trading Master ClassRisks in Option Trading
While options offer opportunities, they also carry risks:
Time Decay: The value of options reduces as expiry approaches.
Complexity: Requires good understanding and experience.
Unlimited Loss Potential (for Sellers): Option writers can face huge losses if the market moves against them.
Volatility Risk: Sudden market changes can make options lose value quickly.

Part 10 Trade Like InstitutionsParticipants in Option Trading
There are mainly four types of participants:
Buyers of Calls: Expect the price to rise.
Sellers of Calls (Writers): Expect the price to stay the same or fall.
Buyers of Puts: Expect the price to fall.
Sellers of Puts (Writers): Expect the price to stay the same or rise.

Part 9 Trading Master ClassHow Option Trading Works
Let’s take an example:
You buy a call option for a stock at a strike price of ₹100 for a premium of ₹5.
If the stock price rises to ₹120 before expiry, you can exercise your right to buy at ₹100 and sell at ₹120, earning ₹20 profit per share (minus ₹5 premium = ₹15 net profit).
If the price remains below ₹100, you simply let the option expire and lose only the premium paid (₹5).
This flexibility — limited loss and unlimited profit potential for buyers — is what makes option trading so attractive.

The Inflation Nightmare: A Global Economic Crisis UnfoldingUnderstanding the Roots of Inflation
Inflation occurs when the general price level of goods and services rises, eroding purchasing power. While moderate inflation is a natural byproduct of economic growth, the current surge is driven by a confluence of factors.
Monetary Policies and Excess Liquidity
Central banks worldwide, in response to the COVID-19 pandemic, adopted aggressive monetary policies, including slashing interest rates and implementing quantitative easing. These measures aimed to stimulate economic activity but also led to an unprecedented increase in the money supply. As the economy began to recover, this excess liquidity contributed to rising demand, outpacing supply and fueling inflation.
Supply Chain Disruptions
The pandemic-induced disruptions in global supply chains have had lasting effects. Lockdowns, labor shortages, and transportation bottlenecks have hindered the production and distribution of goods, leading to shortages and, consequently, higher prices. Industries such as semiconductors, energy, and agriculture have been particularly affected, with ripple effects across various sectors.
Geopolitical Tensions and Energy Prices
Geopolitical events, notably the conflict in Ukraine, have exacerbated energy prices. Sanctions and trade restrictions have disrupted the supply of oil and natural gas, leading to soaring energy costs. Higher energy prices increase production costs across industries, from manufacturing to agriculture, thereby contributing to overall inflation.
Labor Market Dynamics
In many advanced economies, labor markets have tightened, with unemployment rates reaching historic lows. This scarcity of workers has led to increased wages as employers compete for talent. While higher wages are beneficial for workers, they also lead to higher production costs, which businesses often pass on to consumers in the form of higher prices.
Global Implications of Rising Inflation
The ramifications of persistent inflation are far-reaching, affecting various aspects of the global economy.
Erosion of Purchasing Power
For consumers, inflation means that their money buys less than before. Essential goods such as food, housing, and healthcare have seen significant price increases, disproportionately impacting low- and middle-income households. This erosion of purchasing power can lead to decreased standards of living and increased poverty rates.
Central Bank Dilemmas
Central banks face a delicate balancing act. To combat inflation, they may raise interest rates, which can cool economic activity and potentially lead to a recession. Conversely, maintaining low rates to support growth can exacerbate inflation. The Federal Reserve's struggle with this dilemma has been evident, with critics arguing that prolonged low-interest rates contributed to the current inflationary pressures.
American Enterprise Institute
Investment Market Volatility
Inflation impacts investment markets by altering the real returns on assets. Equities may suffer as higher costs squeeze corporate profits, while fixed-income securities lose value as interest rates rise. Commodities like gold and oil may see price increases, but their volatility can deter investors seeking stability. This environment has led to increased market volatility, with investors reassessing risk and return expectations.
Social and Political Unrest
Economic hardship resulting from inflation can lead to social unrest. Protests and strikes have erupted in various countries as citizens demand government intervention to address rising costs. Politicians face mounting pressure to implement policies that can alleviate the burden on consumers without stifling economic growth.
Sectoral Impacts
Different sectors experience inflation differently, with some benefiting and others suffering.
Housing Market
In many regions, housing prices have surged due to increased demand and limited supply. While homeowners may benefit from rising property values, prospective buyers face affordability challenges. Renters also feel the pinch as landlords pass on increased costs.
Technology Sector
The technology sector, particularly semiconductor manufacturing, has been affected by supply chain disruptions. Shortages of key components have led to delays and increased costs, impacting everything from smartphones to automobiles.
Agriculture and Food Industries
Rising energy and labor costs, coupled with supply chain issues, have led to higher food prices. Farmers face increased input costs, while consumers experience higher grocery bills. This sector's challenges are compounded by climate-related events affecting crop yields.
Policy Responses and Proposed Solutions
Governments and central banks have implemented various measures to combat inflation.
Monetary Tightening
Central banks have raised interest rates to curb inflation. While this can help reduce demand, it also risks slowing economic growth and increasing borrowing costs.
Fiscal Stimulus and Subsidies
Some governments have introduced subsidies to alleviate the impact of rising costs on consumers. However, such measures can be fiscally burdensome and may not address the underlying causes of inflation.
Supply-Side Reforms
Addressing supply chain bottlenecks and increasing production capacity can help alleviate inflationary pressures. Investments in infrastructure and technology can enhance efficiency and reduce costs in the long term.
Wage and Price Controls
In extreme cases, governments may consider implementing wage and price controls to directly limit inflation. However, such measures can lead to shortages and reduced quality of goods and services if not carefully managed.
Looking Ahead: Navigating the Inflationary Landscape
The path forward requires a balanced approach that addresses both demand and supply factors contributing to inflation. Policymakers must remain vigilant, adapting strategies as economic conditions evolve. International cooperation is also crucial, as global supply chains and markets are interconnected.
For individuals, financial planning becomes paramount. Diversifying investments, controlling debt, and focusing on savings can provide some protection against inflation's erosive effects. Staying informed and adaptable will be key to navigating this challenging economic landscape.
Conclusion
The current inflationary crisis is a complex phenomenon with deep-rooted causes and widespread effects. Its resolution will require coordinated efforts across governments, central banks, businesses, and individuals. While the path to stability may be fraught with challenges, proactive and informed actions can mitigate the adverse impacts and pave the way for a more resilient economic future.

Super Cycle OutlookIntroduction
The concept of a super cycle in economic and financial markets refers to an extended period, typically spanning decades, during which asset prices or commodity prices trend upward significantly, driven by fundamental structural shifts rather than short-term market fluctuations. Unlike typical market cycles, which may last 3–10 years, super cycles are driven by structural factors such as demographic shifts, technological revolutions, urbanization, industrialization, or major policy reforms. Understanding the super cycle outlook is crucial for investors, policymakers, and corporates as it can profoundly influence investment strategies, resource allocation, and global economic policy.
The super cycle outlook extends across multiple asset classes, including equities, commodities, bonds, real estate, and digital assets. Historically, commodities like oil, metals, and agricultural products have been primary indicators of super cycles. However, in recent years, financial markets, global supply chains, and geopolitical dynamics have increasingly influenced super cycle trends.
Historical Context of Super Cycles
Historically, the global economy has experienced multiple super cycles, each shaped by unique structural shifts:
Post-World War II Industrialization (1945–1970s)
After World War II, the world economy entered a super cycle driven by industrial expansion, reconstruction, and mass urbanization. Countries like the United States, Germany, and Japan experienced rapid economic growth. Commodities such as steel, copper, and oil saw strong demand due to infrastructure building, leading to a prolonged period of rising prices.
Globalization and Emerging Markets Boom (1980s–2000s)
The late 20th century witnessed globalization, liberalization of trade, and the rise of emerging markets, particularly China and India. This period marked a super cycle in industrial commodities as China’s rapid urbanization and manufacturing expansion drove demand for iron ore, copper, and crude oil. Financial markets also experienced sustained growth due to increased capital flows and technological advancements.
The Digital Era and Resource Efficiency (2000s–2020s)
The early 21st century introduced a super cycle centered around technology, energy transition, and environmental sustainability. While traditional commodities experienced volatility, digital infrastructure, rare earth metals, lithium, and energy-efficient technologies gained prominence. This super cycle is unique because it combines technological innovation with sustainability-driven investment trends.
Key Drivers of Current and Future Super Cycles
Several interlinked drivers are shaping the present super cycle outlook:
1. Demographic Shifts
Population growth and urbanization are fundamental long-term drivers of economic super cycles. Emerging markets, particularly in Asia and Africa, are experiencing rapid population growth and urban migration. Urbanization fuels demand for housing, energy, transportation, and infrastructure, which in turn drives commodity consumption and industrial production.
2. Technological Innovation
Technology plays a dual role in shaping super cycles:
Productivity Growth: Innovations in AI, robotics, and automation enhance productivity, reduce costs, and increase global competitiveness.
New Asset Classes: Advancements in renewable energy, electric vehicles, and battery storage create demand for specific commodities like lithium, cobalt, and copper, driving a technological commodities super cycle.
3. Energy Transition and Sustainability
The global shift toward green energy is a defining feature of the current super cycle. Countries and corporations are investing heavily in renewable energy, hydrogen, electric vehicles, and carbon-neutral technologies. This energy transition is expected to sustain demand for green infrastructure materials and energy commodities, creating a long-term upward trend in their prices.
4. Global Monetary and Fiscal Policies
Low-interest-rate environments and expansive fiscal policies in major economies have injected significant liquidity into financial markets. This monetary backdrop can extend asset price super cycles, as investors search for yield in equities, commodities, and alternative assets.
5. Geopolitical Dynamics
Geopolitical events, trade wars, sanctions, and supply chain disruptions are increasingly influencing super cycles. For instance, geopolitical tensions can create supply shortages in critical commodities, driving prices higher for prolonged periods. The Russia-Ukraine conflict highlighted how energy and food commodities can be dramatically affected by geopolitical shocks.
Super Cycle Outlook in Key Asset Classes
1. Equities
Equity markets are influenced by corporate earnings growth, technological innovation, and demographic shifts. Emerging markets equities, particularly in Asia, are poised for long-term growth due to rising middle-class consumption and urbanization. Sectors such as renewable energy, electric vehicles, AI, and healthcare are expected to outperform traditional sectors in this super cycle.
2. Commodities
Commodities remain the most visible markers of super cycles. The current outlook highlights:
Metals: Copper, nickel, lithium, and cobalt demand is projected to surge due to renewable energy infrastructure and electric vehicles.
Energy: Renewable energy transition is altering fossil fuel consumption patterns, but oil and gas may experience periodic spikes due to geopolitical tensions.
Agriculture: Rising population and urbanization will sustain demand for food and water resources, potentially driving agricultural commodity prices upward.
3. Bonds and Interest Rates
In traditional super cycles, bonds often serve as a counterbalance to equities and commodities. The current outlook, however, suggests a complex environment where rising inflation expectations may keep yields volatile. Central banks may adopt a mix of tightening and stimulus measures to balance growth and inflation, influencing bond market super cycles.
4. Digital Assets and Cryptocurrencies
Digital assets are increasingly being viewed as a component of modern super cycles. Cryptocurrencies, blockchain-based assets, and tokenized commodities represent a new class of assets influenced by technological adoption and regulatory evolution.
Implications for Investors and Policymakers
1. Portfolio Diversification
Super cycles emphasize the importance of long-term diversification. Investors should allocate across sectors and asset classes aligned with structural growth drivers such as urbanization, technology adoption, and energy transition. Commodities and emerging market equities may form core components of such a strategy.
2. Risk Management
Super cycles are long-term trends but not immune to corrections. Investors must manage risks arising from geopolitical tensions, inflationary pressures, and supply chain disruptions. Hedging strategies using options, futures, and commodities can help mitigate potential drawdowns.
3. Policy Formulation
Policymakers can leverage super cycles to drive sustainable growth. For instance, infrastructure investment, renewable energy promotion, and technological innovation policies can amplify structural growth, ensuring that economies benefit from long-term demand trends rather than being exposed to short-term volatility.
Current Super Cycle Outlook: 2025–2040
Global Economy
The global economy is likely entering a new super cycle driven by energy transition, technology, and demographic changes. Emerging markets, particularly in Asia and Africa, will be the key growth engines due to rising consumption and industrialization. Developed markets are expected to grow more moderately but will lead in technological innovation and green infrastructure development.
Commodities
Metals: Base metals, particularly copper, nickel, and lithium, will see long-term demand growth. Rare earth elements critical for high-tech applications will experience upward price pressure.
Energy: Renewable energy sources will dominate investments, while oil and gas will remain cyclical with periodic supply shocks.
Agriculture: Urbanization and climate change will drive increased agricultural commodity prices, with potential volatility from extreme weather events.
Equities and Financial Assets
Equities linked to technology, healthcare, and energy transition are expected to outperform traditional sectors. Emerging market equities may outperform developed market equities due to higher growth potential. Bonds and fixed income assets may face pressure from inflation and interest rate volatility, but safe-haven instruments will retain relevance during crises.
Geopolitical Considerations
Super cycles are not immune to geopolitical shocks. Trade realignments, regional conflicts, and global supply chain disruptions will remain critical factors influencing the trajectory of commodities and financial markets.
Potential Challenges to the Super Cycle
Despite positive structural drivers, several challenges could temper the super cycle’s momentum:
Inflationary Pressures
Prolonged inflation could prompt aggressive central bank policies, affecting liquidity-driven asset price growth.
Technological Disruptions
Rapid technological advancements may render existing infrastructure and industries obsolete, creating uneven benefits across sectors.
Climate and Environmental Risks
Climate change may disrupt commodity supply chains, agricultural production, and energy infrastructure, introducing volatility into otherwise steady super cycle trends.
Geopolitical Uncertainty
Prolonged conflicts or trade wars could disrupt supply chains and investment flows, impacting super cycle stability.
Conclusion
The super cycle outlook for the next two decades points to a period of transformative growth, driven by emerging market consumption, technological innovation, and the global energy transition. While traditional commodities will continue to experience cyclical demand, new-age materials, renewable energy assets, and digital technologies are set to define the contours of this super cycle.
Investors and policymakers must align strategies with structural shifts rather than short-term market fluctuations. Diversification, risk management, and forward-looking policy interventions are crucial for capitalizing on opportunities while mitigating potential challenges.
Ultimately, understanding super cycles is not just about predicting prices but about recognizing long-term structural changes that reshape economies, industries, and societies. Those who anticipate these shifts, adapt their strategies, and embrace innovation will be best positioned to thrive in the next super cycle.
Technical Analysis vs. Fundamental AnalysisIntroduction
Investing and trading in financial markets require a thorough understanding of the forces that drive asset prices. Two primary approaches dominate this field: Technical Analysis and Fundamental Analysis. Both aim to guide investors and traders in making informed decisions, yet they diverge significantly in methodology, philosophy, and practical application. Understanding their differences is essential for anyone looking to navigate stock markets, forex, commodities, or cryptocurrencies successfully.
1. Definitions
Technical Analysis (TA) is the study of past market data, primarily price and volume, to forecast future price movements. It operates on the principle that historical price behavior tends to repeat itself due to human psychology and market patterns.
Fundamental Analysis (FA) evaluates a company’s intrinsic value by analyzing economic, financial, and other qualitative and quantitative factors. This method seeks to determine whether an asset is overvalued or undervalued relative to its market price.
In simple terms:
Technical Analysis = What is happening in the market?
Fundamental Analysis = What should the market price be based on value?
2. Core Principles
2.1 Technical Analysis
Technical analysis is grounded in three main assumptions:
Market discounts everything: All information—news, economic indicators, and market sentiment—is reflected in the price. Therefore, studying price alone is sufficient.
Prices move in trends: Prices do not move randomly; they follow identifiable trends and patterns.
History repeats itself: Market psychology drives recurring patterns. Traders use charts and technical indicators to exploit these patterns.
2.2 Fundamental Analysis
Fundamental analysis relies on the belief that markets may misprice assets in the short term but will align with intrinsic value over the long term. Its key principles include:
Intrinsic value matters: Every asset has an underlying value determined by its fundamentals.
Economic and sectoral factors influence prices: Macroeconomic trends, industry health, and company-specific factors affect future performance.
Long-term perspective: FA is generally used by investors looking at long-term returns rather than short-term price fluctuations.
3. Methodology
3.1 Technical Analysis Tools
Technical analysts rely heavily on charts, indicators, and patterns. The methodology includes:
Price Charts: Line charts, bar charts, and candlestick charts are used to visualize price movements.
Technical Indicators: Tools like Moving Averages, Relative Strength Index (RSI), Bollinger Bands, MACD, and Fibonacci retracements help detect trends and reversals.
Patterns: Analysts identify patterns like head-and-shoulders, double tops/bottoms, triangles, and flags to predict future price action.
Volume Analysis: Volume confirms trends; increasing volume suggests a strong trend, while decreasing volume may indicate weakening momentum.
Support and Resistance Levels: These are price levels where buying or selling pressure historically slows or reverses price movement.
3.2 Fundamental Analysis Tools
Fundamental analysts study both qualitative and quantitative data. The methodology includes:
Financial Statements Analysis: Balance sheets, income statements, and cash flow statements reveal profitability, liquidity, and financial stability.
Ratios and Metrics: Price-to-Earnings (P/E), Price-to-Book (P/B), Return on Equity (ROE), Debt-to-Equity ratios, and dividend yield help compare companies.
Economic Indicators: GDP growth, inflation rates, interest rates, and employment data influence market trends.
Industry Analysis: Market share, competition, regulatory environment, and industry growth rates are considered.
Qualitative Factors: Management quality, brand strength, competitive advantages, and business models are assessed for long-term sustainability.
4. Time Horizon
Technical Analysis: Usually favors short-term to medium-term trading, ranging from minutes (intraday) to months (swing trading). It focuses on price momentum rather than intrinsic value.
Fundamental Analysis: More suitable for long-term investing, often spanning years. It requires patience as market prices may take time to reflect true value.
5. Advantages and Benefits
5.1 Technical Analysis Advantages
Market Timing: Helps identify entry and exit points with precision.
Versatility: Applicable to all markets—stocks, forex, commodities, and cryptocurrencies.
Short-term Trading Focus: Ideal for traders seeking profits from price volatility.
Emotion Management: Rules-based systems reduce reliance on intuition or emotions.
Quantitative Signals: Indicators provide measurable, repeatable criteria for trades.
5.2 Fundamental Analysis Advantages
Value Discovery: Helps identify undervalued or overvalued assets.
Long-term Investment Guidance: Suitable for building portfolios with sustainable growth.
Risk Reduction: Understanding company and economic fundamentals reduces exposure to speculative bubbles.
Informed Decisions: Offers a holistic view, including market conditions, company health, and macroeconomics.
Dividends and Earnings Insight: Investors can estimate long-term returns, including dividends.
6. Limitations and Challenges
6.1 Technical Analysis Limitations
No Intrinsic Value Insight: TA ignores the underlying health or value of an asset.
False Signals: Indicators and patterns can generate misleading signals, especially in volatile or low-liquidity markets.
Subjectivity: Interpretation of charts and patterns may vary among analysts.
Short-term Focus: Less effective for long-term investing, where fundamentals dominate.
6.2 Fundamental Analysis Limitations
Time-Consuming: Requires extensive research and analysis of multiple data sources.
Market Timing Challenge: FA does not provide precise buy/sell signals; prices may deviate from intrinsic value for extended periods.
Complexity: Requires understanding accounting, economics, and industry-specific knowledge.
Qualitative Uncertainty: Factors like management quality or brand strength are subjective and difficult to quantify.
7. Applications in Trading and Investing
7.1 Technical Analysis Applications
Day Trading: Identifying intraday price patterns for quick profits.
Swing Trading: Capturing short- to medium-term trends.
Scalping: Exploiting minute price movements.
Algorithmic Trading: Automated systems often rely on technical indicators for trade execution.
7.2 Fundamental Analysis Applications
Value Investing: Identifying undervalued stocks for long-term gains (e.g., Warren Buffett’s strategy).
Dividend Investing: Selecting companies with strong, sustainable dividends.
Economic Forecasting: Understanding macroeconomic trends to guide asset allocation.
Mergers and Acquisitions: Evaluating companies for potential investment or takeover.
8. Complementary Use
Many successful investors combine both methods to enhance decision-making:
Technical Analysis for Timing: FA identifies undervalued stocks, while TA determines optimal entry/exit points.
Risk Management: TA can indicate stop-loss levels and potential reversals, mitigating FA’s long-term uncertainty.
Example: An investor may use FA to select a fundamentally strong company but use TA to enter the stock during a short-term price dip.
9. Philosophical Differences
Technical Analysis: Focuses on market behavior and human psychology. Prices are the ultimate reflection of all available information.
Fundamental Analysis: Focuses on value creation and real-world economic performance. Markets may misprice assets temporarily, but intrinsic value will dominate in the long run.
10. Case Studies
Tesla Inc. (TSLA):
Fundamental Analysis: Early investors focused on innovation, revenue growth, and market potential.
Technical Analysis: Traders identified support/resistance levels and momentum to profit from price volatility.
Gold Futures:
Fundamental Analysis: Influenced by inflation, currency strength, and geopolitical uncertainty.
Technical Analysis: Chart patterns and trend indicators guide short-term trades.
11. Choosing the Right Approach
For Traders: Technical analysis is generally more useful due to its focus on short-term price movements and patterns.
For Long-term Investors: Fundamental analysis is preferred, as it uncovers intrinsic value and sustainable growth prospects.
Hybrid Approach: Many professionals adopt a combination to leverage the strengths of both methods, minimizing weaknesses.
12. Conclusion
Technical and fundamental analysis represent two distinct philosophies of interpreting financial markets. Technical analysis emphasizes market behavior, trends, and price patterns, making it ideal for traders seeking short-term profits. Fundamental analysis examines economic and financial fundamentals to gauge the intrinsic value of assets, aligning more with long-term investing.
Both have strengths and limitations, and the choice between them depends on the investor’s goals, time horizon, and risk appetite. However, combining both approaches can offer a powerful strategy: using fundamental analysis to identify the right assets and technical analysis to optimize entry and exit points.
In today’s dynamic financial markets, mastery of both disciplines equips investors and traders with the analytical tools necessary to navigate volatility, mitigate risk, and capitalize on opportunities. While TA provides the “when” to act, FA answers the “what” to act upon—a synergy that can enhance both profitability and confidence in market decisions.
Entry to Exit: Step-by-Step Trading Management1. Pre-Trade Preparation
Before you even think about entering a trade, preparation is critical. This stage sets the foundation for disciplined execution.
a. Market Analysis
Technical Analysis: Use charts, indicators, and patterns to identify potential entry points.
Identify support and resistance levels.
Observe candlestick patterns for price action clues.
Use trend indicators like moving averages, MACD, or RSI to assess momentum.
Fundamental Analysis: Understand the underlying factors affecting the asset.
Economic data, earnings reports, central bank decisions.
News and geopolitical events.
Sentiment Analysis: Gauge market psychology.
Look at volatility indices, open interest, or social sentiment.
b. Define Your Trading Plan
Set Clear Objectives: Determine your risk appetite and target returns.
Time Frame Selection: Choose your trading horizon (intraday, swing, or positional).
Risk Management Rules: Decide maximum risk per trade (commonly 1–3% of capital).
2. Entry Strategy
The entry is where strategy meets execution. A well-timed entry increases the probability of success.
a. Entry Types
Breakout Entry: Enter when price breaks key support/resistance levels.
Ensure confirmation (volume spike, retest of breakout level).
Pullback/Trend-Following Entry: Enter on a retracement in a trending market.
Use Fibonacci levels or moving averages for precision.
Reversal Entry: Enter when a trend is showing signs of exhaustion.
Look for reversal candlestick patterns (hammer, engulfing).
b. Entry Confirmation
Avoid jumping in impulsively; confirm with:
Price action analysis.
Technical indicators (MACD crossover, RSI divergence).
Volume spikes (high volume validates the move).
c. Position Sizing
Determine trade size based on:
Risk per trade (% of capital you are willing to lose).
Stop-loss distance.
Formula:
Position Size = (Risk Amount / Stop Loss Distance) × Trade Multiplier
3. Stop-Loss and Risk Management
Effective risk management ensures you survive losing streaks and protect your capital.
a. Setting Stop-Loss
Technical Stop-Loss: Place beyond support/resistance or key swing levels.
Volatility Stop-Loss: Based on Average True Range (ATR) to allow normal market noise.
Time-Based Stop-Loss: Exit after a specific period if the trade is not moving in your favor.
b. Risk-to-Reward Ratio
Maintain at least 1:2 or 1:3 R:R to make your strategy profitable in the long run.
Example: Risk $100 to make $200–$300.
c. Trailing Stop-Loss
Adjust stop-loss as the trade moves in your favor to lock in profits while giving the trade room to grow.
4. Trade Monitoring and Management
Once in a trade, the work doesn’t stop. Active monitoring is crucial to manage outcomes effectively.
a. Observe Market Conditions
Stay aware of news, sudden market swings, and volatility spikes.
Avoid making emotional decisions based on temporary market noise.
b. Partial Profit Booking
Take profits on a portion of the trade at key levels to reduce risk.
Example: Book 50% profit at first resistance/support and let the rest run.
c. Scaling In/Out
Scaling In: Add to a winning position at predetermined levels.
Scaling Out: Reduce exposure gradually to protect gains.
d. Avoid Overtrading
Do not enter new positions impulsively based on a winning trade.
Stick to your plan and wait for the next valid setup.
5. Exit Strategy
Exit planning is as critical as entry. Exiting with discipline protects profits and limits losses.
a. Profit Target Exit
Predefine target levels based on:
Historical highs/lows.
Fibonacci extensions.
Trendlines or pivot points.
b. Stop-Loss Exit
Let stop-losses do their job if the market moves against you.
Avoid moving stop-loss further away unless part of a pre-defined trailing strategy.
c. Time-Based Exit
Some trades need closure after a set period to avoid overnight risk or weekly/monthly expirations.
Particularly useful in options, futures, or intraday trading.
d. Reversal Signals
Exit if price action shows a clear reversal pattern.
Confirm with momentum indicators like MACD divergence or RSI overbought/oversold conditions.
6. Post-Trade Analysis
After the trade is closed, analyzing your performance is critical for long-term improvement.
a. Review Trade Decisions
Why did you enter? Did the market behave as expected?
Was your stop-loss placement appropriate?
Did you follow your plan or act on emotion?
b. Record-Keeping
Maintain a trading journal:
Entry and exit points.
Stop-loss and target.
Outcome and lessons learned.
c. Performance Metrics
Calculate win/loss ratio.
Evaluate risk-adjusted returns.
Identify patterns of mistakes to correct in future trades.
7. Psychological and Emotional Management
Trading is as much about mental discipline as it is about strategy.
a. Discipline
Stick to your plan regardless of short-term outcomes.
Avoid revenge trading or impulsive exits.
b. Emotional Control
Fear and greed are traders’ worst enemies.
Use checklists to reduce emotional decision-making.
c. Confidence Building
Start with smaller position sizes.
Gradually increase risk as your strategy proves profitable.
8. Advanced Trade Management Techniques
For experienced traders, there are ways to optimize entries and exits:
a. Multiple Time Frame Analysis
Confirm trade setups on higher and lower time frames.
Avoid taking trades that conflict with long-term trends.
b. Hedging
Use options or other derivatives to protect profitable positions.
Particularly useful in volatile markets.
c. Automated or Algorithmic Stops
Pre-set stop-loss and target levels in trading platforms.
Reduces the risk of emotional interference.
Conclusion
Trading management from entry to exit is a structured process that blends strategy, discipline, and psychology. By following these steps, a trader can:
Identify high-probability setups.
Enter trades with precise execution.
Protect capital with robust risk management.
Monitor trades actively without emotional interference.
Exit at predefined levels or with adaptive strategies.
Learn and improve continuously through post-trade analysis.
Success in trading is not about winning every trade but about managing trades systematically so that over time, profits outweigh losses. The key lies in preparation, discipline, and consistent execution.

Crypto Trading Secrets1. Understanding the Crypto Market’s Unique Nature
Before diving into trading strategies, it’s critical to understand what makes cryptocurrency markets different from traditional markets:
24/7 Market: Unlike stock markets, crypto never sleeps. Prices can move dramatically at any hour, requiring traders to adapt their strategies to a continuous market.
High Volatility: Crypto assets often exhibit double-digit percentage swings in a single day. While risky, volatility presents both opportunity and peril.
Decentralization and Influence: Unlike stocks, where a company’s performance and regulatory news drive price, crypto prices are influenced by broader adoption, sentiment, social media, and technology updates.
Liquidity Variance: Not all coins are equally liquid. Major coins like Bitcoin and Ethereum can handle large trades without significant slippage, whereas smaller altcoins can be extremely volatile even on small trades.
Recognizing these market characteristics is the first step toward trading successfully.
2. Technical Analysis: The Trader’s Compass
Technical analysis (TA) is the backbone of crypto trading. While it cannot predict the future, it allows traders to make informed probabilistic decisions.
Candlestick Patterns: Candlestick charts reveal market psychology. Patterns like “doji,” “hammer,” and “engulfing” can signal potential reversals or continuation trends.
Support and Resistance: Identifying price levels where buying or selling pressure historically emerges helps traders determine entry and exit points.
Trend Analysis: Understanding whether a crypto asset is in an uptrend, downtrend, or sideways market is crucial. Indicators like moving averages (MA) and exponential moving averages (EMA) smooth out noise and reveal trends.
Volume Analysis: Volume confirms trends. Rising prices on low volume may signal weak momentum, whereas high volume validates a trend.
Oscillators and Indicators: Tools like RSI (Relative Strength Index), MACD (Moving Average Convergence Divergence), and Bollinger Bands help detect overbought or oversold conditions, divergence, and potential breakouts.
Secret Tip: Many top traders combine multiple indicators instead of relying on one. Confluence of signals increases the probability of success.
3. Fundamental Analysis in Crypto
While technical analysis deals with price charts, fundamental analysis (FA) focuses on the intrinsic value and potential of an asset.
Project Fundamentals: Understanding the utility of a token, team credibility, partnerships, and roadmap can provide insight into long-term potential.
Network Metrics: For blockchain projects, on-chain metrics like active addresses, transaction volume, and staking data provide clues about adoption and demand.
Regulatory Environment: Cryptocurrencies are sensitive to regulatory announcements, taxation, and bans. Being aware of jurisdictional risks can prevent losses.
News and Sentiment Analysis: Crypto markets react strongly to news. Monitoring Twitter, Reddit, and specialized news sources helps traders gauge market sentiment.
Secret Tip: Successful traders often combine fundamental triggers with technical entry points for timing trades.
4. Mastering Risk Management
Even the best strategies fail without disciplined risk management. Here’s how seasoned crypto traders protect their capital:
Position Sizing: Never risk more than a small percentage of your portfolio on a single trade—commonly 1-3%.
Stop-Loss Orders: Automatically exit a trade when the price moves against you. This prevents emotional decision-making.
Take-Profit Targets: Predetermine exit points to secure gains instead of chasing prices endlessly.
Portfolio Diversification: Avoid putting all your funds into a single coin or market. Diversifying reduces exposure to catastrophic loss.
Avoid Over-Leverage: While leverage amplifies gains, it also magnifies losses. Many traders fall into the trap of over-leveraging in the crypto futures market.
Secret Tip: Consider “risk-to-reward ratio” before entering a trade. A minimum 1:2 ratio (risk $1 to potentially gain $2) improves profitability over time.
5. Understanding Market Psychology
Crypto trading is as much about psychology as it is about strategy. The market is driven by emotions like fear and greed.
Fear and Greed Index: Monitor sentiment to gauge whether the market is overheated or depressed.
FOMO (Fear of Missing Out): Avoid impulsive buying during rallies. Instead, follow your trading plan.
FUD (Fear, Uncertainty, Doubt): Negative news often causes panic selling. Experienced traders view such moments as potential buying opportunities.
HODL vs. Active Trading: Some traders profit from long-term holding, while others focus on active swing or day trading. Understanding your own risk tolerance and psychological comfort is key.
Secret Tip: Emotional discipline can often make the difference between a profitable trader and a losing one.
6. Leveraging Advanced Trading Strategies
Top crypto traders use advanced strategies to maximize returns:
Swing Trading: Capitalizes on short-to-medium-term price movements, often lasting days to weeks.
Scalping: Involves making many small trades for tiny profits. Requires constant monitoring and quick execution.
Arbitrage: Exploiting price differences across exchanges. With high-speed execution, traders can profit from small inefficiencies.
Hedging: Using derivatives like futures and options to protect a portfolio from market downturns.
Algorithmic Trading: Automated strategies based on coded rules can remove emotion from trading and execute trades at high speed.
Secret Tip: Even advanced strategies require backtesting. Never deploy a strategy in a live market without testing it under historical conditions.
7. Choosing the Right Exchanges and Tools
The platform you trade on can influence both profitability and security.
Exchange Selection: Look for liquidity, fees, security protocols, and reputation. Top exchanges like Binance, Coinbase, and Kraken offer stability and high trading volumes.
Portfolio Management Tools: Track positions, performance, and PnL with tools like CoinStats, Delta, or Blockfolio.
Charting Tools: TradingView is a preferred choice for technical analysis due to its advanced charting and community strategies.
Security Practices: Enable two-factor authentication (2FA), use hardware wallets for long-term holdings, and beware of phishing scams.
Secret Tip: Keep some capital in stablecoins for quick deployment during market opportunities.
8. Timing the Market: Patience Meets Strategy
While timing is notoriously difficult, some techniques help traders improve decision-making:
Dollar-Cost Averaging (DCA): Instead of investing a lump sum, buy at regular intervals to average out price volatility.
Trend Following: Enter trades in the direction of strong trends and avoid counter-trend trades unless highly confident.
Breakouts and Pullbacks: Entering on confirmed breakouts or after healthy pullbacks reduces risk compared to buying at local peaks.
Macro Awareness: Cryptocurrency markets often correlate with macroeconomic events, Bitcoin halving cycles, and global liquidity conditions.
Secret Tip: Avoid chasing tops and bottoms. Discipline often beats luck.
9. Continuous Learning and Adaptation
Crypto markets evolve rapidly, making continuous education essential:
Stay Informed: Follow blockchain development, news, and regulatory changes.
Review Trades: Maintain a trading journal to analyze successes and mistakes.
Adapt Strategies: Market conditions change. Strategies that worked in 2021 may fail in 2025.
Community Engagement: Participate in forums, Discord groups, and Twitter threads to learn from experienced traders and developers.
Secret Tip: Treat trading like a skill, not gambling. Learning compounds over time.
10. Key Takeaways: Secrets Summarized
Knowledge is Power: Understand technical and fundamental analysis.
Risk Discipline: Protect capital with stop-losses and position sizing.
Emotional Control: Avoid FOMO and panic selling.
Advanced Techniques: Use swing trading, scalping, hedging, and algorithmic strategies wisely.
Tools Matter: Choose reliable exchanges, wallets, and charting platforms.
Continuous Learning: Stay updated and analyze your own performance.
Crypto trading secrets aren’t magic formulas—they’re principles that, when applied consistently, give you an edge in a volatile market. The most successful traders combine strategy, discipline, and emotional control with a relentless commitment to learning.

Introduction to Volatility Index TradingUnderstanding Volatility
Volatility is a statistical measure of the dispersion of returns for a given security or market index. It is often calculated using standard deviation or variance, indicating how much the price of an asset deviates from its average value over a period. There are two main types of volatility:
Historical Volatility (HV): Measures past price fluctuations of a security over a defined time period. It is backward-looking and often used to assess the past risk profile.
Implied Volatility (IV): Reflects the market’s expectation of future price movements, derived from the pricing of options contracts. It is forward-looking and integral to VIX calculations.
The VIX specifically captures implied volatility, giving traders a sense of expected market turbulence. High VIX readings indicate a volatile market environment with increased fear, while low readings suggest calm or complacency among investors.
The VIX – The Fear Gauge
Introduced by the Chicago Board Options Exchange (CBOE) in 1993, the VIX measures expected volatility over the next 30 days using a wide range of S&P 500 options. Its calculation is unique:
The VIX is based on the weighted prices of out-of-the-money calls and puts.
It estimates expected volatility in percentage terms on an annualized basis.
For instance, a VIX value of 20 implies an expected annualized volatility of 20%, roughly translating to a 5.8% monthly expected move in the S&P 500 (20% ÷ √12).
The VIX does not move linearly with market indices. Instead, it has an inverse correlation with the S&P 500. When markets fall sharply, fear rises, pushing the VIX higher. Conversely, when markets rally steadily, the VIX tends to decline.
Instruments for Volatility Trading
Volatility trading is not confined to the VIX itself. Traders can access volatility exposure through several instruments:
VIX Futures: Contracts that allow speculation on the future value of the VIX. They are cash-settled and are widely used for hedging or trading volatility directly.
VIX Options: Options on VIX futures provide leveraged exposure to volatility movements. They are complex instruments that require an understanding of the VIX’s unique behavior.
Exchange-Traded Products (ETPs): ETFs and ETNs track volatility indices or VIX futures. Examples include VXX and UVXY, which are designed to mimic VIX futures performance but are subject to daily rebalancing effects.
Volatility Swaps: Over-the-counter derivatives that allow traders to exchange fixed volatility for realized volatility. These instruments are mostly used by institutional traders.
Options on Stocks and Indices: Trading strategies using options can indirectly target volatility by exploiting changes in implied volatility levels.
Strategies in Volatility Trading
Volatility trading strategies are diverse and can be categorized into speculative, hedging, and arbitrage strategies:
1. Speculative Trading
Traders often speculate on market fear or complacency using the VIX:
Long VIX Futures or Calls: Investors buy VIX futures or call options expecting a spike in market volatility. This strategy pays off during market sell-offs or crises.
Short VIX Futures or Puts: Selling VIX futures or put options benefits when markets remain calm and volatility decreases.
Speculative trades require careful timing because volatility exhibits mean-reversion behavior—spikes are typically followed by declines, and prolonged periods of low volatility tend to precede sudden increases.
2. Hedging Strategies
Volatility instruments are crucial for hedging portfolios:
Portfolio Insurance: Investors holding large equity positions can buy VIX call options to protect against sudden market drops.
Tail Risk Hedging: This involves purchasing deep out-of-the-money VIX options to hedge against extreme events like financial crises.
Hedging reduces potential losses but comes at the cost of premiums, which can erode returns if volatility remains low.
3. Volatility Arbitrage
Volatility arbitrage exploits discrepancies between implied and realized volatility:
Long/Short Options: Traders buy underpriced options and sell overpriced ones, profiting when implied volatility converges with realized volatility.
Calendar Spreads: These involve taking positions in options with different expirations to profit from changes in implied volatility over time.
Arbitrage strategies require sophisticated modeling and constant monitoring of market conditions.
Key Concepts for VIX Traders
Volatility trading relies on several unique concepts that differ from traditional market trading:
Mean Reversion: Volatility tends to revert to a long-term average over time. Extreme spikes are typically temporary, which affects timing and strategy decisions.
Contango and Backwardation: VIX futures markets are often in contango (futures prices higher than spot VIX) or backwardation (futures lower than spot VIX). These conditions impact returns for products tracking VIX futures.
Implied vs. Realized Volatility: Traders monitor discrepancies between expected (implied) and actual (realized) volatility to identify trading opportunities.
Leverage and Decay: Many VIX-linked ETPs use leverage and daily rebalancing, which can lead to performance decay over long holding periods due to compounding effects.
Risks in Volatility Trading
While volatility trading offers opportunities, it also comes with significant risks:
High Leverage Risk: Many volatility instruments amplify gains and losses, requiring disciplined risk management.
Complexity Risk: VIX derivatives and ETFs can behave differently than spot volatility, and misinterpretation can lead to unexpected losses.
Market Timing Risk: Correctly predicting volatility spikes or declines is extremely challenging.
Liquidity Risk: Some instruments, particularly over-the-counter derivatives, may have limited liquidity.
Decay Risk: Leveraged volatility products are subject to time decay and volatility drag, eroding value in prolonged trends.
Because of these risks, volatility trading is generally suited for experienced traders and institutional investors, not beginners.
Practical Applications of Volatility Trading
Despite its complexity, VIX trading has practical applications:
Hedging Equity Portfolios: Using VIX calls or futures, investors can mitigate losses during market corrections.
Speculative Opportunities: Traders can profit from market fear spikes or periods of extreme complacency.
Diversification Tool: Volatility often moves independently of traditional asset classes, providing diversification benefits.
Market Sentiment Analysis: Monitoring the VIX helps gauge investor fear and sentiment, informing broader investment decisions.
Volatility in Market Crises
Historical market events highlight the importance of volatility trading:
2008 Global Financial Crisis: VIX spiked to over 80, reflecting extreme investor fear and market uncertainty.
COVID-19 Pandemic (2020): VIX surged above 80 during initial market panic, showcasing the critical role of volatility instruments for hedging and speculation.
These crises demonstrate that VIX trading is particularly relevant during periods of extreme market stress, providing both risk management tools and trading opportunities.
Conclusion
Volatility Index trading is a sophisticated domain of financial markets that goes beyond traditional buy-and-hold strategies. By providing insight into market fear and expected fluctuations, the VIX enables traders and investors to hedge risk, speculate on market sentiment, and diversify portfolios. Successful volatility trading requires a deep understanding of implied vs. realized volatility, market timing, derivatives mechanics, and risk management principles.
While opportunities in volatility trading are significant, they are accompanied by equally significant risks, particularly due to leverage, market unpredictability, and instrument complexity. Therefore, mastering VIX trading demands experience, discipline, and continuous monitoring of global market conditions.
In an era of increasing market uncertainty, understanding and trading volatility is not just an advanced financial skill—it is an essential tool for navigating the ever-changing landscape of global markets.
Trading with CandlesticksIntroduction
Candlestick trading is one of the most widely used and powerful methods in technical analysis. It provides a visual and psychological representation of price movement over a specific time frame. Originating in Japan in the 18th century, candlestick charts were first used by rice traders to predict price movements based on market emotions. Today, traders worldwide—from beginners to institutional professionals—use candlesticks to identify trends, reversals, and potential entry or exit points in financial markets, including stocks, forex, commodities, and cryptocurrencies.
Candlestick charts combine simplicity and depth, revealing not just price direction but also market sentiment, momentum, and volatility—all in one glance. Let’s explore in detail how candlestick trading works, its patterns, and strategies to apply it effectively.
1. What Are Candlesticks?
A candlestick represents the price action of an asset within a specific time frame (for example, 1 minute, 1 hour, 1 day, or 1 week). Each candlestick shows four key data points:
Open – The price at which the asset began trading during that period.
Close – The price at which it finished trading for that period.
High – The highest price reached during that period.
Low – The lowest price during that period.
These data points are displayed in a rectangular shape called the body, with thin lines extending above and below, known as wicks or shadows.
Bullish Candle: When the closing price is higher than the opening price (usually shown in green or white).
Bearish Candle: When the closing price is lower than the opening price (usually shown in red or black).
The length of the body and shadows helps traders understand market momentum and psychological pressure between buyers (bulls) and sellers (bears).
2. Anatomy of a Candlestick
To interpret a candlestick effectively, one must understand its components:
Long Body: Indicates strong buying or selling pressure.
Short Body: Suggests indecision or consolidation.
Long Upper Shadow: Sellers pushed the price down after buyers initially drove it up.
Long Lower Shadow: Buyers pushed the price up after sellers initially drove it down.
No Shadows (Marubozu): Represents strong conviction from either buyers or sellers throughout the session.
For example:
A bullish marubozu (long green candle without shadows) signals strong buying interest.
A bearish marubozu (long red candle) indicates strong selling pressure.
3. History and Origin of Candlestick Charts
Candlestick analysis dates back to the 1700s when Munehisa Homma, a Japanese rice trader, developed this technique to forecast rice prices. He realized that human emotions influenced market behavior, and by studying price patterns, he could predict future movements. His concepts of “bullish” and “bearish” sentiment still form the foundation of technical trading today.
Candlestick analysis was later introduced to Western markets by Steve Nison in the 1990s through his book “Japanese Candlestick Charting Techniques.” Since then, it has become a fundamental part of modern trading.
4. Advantages of Candlestick Trading
Candlestick charts offer several advantages over traditional bar or line charts:
Visual Clarity: Candles make it easy to identify patterns and reversals quickly.
Psychological Insight: Each candle shows who controls the market—buyers or sellers.
Works Across Markets: Effective in equities, forex, commodities, and crypto.
Combines Well With Other Tools: Traders often combine candlestick patterns with indicators like RSI, MACD, or moving averages for confirmation.
Time Flexibility: Works equally well across intraday, daily, or weekly charts.
5. Major Candlestick Patterns
Candlestick patterns are combinations of one or more candles that help predict market direction. They can be single, double, or triple candle patterns.
A. Single Candlestick Patterns
Doji:
Open and close prices are almost equal, forming a cross-like shape.
Indicates market indecision and potential reversal.
Types: Long-Legged Doji, Dragonfly Doji, Gravestone Doji.
Hammer:
Small body, long lower shadow.
Appears after a downtrend, signaling a potential bullish reversal.
Inverted Hammer:
Small body with a long upper shadow.
Suggests buyers are gaining strength after a downtrend.
Shooting Star:
Opposite of an inverted hammer; occurs at the top of an uptrend.
Indicates a potential bearish reversal.
Spinning Top:
Small body with long upper and lower shadows.
Reflects indecision, often preceding a breakout.
B. Double Candlestick Patterns
Bullish Engulfing:
A small red candle followed by a large green candle that completely engulfs it.
Suggests strong buying momentum and a possible uptrend.
Bearish Engulfing:
A small green candle followed by a large red candle that engulfs it.
Indicates potential downward reversal.
Piercing Pattern:
Appears after a downtrend; the second candle (bullish) opens lower but closes above the midpoint of the first candle.
Dark Cloud Cover:
Appears after an uptrend; the second candle (bearish) opens higher but closes below the midpoint of the first candle.
C. Triple Candlestick Patterns
Morning Star:
Three-candle bullish reversal pattern.
Consists of a bearish candle, a small indecisive candle (Doji or Spinning Top), and a strong bullish candle.
Evening Star:
Bearish version of the Morning Star; signals the end of an uptrend.
Three White Soldiers:
Three consecutive long green candles.
Confirms strong bullish sentiment and trend continuation.
Three Black Crows:
Three long red candles; a clear sign of bearish strength and trend reversal.
6. How to Trade Using Candlestick Patterns
To effectively trade with candlestick patterns, traders must combine pattern recognition with market context. Here’s a step-by-step guide:
Step 1: Identify the Trend
Before entering a trade, determine the overall trend using moving averages or trendlines.
Candlestick patterns are most reliable when traded in alignment with the broader trend.
Step 2: Spot a Reversal or Continuation Pattern
Look for patterns like hammers, engulfing candles, or stars near key support/resistance zones.
Confirm with volume—higher volume adds credibility to the pattern.
Step 3: Confirm With Indicators
Use indicators like RSI (for overbought/oversold conditions), MACD (for trend confirmation), or Bollinger Bands (for volatility signals).
Step 4: Plan Entry and Exit
For bullish patterns: Enter near the candle close or on the next candle’s breakout.
For bearish patterns: Enter when price breaks below the pattern low.
Set stop-loss below the pattern’s shadow (for long trades) or above it (for short trades).
Step 5: Manage Risk
Always use stop-loss orders.
Avoid over-leveraging.
Follow a risk-reward ratio of at least 1:2.
7. Combining Candlesticks with Support and Resistance
Support and resistance levels are critical in candlestick analysis:
Support: A price level where buying pressure is strong enough to prevent further decline.
Resistance: A level where selling pressure prevents price from rising.
When a candlestick reversal pattern appears near these levels (e.g., hammer at support or shooting star at resistance), the signal’s reliability increases significantly.
8. Candlestick Patterns and Market Psychology
Each candlestick tells a story about the battle between bulls and bears. Understanding this psychology helps predict the next move:
Long bullish candle: Buyers dominated the session.
Long bearish candle: Sellers controlled the market.
Doji: Both sides are uncertain; possible reversal ahead.
Engulfing pattern: Indicates a sudden shift in sentiment.
This emotional representation gives traders an edge in anticipating future price behavior.
9. Common Mistakes in Candlestick Trading
Ignoring Market Context:
Patterns are less reliable without trend confirmation.
Trading Every Pattern:
Not all patterns lead to reversals; combine with volume and indicators.
Neglecting Risk Management:
Even reliable patterns can fail; always use stop-loss.
Overcomplicating Charts:
Stick to key time frames and clear patterns—avoid chart clutter.
10. Modern Application of Candlestick Trading
With digital platforms and AI-based charting tools, traders now have access to automatic pattern recognition. Platforms like TradingView, MetaTrader, and ThinkorSwim help identify and validate candlestick formations in real time. Algorithms even analyze sentiment and probability to enhance decision-making.
However, human interpretation remains irreplaceable. The trader’s intuition, experience, and understanding of market psychology remain essential for success.
11. Example of a Practical Candlestick Setup
Scenario: Stock XYZ is in a downtrend and approaches a major support level.
You notice:
A long Hammer candle forms at support.
RSI shows oversold conditions (<30).
Volume spikes, suggesting buying interest.
Trade Plan:
Entry: On the next candle when price breaks above the hammer’s high.
Stop-Loss: Below the hammer’s low.
Target: 2x the risk or next resistance level.
This combination of candlestick, support, and indicator confirmation makes for a high-probability trade setup.
12. Advantages and Limitations
Advantages:
Quick visual analysis.
Applies to all asset classes.
Helps identify sentiment shifts early.
Limitations:
False signals during volatile markets.
Requires experience to interpret correctly.
Should be used with supporting tools, not in isolation.
Conclusion
Candlestick trading is a time-tested and psychologically rich method for understanding market behavior. It reflects the constant struggle between buyers and sellers, allowing traders to interpret emotions through price movements. Whether you’re trading stocks, forex, or crypto, mastering candlestick patterns helps you make informed decisions, manage risk, and anticipate market shifts.
However, no pattern guarantees success—discipline, context, and confirmation are key. When combined with sound risk management and fundamental analysis, candlestick trading becomes not just a charting method but a strategic framework for consistent and intelligent trading.