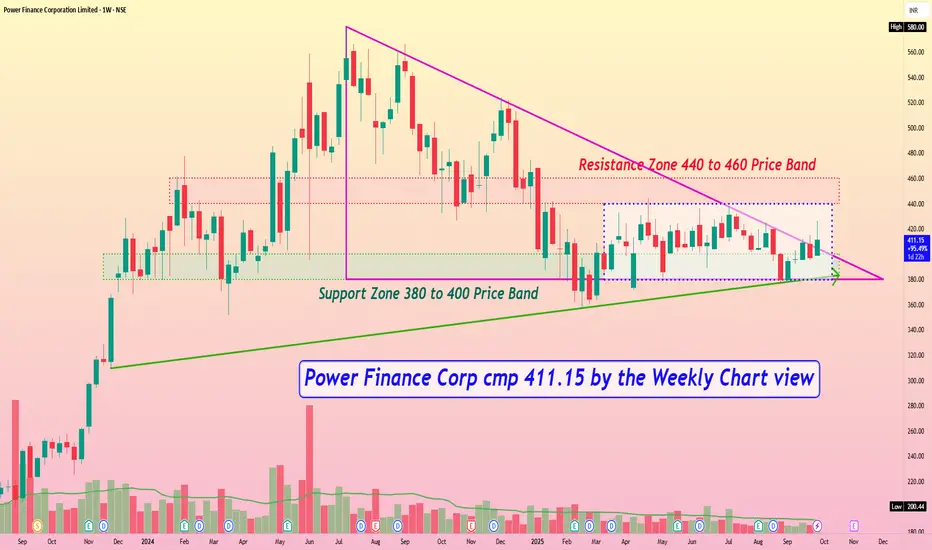
Power Finance Corp cmp 411.15 by the Weekly Chart viewPower Finance Corp cmp 411.15 by the Weekly Chart view
- Support Zone 380 to 400 Price Band
- Resistance Zone 440 to 460 Price Band
- Price traversing within Descending Triangle pattern after ATH
- Rising Support Trendline well respected by touch points since close to 2 years
- Price seen majorly trending inside Darvas Box since Mar 2025 in a range of 380 to 440
- Volumes in close sync with avg traded qty on Daily Chart and in steady stream by Weekly Chart
Trendlinesupportzone
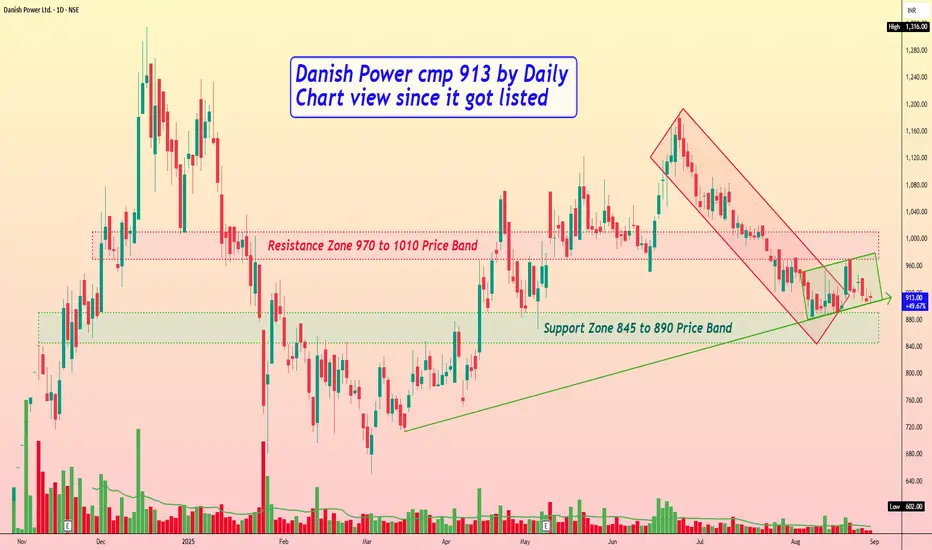
Danish Power cmp 913 by Daily Chart view since listedDanish Power cmp 913 by Daily Chart view since listed
- Support Zone 845 to 890 Price Band
- Resistance Zone 970 to 1010 Price Band
- Breakout from Falling Resistance Price Channel sustained
- Rising Support Price Channel trending post Support Zone test and retest
- Demand based Buying Volumes needed to counter profit booking selling pressure
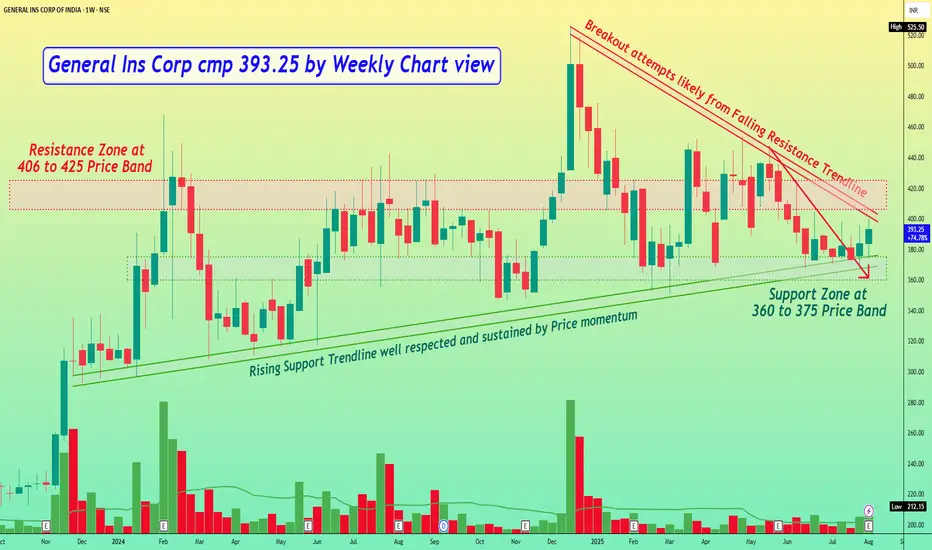
GICRE General Ins Corp cmp 393.25 by Weekly Chart viewGeneral Ins Corp cmp 393.25 by Weekly Chart view
- Support Zone at 360 to 375 Price Band
- Resistance Zone at 406 to 425 Price Band
- Breakout attempts likely from Falling Resistance Trendline
- Rising Support Trendline well respected and sustained by Price momentum
- Volumes seem well in sync with average traded quantity over the past few weeks
- *Subject to Strong Resistance Zone Breakout happens, it would a good hurdle to crossover*
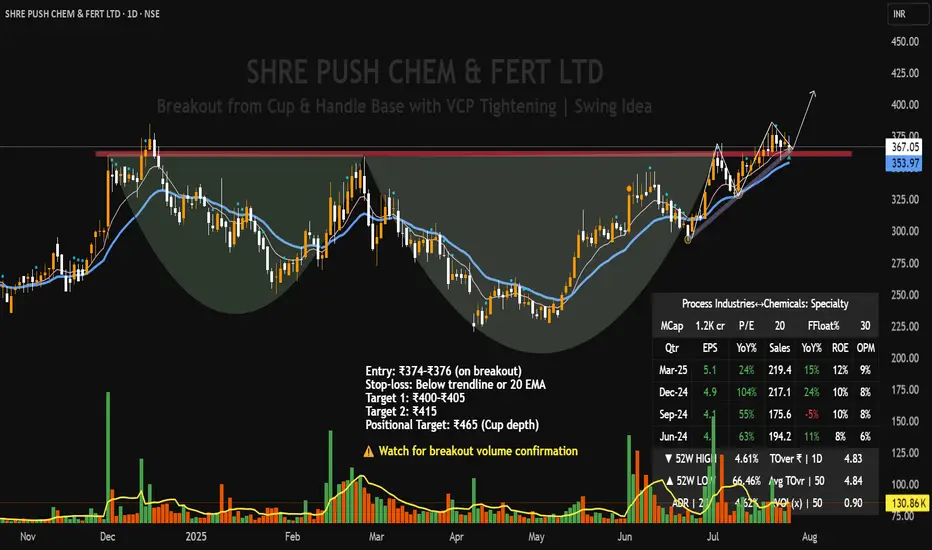
SHREE PUSHKAR CHEMICALS – Cup & Handle + VCP Breakout Setup |Technical Structure:
SHREE PUSHKAR CHEMICALS is forming a high-quality breakout setup on the daily chart, combining both a Cup & Handle pattern and a Volatility Contraction Pattern (VCP) within the handle zone.
Cup & Handle base formation extending from Nov 2023 to Jul 2025
Mini VCP within handle, showing tight range contraction, signaling institutional accumulation.
Ascending trendline support holding firm, along with the 9 EMA.
Volume contraction during each pullback
A confirmed breakout above ₹378 with volume can trigger a strong upside continuation.
Volume has steadily contracted across the handle, especially during pullbacks
Current price is tightening just under the breakout zone — ideal for a low-risk entry
A decisive breakout on volume >150K will act as a confirmation trigger.
Fundamentals
Market Cap : ₹1,200 Cr (Small-cap room for growth)
P/E Ratio: ~20x Reasonable for specialty chemicals
EPS Growth: 24% YoY Consistent profit improvement
Revenue Growth: 15% YoY Stable.
ROE: ~12% Healthy return metrics
Operating Margin: ~9% Sustainable profitability
This setup reflects strong technical discipline with a clean, low-risk structure. Ideal for swing traders looking for breakouts backed by volume and volatility contraction. Watch closely for confirmation with volume.
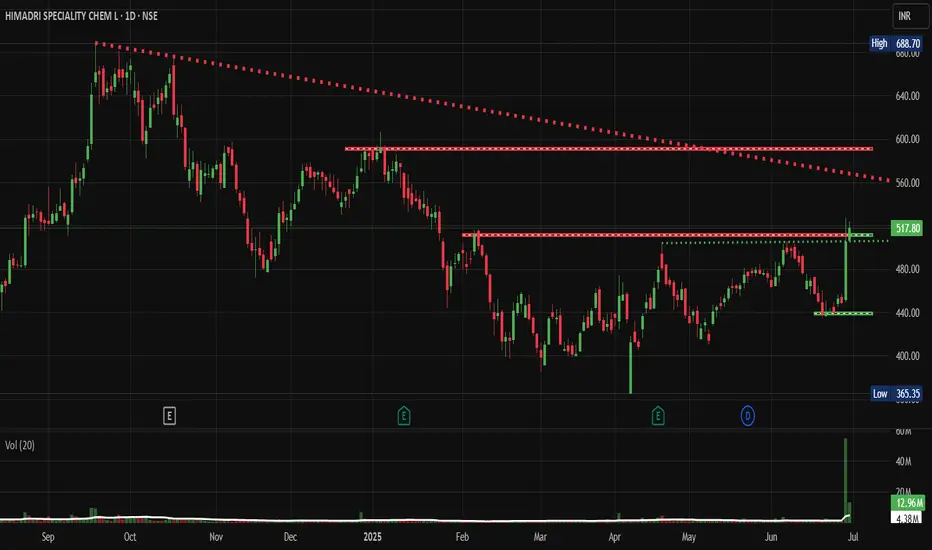
HSCL: A Classic Breakout Story in the MakingNSE:HSCL : A Classic Breakout Story in the Making
Price Action Analysis:
- Stock has formed a strong uptrend from September 2024 lows around 365 levels
- Current price of 517.80 represents a significant +41% move from the base
- Recent breakout above the 500 resistance level with strong volume confirmation
- Price action shows a classic accumulation pattern followed by a markup phase
Volume Spread Analysis:
- Significant volume spike visible in recent sessions (12.96M vs average 4.38M)
- Volume confirmation during breakout above 500 levels
- Accumulation pattern evident with higher volume on up days
- Volume trend supports the bullish price action
Base Formation & Key Levels:
- Primary Base: Formed between 400-520 levels from December 2024 to May 2025
- Secondary Base: 440-480 consolidation zone during March-April 2025
- Base Duration: Approximately 6 months of sideways consolidation
- Base Characteristics: Multiple retests of support levels with decreasing volatility
Key Support & Resistance Levels:
- Immediate Support: 480-500 zone (previous resistance turned support)
- Strong Support: 440-460 zone (multiple bounce levels)
- Major Support: 400 psychological level
- Immediate Resistance: 520-530 zone
- Next Resistance: 580-600 zone (measured move target)
- All-time High Resistance: 688.70
Technical Chart Patterns:
- Cup and Handle Pattern: Visible from October 2024 to June 2025
- Ascending Triangle: Formed during the consolidation phase
- Bullish Flag: Recent consolidation before the breakout
- Higher Highs and Higher Lows: Established uptrend structure
Trade Setup & Strategy:
Entry Strategy:
- Primary Entry: 515-520 on any pullback to the breakout zone
- Aggressive Entry: Current levels around 517-518
- Conservative Entry: Wait for retest of the 500 support level
- Scale-in Approach: 50% at 515, 30% at 505, 20% at 495
Exit Strategy:
- Target 1: 560-570 (Risk-Reward 1:2)
- Target 2: 600-620 (Risk-Reward 1:3)
- Target 3: 650-680 (Risk-Reward 1:4)
- Trailing Stop: Use 480 as a trailing stop once Target 1 is achieved
Risk Management:
- Stop Loss: 475-480 (below breakout support)
- Position Size: Maximum 2-3% of portfolio
- Risk per Trade: Not more than 1% of total capital
- Time Stop: Exit if no progress in 3-4 weeks
Position Sizing Guidelines:
- Conservative Investor: 1-1.5% portfolio allocation
- Moderate Risk: 2-2.5% portfolio allocation
- Aggressive Trader: 3-4% portfolio allocation (with tight stops)
- Swing Trading: 2% with wider stops at 460 levels
Fundamental & Sectoral Backdrop:
Company Overview:
- NSE:HSCL is a leading manufacturer of coal tar pitch and advanced carbon materials
- Key products include coal tar pitch, carbon black feedstock, and speciality carbons
- Strong presence in aluminium, graphite electrode, and speciality chemical sectors
Sectoral Dynamics:
- The speciality chemicals sector is showing strong growth momentum
- Increased demand from the aluminium and steel industries
- The government focus on Make in India and import substitution
- Rising demand for advanced materials in electric vehicles and renewable energy
Fundamental Catalysts:
- Capacity expansion plans and new product launches
- Strong demand from end-user industries
- Improved margin profile due to product mix optimization
- Debt reduction and improved financial metrics
- ESG initiatives and sustainable product development
Market Conditions:
- Overall market sentiment is positive for chemical stocks
- Sectoral rotation favours speciality chemicals
- Export opportunities in global markets
- Raw material cost stabilization supporting margins
Risk Factors:
Technical Risks:
- Failure to sustain above 500 levels could lead to a retest of the 440 support level
- High volatility is expected given the breakout nature
- Overbought conditions in the short term may cause profit booking
Fundamental Risks:
- Raw material price volatility (coal tar and petroleum products)
- Environmental regulations affecting production
- Competition from global players
- Economic slowdown affecting end-user demand
- Currency fluctuation impact on exports/imports
My Take:
My analysis suggests a positive technical setup with strong breakout potential, supported by favourable sectoral trends and improving fundamentals. However, proper risk management and position sizing remain crucial for successful execution.
Keep in the Watchlist.
NO RECO. For Buy/Sell.
📌Thank you for exploring my idea! I hope you found it valuable.
🙏FOLLOW for more
👍BOOST if you found it useful.
✍️COMMENT below with your views.
Meanwhile, check out my other stock ideas on the right side until this trade is activated. I would love your feedback.
Disclaimer: "I am not a SEBI REGISTERED RESEARCH ANALYST AND INVESTMENT ADVISER."
This analysis is intended solely for informational and educational purposes and should not be interpreted as financial advice. It is advisable to consult a qualified financial advisor or conduct thorough research before making investment decisions.
CreditAcess Grameen Standing near a crucial trendline support!Chart of Creditaccess is quite interesting.
Stock has a trendline support from which it has bounced multiple times in past.
Recently, stock has tried to bounce with very very very heavy volumes indicating big money getting exchange.
Given the history of the stock, we should at least expect 100% upside from this level. But it ccan also be a trap and stock can breakdown from here.
A safer level to watch is would be a weekly closing above 1110.
Support is 800 WCB for stock.
On upside, stock can go to 1480, 1710, 2000++
Very very risky. It can be a bottom fishing or a trap.
Idea shared for educational purposes only. We all should just watch what will happen from here and learn from it.

Bharat Forge | Rising from Demand Zone ⭕️ Swing Trading opportunity: Price Action Analysis Alert !!!⭕️
💡FNO Stocks Trading📉📈📊
✅Check out my TradingView profile to see how we analyze charts and execute trades.
✅We can't conduct a thorough analysis in such a short span of time. We need to review it, post our findings, and then take action.
🙋♀️🙋♂️If you have any questions about this stock, feel free to reach out to me.
📍📌Thank you for exploring our idea! We hope you found it valuable.
🙏FLLOW for more !
👍LIKE if useful !
✍️COMMENT Below your view !

Hindware-Looking strong for a big uptrend!Hindware has formed a double bottom pattern at a very strong support trendline and has given breakout of the neckline.
If Q4 results are better then expected, we can see a good trending bullish move in the stock.
Keep in watchlist. A relatively Safe trade as big targets can be expected.

GNFC - Bullish Swing Reversal with VolumesNSE: GNFC is closing with a bullish swing reversal candle supported with volumes.
Today's volumes and candlestick formation indicates strong demand and stock should move to previous swing highs in the coming days.
The stock has been moving along the horizontal and trendline support for the past few days which is indicating demand.
One can look for a 13% to 20% gain on deployed capital in this swing trade.
The view is to be discarded in the event of the stock breaking previous swing low.
#NSEindia #Trading #StockMarketindia #Tradingview #SwingTrade

NIFTY ELLIOTT WAVE ANALYSISNSE:NIFTY
Retraced towards sub wave 4 low as per #Elliottwave
Wedge formation with RSI Positive Divergence.
Near Support zone . Breakout of 1 year consolidation.
And Uptrend Line.
With Market Mood in Fear.
High chance we are nearing end of Correction in wave 2.

SPARC | Ascending Triangle | Positional Buy for 20%NSE:SPARC
Moving up in Ascending Triangle Pattern, with price getting support from rising Trendline
Price bouncing from EMAs
CMP : 250
Target : 300
Upside : 20%
SL : 230
RSI is trending up & now in Bullish zone.

BEL - Bullish Volume BreakoutNSE: BEL is closing with a strong bullish candle supported with high volumes.
Today's volumes and candlestick formation indicates strong demand and stock should move to previous swing highs in the coming days.
The stock has been consolidating for the past few days and moving along the trendline which is indicating demand.
One can look for a 8% to 12% gain on deployed capital in this swing trade.
The view is to be discarded in the event of the stock breaking previous swing low.
#NSEindia #Trading #StockMarketindia #Tradingview #SwingTrade
Disclaimer:
This is for educational purposes only.

HCL Technologies Ltd - Trendline Support + Just a View📊 Script: HCLTECH (HCL TECHNOLOGIES LIMITED)
📊 Nifty50 Stock: YES
📊 Sectoral Index: NIFTY IT / NIFTY 500
📊 Sector: Information Technology
📊 Industry: Computers - Software & Consulting
Key highlights: 💡⚡
📈 Script is trading near at its support level which is around 897.
📈 RSI is nearby to its Oversold zone.
📈 script may bounce back from its support level keep an eye on it.
📈 Fundamentals are also strong, one can buy on dips for long term.
📈 if it start moving upward first target will be 990 , Always maintain your Risk & Reward Ratio.
⏱️ C.M.P 📑💰- 895
🟢 Target 🎯🏆 - 990
⚠️ Important: Always maintain your Risk & Reward Ratio.
⚠️ Purely technical based pick.
✅Like and follow to never miss a new idea!✅
Disclaimer: I am not SEBI Registered Advisor. My posts are purely for training and educational purposes.
Eat🍜 Sleep😴 TradingView📈 Repeat🔁
Happy learning with trading. Cheers!🥂
Happy Navaratri 🕉️ 💃🏻🕺🏻

Trendline Trading: Raymond LtdIn NSE:RAYMOND it is a bullish trendline and 6 times the trendline has played an important role of Support and Resistance.

trendline Trading: SudarshanNSE:SUDARSCHEM is again taking the support at the monthly timeframe trendline.

Prestige on Bullish This script traded under the channel pattern and takes the support at Weekly trend line as well as channel support line.Target is the resistance of the channel pattern and stoploss is below the channel pattern support line weekly close.
DISCLAIMER:
I am not a SEBI registered person this is not an investment tips it's just for an educational purpose. So don't take any trade blindly based on this analysis discuss with your financial advisor before taking any trade. I am not responsible for your profit or loss.

Glenmark looks to go upGlenmark looks like taken perfect support at the downtrend channel line. Can be taken long for targets of 409, 429 and 439

Asian Paints : Swing tradeAsian Paints taking support at trend line perfect candidate for swing trade.
Good upside possible
keep eyes.


Buy Nifty for 17900 -18000
Buy Nifty at Double Support Zone... Trend line Support & Nifty at Previews Support area..
Buy Nifty for 17892-18030 & after trend line breakout 18327
LONG Trendnline Support from 23th March 2020-- This Entire Trend Starting Point... (See My Next Image)
If Trade Below this trendline for atlest week.. We will Enter in New Bearish Trend..

CEAT LTD TRADE SETUP FOR TOMORROWSo as you see in the chart, there is a strong resistance at the level of 1399,
.
And stock is following thr trendline now, so if the goes above 1399,
.
We can buy this trade for target of 1435, if stock break the trendline in a down side.
.
We will totally ignore this trade.
.
What's your view comment below in the box.

QUICK AND DILIGENT ANALYSIS ON BERGER PAINTS !!!Notable points:
1.Stock is taking support at major weekly trendline support area, also same zone is a previous resistance which turned into support now.
2.The stock is at 50% fibo support and seeing some buying interest with formation long lower wick candle at the support.
3.The stock is almost bottomed out in RSI , thus can expect a bounce from this area.
4.The stock was in a decent uptrend and did a long consolidation therefore probability of bounce from major weekly trendline support is high.
Short Term View : Bullish
Timeframe used : Daily
Target : 830-870
Takeaway : Can enter at or near by the current trendline support.
Disclaimer : This idea was to just give you an insight about my own view and personal observations. Please do your own research or consult an investment advisor before doing any investment or trading.

Zeel Possible Trendline supportThe stock can take support at the trendline support wait for a reversal pattern and then take the entry
we try to look buy for the upcoming week
Disclaimer: Please consult your financial advisor,
Investment/Trading in the securities market is subject to market risk, We are not responsible for your profit or loss
