BUY TODAY SELL TOMORROW for 5%DON’T HAVE TIME TO MANAGE YOUR TRADES?
- Take BTST trades at 3:25 pm every day
- Try to exit by taking 4-7% profit of each trade
- SL can also be maintained as closing below the low of the breakout candle
Now, why do I prefer BTST over swing trades? The primary reason is that I have observed that 90% of the stocks give most of the movement in just 1-2 days and the rest of the time they either consolidate or fall
Trendline Breakout in KRN
BUY TODAY SELL TOMORROW for 5%
Trendlinetrading

Bitcoin – Buying the Trendline, Not the HypeBitcoin (BTCUSD) continues to respect its rising trendline structure , showing consistent demand on every retest. This type of price action often reveals where smart money is quietly adding positions, not chasing, but accumulating near support.
Each of the highlighted points shows how price has respected this trendline multiple times, forming a clean series of higher lows. As long as this level holds, the broader direction remains bullish.
Currently, BTC is testing this key support once again. I’m positioning near the trendline because the risk is clearly defined , and the potential reward toward 111K+ remains wide open.
Short-term volatility can still appear, but structure beats emotions . As long as buyers defend this zone, we may see another impulsive leg forming soon.
Disclaimer: This analysis is for educational purposes only. It’s not investment advice. Always do your own research before trading.

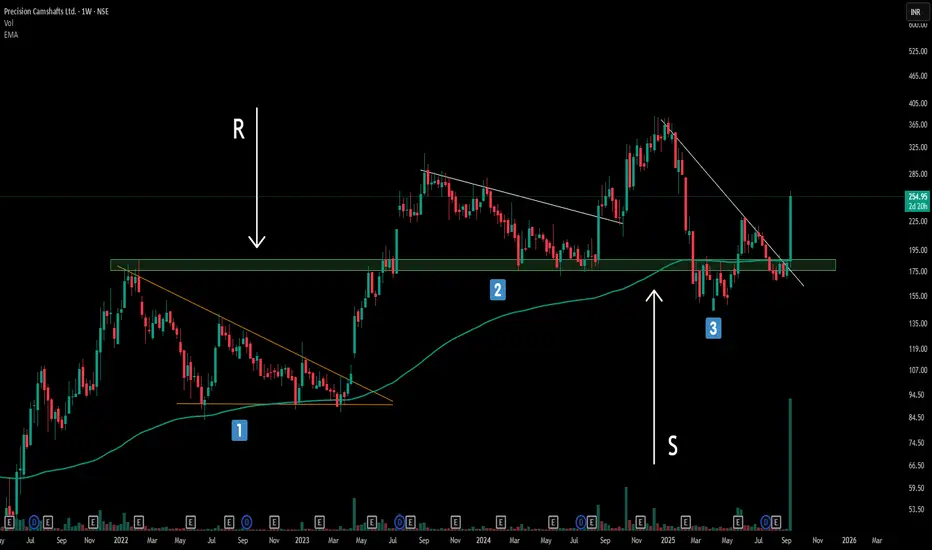
The Power of Trendline Angles : My Full time trading ExperienceBreaking Down Three Critical Trendline Structures - A Complete Analysis
Structure 1: The Power of Steep Angles (Primary Focus)
The first structure showcases what I consider the gold standard of trendline breakouts. Notice how the trendline is significantly tilted/slanted rather than following a gradual 45-degree angle.
Compressed Energy Release: Steep trendlines act like coiled springs, storing tremendous buying/selling pressure that explodes upon breakout
Key Observation: The resistance level (marked as 'R') held price down multiple times before the decisive breakout. Once broken, this level immediately flipped to become strong support (marked as 'S')—a textbook example of polarity flip dynamics.
Structure 2 & 3: Valid but Secondary Setups
While structures 2 and 3 represent legitimate continuation-based trendline breakouts, they pale in comparison to the explosive potential of Structure 1. However, they still qualify as CT (Continuation Trend) based breakout structures and shouldn't be ignored entirely
Remember: Not every trendline break deserves your attention. Focus on steep angles, exceptional volume, and clear flip confirmations for the highest probability setups. The market rewards patience and precision over frequency.
Disclaimer: Trading involves significant risk and is not suitable for all investors. Past performance does not guarantee future results. Always conduct your own research, consider seeking advice from a qualified financial advisor, and trade only with capital you can afford to lose.
SAKSOFT - Horizontal Trendline Breakout🔊 SAKSOFT - Horizontal Trendline Breakout
⌛Duration - Short Term (1 Week to 4 Week)
📊📈 Trade Logic - Horizontal Trendline Breakout with Huge Volume
CMP - ₹321.75
Time Frame - Daily
🎯Target 1 : ₹350
🎯Target 2 : ₹360
🎯Target 3 : ₹380
🛑 Stop : ₹300
🏆 Risk/Reward Ratio (1: 2.5)
Disclaimer: The stock information shared above is not a recommendation to buy, sell, or hold. It reflects my own analysis and is intended solely for educational purposes. Any actions you take based on this information are your responsibility, and the admin of this channel is not liable for any financial gains or losses. Please consult a financial advisor before making any investment decisions. I am not a SEBI-registered advisor.

BTC can be follow some short move BTC can be follow some short move
TimeFrame - 5 min
This is the Best Example of Trendline Breakdown Trades.
BTC has broken a 5 min trendline near 66338 level and is following its short momentum till,
TARGET - 64750
Which is around 1575 points from Breakdown Level

📌 Khadim : Flag Pattern (Breakout candidate)#khadim #momentumtrade #swingtrade #breakoutcandidate #flagpattern
📌 Khadim : Flag Pattern (Breakout candidate)
Swing Trade / Short term(1-3 months)
>> Price & Volume Contraction visible on charts
>> Good strength in stock
>> Low Risk High Reward Trade
Swing Traders can book Profits at 10% either partially or full or keep trailing along with short term traders
Please Like or comment if u r Liking the analysis & Learning from it. Keep showing ur Love
Disclaimer : This is not a Trade Recommendations & Charts/ stocks Mentioned are for Learning/Educational Purpose. Do your Own Analysis before Taking positions.

intraday, swing, short term; min 70% returnswait for conformation and retracement
and go futher
refer our old idea attached below
midcap stocks are going to boom.
long term investment; min 70% return
huge potential is there.
investment ;
if you are intrested in investmet, go for it with small risk,
more possibility is there for breakout.
.
.
.
. more than that " Jindal " group is fundamentally good.

ARIES : Trendline Breakout Momentum Trade#Aries : Momentum Trade
>> Clearly a Trendline Breakout and can continue the momentum
>> Currently Low Volumes but Volumes can spike any day and can give good Volatile move
>> Take 10% and Keep Trailling
Like , Follow & share for more such Analysis.
Keep Learning & Keep Growing.

Vedanta in trendstock consistently supporting trendline and now forming a clean triangular pattern. breakout will help to achieve targets.

TATAELXI testing the trendline (LONG)TATAELXSI is testing the trendline in DAY TIME FRAME....we can go LONG.. keep stoploss at ₹6410 and target is upto u (my suggestion is keep atleast 1:1)..

Indian Bank : Trend line BreakoutTrend line Breakout in Indian Bank
Good Accumulation in Last 4 days (volume)
Rsi looks Strong

Prince Pipes : Trend Line BreakoutA beautiful Trend line Breakout visible on Charts with a total possible upside move of 24%.
Volumes Rising & Good strength in stock
Swing Traders Can Book profits at 5/10% rest can keep trailing.

Trade Using Multiple Trend Lines
Important Note:- Very complex and professional techniques I have discussed in the below texts. So my friends read this minimum 3 times, otherwise you will not get the inside what I'm saying about.
See how a professional trader using multiple trend lines in a chart and find out opportunities.
1. Here you can see two old trendlines are there and two new trend lines i.e. support & resistance line.
2. Price has been take support and resistance in different different position of the chart and if we join them then we can see a different trend channel in different angle along with previous one.
3. Trend channel already change few months ago i.e. new support line and new resistance line.
4. Now break in the upside direction.
5. So we can take position on direction of the breakout.
But my friends there is something more in this story,
Actually we can't recognize multiple support and resistance in same direction , that's why we can't draw trend lines there. Reality is there is the difference, between professionals and intermediate or beginners.
We have to look into the chart in different way all the time then you can see the chart differently or in professional way. In this chart the price already break the old resistance line and now it's break the new resistance line with big bullish candle. Also previous support and resistance line nothing but a symmetrical triangle pattern.
By using multiple trend lines you can see the different opportunity in different position of the chart and you have to choose the correct one which have highest provability to move the price in your way.
I know this concept is little bit complex but if you download this in your mind, in near future you will get the taste of success.

Buying Pullback -at Trendline SupportEntry 430
Stop-loss 409
Target 530
Risk/Reward 1:5
Axis bank trading at trendline support. Intermediate and short term trends are up. This pullback is an excellent opportunity to go long because of a very favourable risk to reward ratio.
Don't invest more than 5% of your total capital into a single stock.
