GOLD (XAUUSD) 4H Analysis – Breakout Imminent from Rising Wedge!Gold is currently trading at 3353.39 after completing a well-defined ABCDE rising wedge structure on the 4H chart. The market is showing signs of exhaustion near the 3353–3373 resistance zone, with a potential bearish rejection likely to follow.
🔍 Key Highlights:
Pattern: Rising Wedge (ABCDE complete) – a classic bearish reversal setup.
Sell Zone: 3353.88 to 3371.62 – Expect high volatility and sharp rejection.
Target: 3296.36 – Marked as the first major support zone.
Risk Management: Strong R:R setup with invalidation above 3373.93.
Heikin Ashi candles show weakening bullish momentum near the top.
📉 What to Watch: If price confirms rejection below 3353 with bearish pressure, a sharp fall toward the 3296 level could follow. Breakout traders and swing traders should stay alert – this could be a textbook move.
📌 Professional Insight: This setup is not just a pattern – it's a psychological battlefield between bulls pushing exhaustion and bears waiting to strike. The next few candles could define the mid-term gold trend.
🚨 Don’t miss this potential opportunity. Mark your levels. Stay disciplined.
#GoldAnalysis #XAUUSD #ForexTrading #SwingTrade #TechnicalAnalysis #HeikinAshi #BreakoutSetup #SmartTrading #RiskReward #TradingEdge
Triangle

Solana Long-Term Cup & Handle | +300% Potential🔍 #OnRadar | #Crypto
#SOLUSD (#Solana)
Solana Long-Term Cup & Handle | +300% Potential
CMP: $174
Support Zone: $123.00 – $100.00
Pattern Invalidation Level: $95 (MCB - Monthly Closing Basis)
📊 Technical Overview:
Solana (SOLUSD) is showing signs of a long-term Cup & Handle pattern forming on the higher timeframes.
☕️ Cup formation appears complete.
📐 Handle is likely developing within an Ascending Triangle .
🔄 Neckline Resistance: ~$305
🎯 Potential Target on Breakout: ~$560
🚀 Upside Potential: Approx. +300% from CMP
While it's early to confirm a breakout, this structure is worth keeping on the radar for long-term trend traders and pattern watchers.
⚠️ Disclaimer:
This is a technical analysis observation shared for educational purposes only.
Not a buy/sell recommendation.
Please do your own research ( #DYOR ) and consult your financial advisor before making any investment decisions.
#Crypto | #Solana | #SOL | #TechnicalAnalysis | #ChartPatterns | #CupAndHandle | #AscendingTriangle | #LongTermView

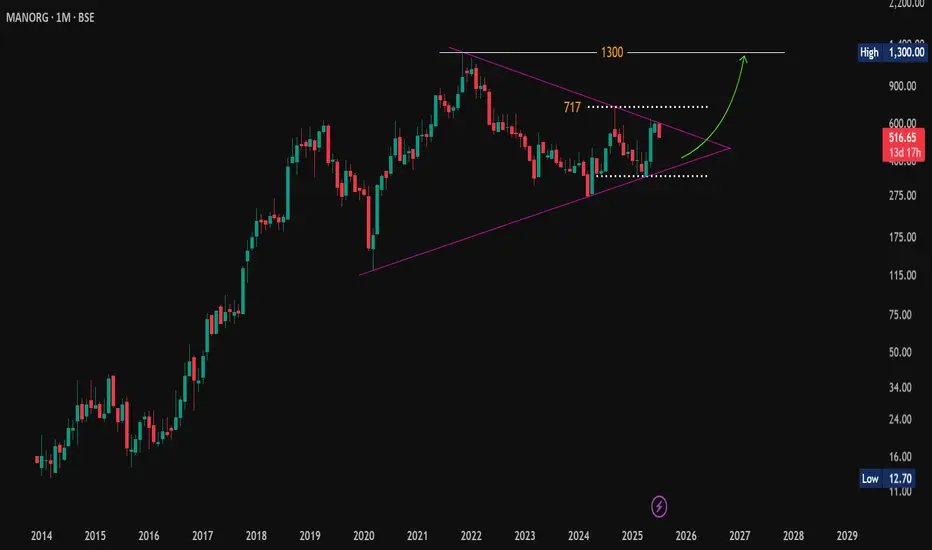
ManOrg: Symmetrical Triangle Tightens – Big Move Ahead?🔎 #OnRadar
#ManOrg (Mangalam Organics Ltd.)
Symmetrical Triangle Tightens – Big Move Ahead?
CMP: 516.65
📈 Technical Outlook (Monthly Chart | For Educational Purpose Only):
#SymmetricalTriangle pattern appears to be forming on the monthly timeframe.
The price has faced repeated resistance near the falling trendline around 629 and is currently showing signs of a possible retracement towards the lower end of the triangle. The key support zone lies between 473–378 .
If this zone holds, price may attempt another move up toward the falling trendline resistance. A monthly close above the trendline could indicate a potential breakout from this long-term structure. If sustained, the stock may gradually head toward its all-time high zone near 1,300 .
⚠️ Disclaimer: This post is shared only for educational purposes. It is not a buy/sell recommendation. Please consult a financial advisor before making any investment decisions.
#TechnicalAnalysis | #SymmetricalTriangle | #ChartPatterns | #PriceAction | #LongTerm
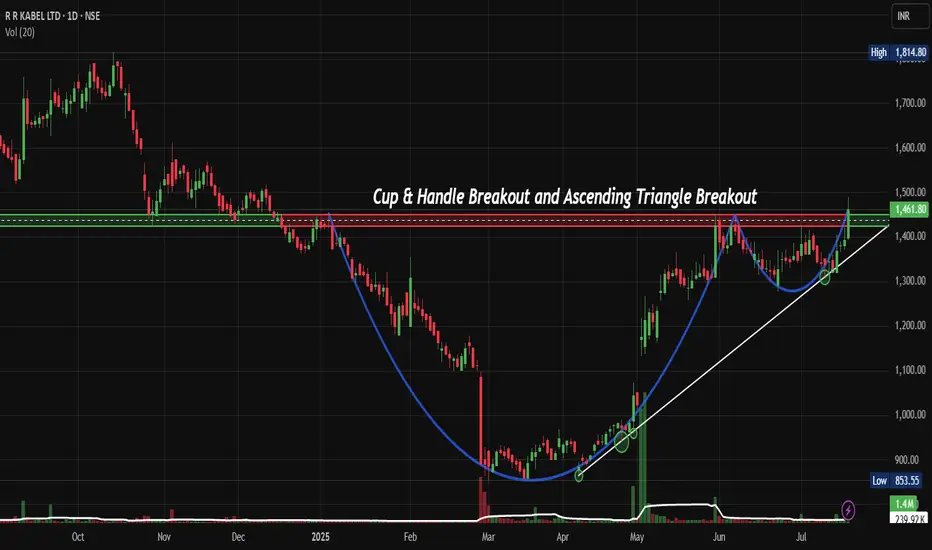
RRKABEL: Cup & Handle Pattern Could Trigger 30% Upside RallyNSE:RRKABEL Perfect Storm: How Cup & Handle Pattern Could Trigger 30% Upside Rally
Price Action Analysis:
Candlestick Patterns:
- Doji Formation: Multiple doji candles during handle formation indicate indecision and potential reversal
- Bullish Engulfing: Strong bullish engulfing pattern on breakout day, showing buying pressure
- Higher Highs/Lows: Clear pattern of higher highs and higher lows post-breakout
- Rejection Candles: Long lower wicks during handle formation show buying support
Price Structure:
- Swing: Clear swing low at ₹853 (March 2025) and swing high at ₹1,850 (previous year)
- Impulse Waves: Strong impulsive moves during the breakout phase indicate institutional participation
- Corrective Waves: Orderly corrective structure during cup and handle formation
- Price Momentum: Accelerating price momentum post-breakout with minimal pullbacks
Market Structure:
- Trend: Transition from downtrend to sideways consolidation to uptrend
- Support Respect: Multiple tests of support levels without breakdown showing strength
- Resistance Breaks: Clean break above multiple resistance levels with conviction
- Price Velocity: Increasing price velocity on breakout indicates strong momentum
Intraday Price Action:
- Opening Gaps: Positive opening gaps during the breakout phase show overnight interest
- Closing Strength: Consistent closing in the upper portion of the daily range
- Pullback Behaviour: Shallow pullbacks with quick recoveries indicate a strong underlying bid
- Volume-Price Sync: Price advances accompanied by volume expansion
Volume Spread Analysis:
Volume Patterns:
- Base Formation: Declining volume during cup formation indicates a lack of selling pressure
- Handle Volume: Minimal volume during handle formation, showing controlled supply
- Breakout Volume: Significant volume spike on breakout confirming institutional participation
- Volume Trend: Above-average volume sustaining post-breakout
Volume Indicators:
- Accumulation Phase: Volume patterns suggest institutional accumulation during the base
- Breakout Confirmation: 2-3x average volume on breakout day
- Follow-through: Consistent volume support in subsequent sessions
- Volume Price Analysis: Positive volume-price correlation during upward movement
Technical Patterns:
Primary Pattern: Cup & Handle Formation
- Cup Formation: The stock formed a classical cup pattern from Jan 2025 to March 2025, with the left rim at approximately ₹1,420 levels
- Handle Formation: A clean handle pattern developed from May to July 2025, showing controlled consolidation with diminishing volume
- Breakout Confirmation: Strong breakout above ₹1,420 resistance with increased volume, signalling pattern completion
- Pattern Reliability: The 6-month cup formation provides a strong technical foundation for sustained upward momentum
Secondary Pattern: Ascending Triangle
- Formation Period: June to July 2025 within the handle structure
- Resistance Level: Horizontal resistance at ₹1,420 tested multiple times
- Support Trend: Rising support line indicating accumulation phase
- Breakout: Clean breakout above triangle resistance with volume expansion
Support & Resistance Levels:
Key Support Levels:
- Immediate Support: ₹1,350 (breakout pullback level)
- Secondary Support: ₹1,280 (handle low)
- Major Support: ₹1,200 (psychological level and previous resistance)
- Critical Support: ₹1,080 (cup base level)
Key Resistance Levels:
- Immediate Resistance: ₹1,500 (psychological level)
- Target Resistance: ₹1,650 (cup depth projection)
- Extended Target: ₹1,800 (previous swing high)
- Long-term Resistance: ₹1,850 (52-week high)
Base Analysis:
Base Characteristics:
- Base Type: Cup with handle base formation
- Duration: 7 months (Jan 2025 to July 2025)
- Depth: Approximately 35% correction from highs
- Volume Pattern: Declining volume during base formation, expanding on breakout
- Base Quality: High-quality base with proper structure and time frame
Base Strength Indicators:
- Volatility Contraction: Price volatility decreased during handle formation
- Volume Dry-up: Minimal selling pressure during consolidation
- Support Holding: Multiple tests of support levels without breakdown
- Institutional Activity: Likely accumulation phase based on volume patterns
Trade Setup:
Entry Strategy:
- Primary Entry: ₹1,420-1,430 (on breakout confirmation)
- Secondary Entry: ₹1,380-1,400 (on pullback to breakout level)
- Aggressive Entry: ₹1,350-1,360 (deeper pullback support)
Entry Confirmation Signals:
- Volume Expansion: Minimum 1.5x average volume on entry
- Price Action: Close above ₹1,420 for two consecutive sessions
- Momentum: RSI above 50 and trending upward
- Moving Averages: Price above 20 and 50-day moving averages
Exit Levels:
Profit Targets:
- Target 1: ₹1,500 (5.5% upside) - Psychological resistance
- Target 2: ₹1,650 (16% upside) - Cup depth projection
- Target 3: ₹1,800 (27% upside) - Previous swing high
- Extended Target: ₹1,850 (30% upside) - 52-week high
Exit Strategy:
- Partial Profit: Book 25% at Target 1
- Scale Out: 50% at Target 2
- Trailing Stop: Implement 8-10% trailing stop after Target 2
- Final Exit: Complete exit at Target 3 or on stop-loss trigger
Stop-Loss Strategy:
Stop-Loss Levels:
- Conservative: ₹1,320 (7% below entry)
- Moderate: ₹1,280 (10% below entry)
- Aggressive: ₹1,250 (12% below entry)
Stop-Loss Management:
- Initial Stop: Below handle low at ₹1,280
- Trailing Stop: Move to breakeven after 5% profit
- Progressive Stops: Raise stops with each target achievement
- Time Stop: Exit if no progress within 4-6 weeks
Position Sizing:
Risk-Based Sizing:
- Conservative Approach: 1-2% of portfolio risk
- Moderate Approach: 2-3% of portfolio risk
- Aggressive Approach: 3-5% of portfolio risk
Position Calculation:
- Risk Per Share: Entry price minus stop-loss level
- Position Size: (Portfolio Risk Amount) / (Risk Per Share)
- Example: For ₹1,400 entry with ₹1,280 stop, risk = ₹120 per share
- Capital Allocation: Maximum 5-8% of total portfolio in a single position
Risk Management:
Risk Control Measures:
- Position Sizing: Limit individual position to 5% of portfolio
- Stop-Loss Discipline: Strict adherence to predetermined stop levels
- Diversification: Maintain exposure across multiple sectors
- Correlation Risk: Avoid concentration in similar cable stocks
Risk Monitoring:
- Daily Monitoring: Track volume, price action, and sector performance
- Weekly Review: Assess progress toward targets and adjust stops
- News Monitoring: Stay updated on company and sector developments
- Market Correlation: Monitor broader market conditions
Sectoral Backdrop:
Indian Cable Industry Outlook:
- Market Growth: The market is projected to grow from USD 10.01 billion in 2025 to USD 17.08 billion by 2032, exhibiting a CAGR of 7.94% during the forecast period
- Infrastructure Push: India's National Grid capacity is expanding continuously under the PM Gati Shakti National Master Plan, which is expected to add around 26,988 circuit km capacity by 2024-2025
- Renewable Energy: India has observed a substantial rise in the demand for wires and cables due to the country's ambitious renewable energy goals
Growth Drivers:
- Smart Cities: The development of smart cities in the country, along with the increase in electronic devices in the household, would increase the demand
- Government Investment: India Wires and Cables Market would grow on the back of rapidly growing investment by the government towards the development of infrastructural projects
- Electrification: Growing electricity demand is driving transmission and distribution network expansion
Fundamental Backdrop:
Company Profile:
- Market Position: RR Kabel is now the 4th largest W&C Company in India by value.
- Global Presence: With a global presence spanning over 67 countries, this electrical company has established a strong international footprint
- Financial Performance: Revenue: 7,618 Cr · Profit: 312 Cr
Financial Metrics:
- Market Cap: Mkt Cap: 16,529 Crore (down -17.5% in 1 year)
- Valuation: Stock is trading at 7.68 times its book value
- Promoter Holding: Promoter Holding: 61.8%
- 52-Week Range: The 52-week high is ₹1825 and the 52-week low is ₹750
Investment Considerations:
- Sector Tailwinds: Strong sectoral growth prospects with government infrastructure push
- Market Leadership: Established position as the 4th largest cable company in India
- International Exposure: Diversified revenue streams from 67 countries
- Valuation Concerns: Recent 22.8% decline in market cap may indicate value opportunity
My Take:
The technical setup for NSE:RRKABEL presents a compelling opportunity with the successful completion of a cup and handle pattern. The 8-month base formation, combined with strong sectoral tailwinds and the company's market leadership position, creates a favourable risk-reward scenario. The breakout above ₹1,420 with volume confirmation suggests institutional participation and potential for sustained upward momentum toward the ₹1,650-1,800 target range.
Key success factors include strict adherence to stop-loss levels, proper position sizing, and monitoring of broader market conditions. The sectoral growth prospects, driven by infrastructure development and renewable energy initiatives, provide fundamental support for the technical breakout.
Keep in the Watchlist and DOYR.
NO RECO. For Buy/Sell.
📌Thank you for exploring my idea! I hope you found it valuable.
🙏FOLLOW for more
👍BOOST if you found it useful.
✍️COMMENT below with your views.
Meanwhile, check out my other stock ideas on the right side until this trade is activated. I would love your feedback.
Disclaimer: "I am not a SEBI REGISTERED RESEARCH ANALYST AND INVESTMENT ADVISER."
This analysis is intended solely for informational and educational purposes and should not be interpreted as financial advice. It is advisable to consult a qualified financial advisor or conduct thorough research before making investment decisions.
KIRLPNU: Technical Breakout Attempt That Could Deliver 25% ReturNSE:KIRLPNU : A Technical Breakout Attempt That Could Deliver 25% Returns
Price Action Analysis:
- Current Price: Rs 1,511.20
- Day's High: Rs 1,817.00
- Day's Low: Rs 953.00
- Volume: 152.69K shares
Volume Spread Analysis:
Volume Profile:
- Significant volume spike during recent breakout attempt
- Volume during consolidation was relatively lower
- Current volume suggests institutional buying
- Volume trend supports price movement authenticity
Volume Indicators:
- Volume surge above 20-day average confirms breakout attempt
- Price-volume divergence absent, indicating a healthy move
- The accumulation phase is visible in the volume profile during base formation
Key Technical Observations:
- The stock has shown a strong upward momentum with a significant gap-up movement
- Price has moved from the consolidation zone around Rs 1,350-1,400 to the current levels
- Strong volume surge indicating institutional participation
- Daily candlestick pattern shows bullish momentum with long green candles
Technical Levels & Pattern Analysis:
Support Levels:
- Immediate Support: Rs 1,350-1,380 (previous resistance turned support)
- Strong Support: Rs 1,250-1,300 (multiple touch points)
- Major Support: Rs 1,100-1,150 (significant accumulation zone)
Resistance Levels:
- Immediate Resistance: Rs 1,550-1,580 (red horizontal line marked on chart)
- Next Resistance: Rs 1,650-1,700 (psychological level)
- Major Resistance: Rs 1,800-1,850 (day's high region)
Base Formation:
- Multi-month base formation visible from December 2024 to June 2025
- Consolidation range: Rs 1,100 to Rs 1,400
- Base breakout occurred around Rs 1,380-1,400 levels
- Volume expansion during breakout confirms strength
Technical Patterns:
- Cup and Handle pattern completion with breakout attempt
- Ascending triangle formation during the consolidation phase
- Bullish flag pattern on shorter timeframes
- Higher highs and higher lows trend intact
Trade Setup:
Entry Strategy:
- Primary Entry: Rs 1,480-1,520 (current market price on dips)
- Secondary Entry: Rs 1,350-1,380 (on pullback to support)
- Aggressive Entry: Rs 1,540-1,560 (breakout continuation)
Target Levels:
- Target 1: Rs 1,650-1,700 (8-12% upside)
- Target 2: Rs 1,800-1,850 (18-22% upside)
- Target 3: Rs 1,950-2,000 (25-30% upside)
Stop Loss Levels:
- Conservative Stop Loss: Rs 1,320 (below major support)
- Aggressive Stop Loss: Rs 1,420 (below immediate support)
- Trailing Stop Loss: Rs 1,480 (after first target achievement)
Risk Management:
Position Sizing:
- Conservative traders: 2-3% of portfolio
- Moderate traders: 4-5% of portfolio
- Aggressive traders: 6-8% of portfolio
- Risk per trade should not exceed 1-2% of total capital
Risk Assessment:
- Risk-Reward Ratio: 1:2 to 1:3 (favorable)
- Maximum drawdown potential: 12-15%
- Probability of success: 65-70% based on technical setup
Money Management Rules:
- Never risk more than 2% of capital per trade
- Use position sizing based on stop loss distance
- Maintain diversification across sectors
- Book partial profits at predetermined levels
Sectoral Backdrop:
Industry Overview:
- NSE:KIRLPNU is engaged in the manufacturing and service of engineering goods, operating through the Compression Systems Segment, comprising air and gas compressors, air-conditioning and refrigeration
- Industrial air compressor market to grow at 8.2% CAGR (2023-2033) with market share to reach US$6.86 Billion by 2033
Market Dynamics:
- India Air Compressor Market is forecast to reach $995 million by 2030, after growing at a CAGR of 5.2% during 2024-2030
- Manufacturing is expected to contribute 39.1% share of the market in 2025, as the industry relies heavily on compressed air for pneumatic tools
Growth Drivers:
- Increasing industrialization and infrastructure development
- Rising demand from the manufacturing and automotive sectors
- Energy-efficient compressor adoption
- Government initiatives supporting industrial growth
Fundamental Backdrop:
Financial Performance:
- Market Cap: 9,797 Crore with Revenue of 1,629 Cr and Profit of 211 Cr
- Revenue: ₹583Cr as on March 2025 (Q4 FY25) with Net Profit: ₹81Cr
- Annual revenue growth of 23% is outstanding, Pre-tax margin of 17% is great, ROE of 21.1% is exceptional, ROCE of 28.3% is also exceptional
Key Metrics:
- The stock is trading at 8.95 times its book value
- The company is debt-free and has a strong balance sheet, enabling stable earnings growth
- Promoter holding has decreased over the last 3 years: -14.8% with current Promoter Holding: 38.85%
Analyst Outlook:
- Recent research reports show an average share price target of 1784
- Strong financial metrics support technical breakout
- Debt-free status provides financial flexibility
- Consistent profitability across business cycles
Investment Thesis Summary:
Bullish Factors:
- Strong technical breakout attempt with volume confirmation
- Robust financial performance with 23.14% revenue growth
- Favourable industry growth prospects
- Debt-free balance sheet providing stability
Risk Factors:
- General market volatility
- Sector-specific cyclical risks
- Global economic uncertainties
- Promoter holding reduction trend
My Take:
NSE:KIRLPNU presents a compelling technical setup with strong fundamental backing. The recent breakout attempt from multi-month consolidation, supported by volume surge and positive sector outlook, creates an attractive risk-reward opportunity for medium-term investors. The company's strong financial metrics and debt-free status add confidence to the technical setup.
Keep in the Watchlist.
NO RECO. For Buy/Sell.
📌Thank you for exploring my idea! I hope you found it valuable.
🙏FOLLOW for more
👍BOOST if you found it useful.
✍️COMMENT below with your views.
Meanwhile, check out my other stock ideas on the right side until this trade is activated. I would love your feedback.
Disclaimer: "I am not a SEBI REGISTERED RESEARCH ANALYST AND INVESTMENT ADVISER."
This analysis is intended solely for informational and educational purposes and should not be interpreted as financial advice. It is advisable to consult a qualified financial advisor or conduct thorough research before making investment decisions.

Massive Symmetrical Triangle on Kakatiya Cement – Eyes on 599?🔎 #OnRadar
#Kakatcem (Kakatiya Cement Sugar & Industries Ltd.)
CMP: 166.40
📈 Technical Outlook (Monthly Chart | For Educational Purpose Only):
A #SymmetricalTriangle pattern appears to be forming on the monthly timeframe.
📌 Price took support near the rising trendline (~130) and is now showing signs of recovery. If momentum sustains, the stock may head toward the falling trendline resistance of the triangle.
A monthly close above the falling trendline could indicate a potential breakout from this long-term pattern — which, if successful, may open up room for a move towards its all-time high zone around 599 .
⚠️ Disclaimer: This post is shared only for educational and observational purposes. It is not a buy/sell recommendation. Please consult a financial advisor before making any investment decisions.
#TechnicalAnalysis | #SymmetricalTriangle | #ChartPatterns | #PriceAction | #LongTerm

SBIN ASCENDING TRIANGLE BREAKOUTSBI breaking ascending triangle pattern
with huge volume bullish rsi
breaking 835 will give more upside
#target 870-912
NO BUY/SELL RECOMENDATION

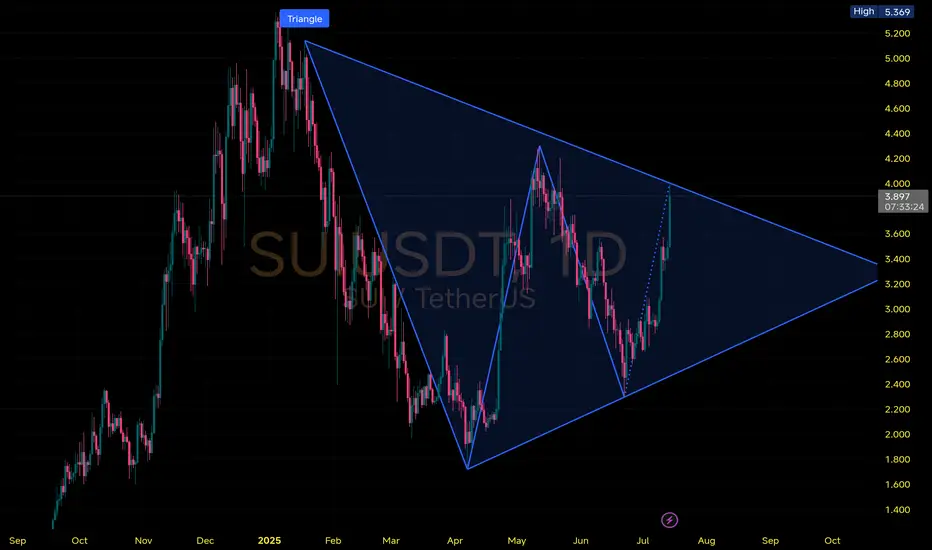
$SUI Daily Chart Analysis
Price is tightening within a large symmetrical triangle pattern on the 1D chart, signaling a major move brewing in the coming weeks.
🔹Price currently pushing toward upper trendline resistance near $4.00
🔸Upside Potential: Break above $4.20 could trigger a rally toward $5.00–$5.30+
🔹Pattern target (if breakout confirmed): roughly $6.00+ based on pole height
🔸Support at $3.20 is key triangle base
🔹Breakdown below = bearish continuation risk toward $2.50
#SUI is coiling within a triangle. A breakout is imminent — watch closely for a decisive move above or below structure.
BINANCE:SUIUSDT
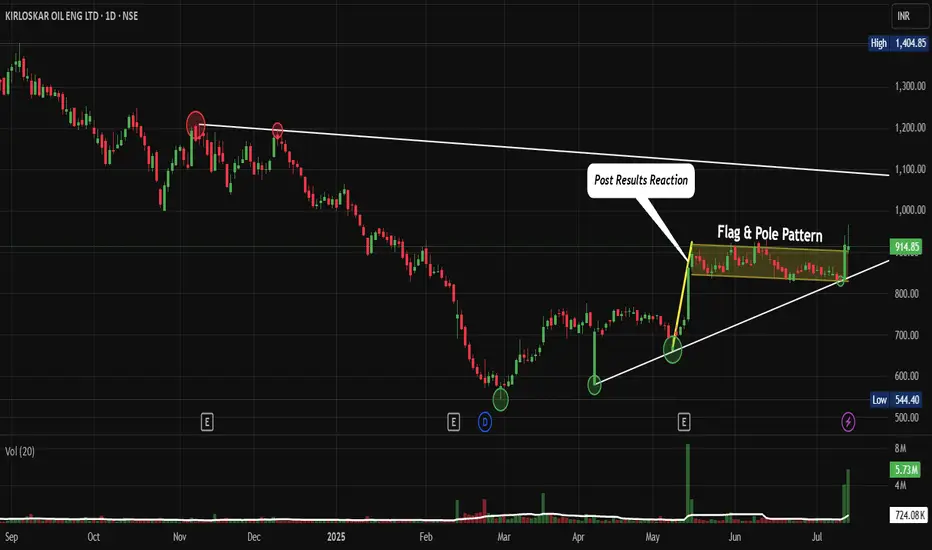
KIRLOSENG: Post-Results Breakout and Consolidation. F&P PatternNSE:KIRLOSENG : How This Hidden Gem Could Be Your Next Big Winner After Post-Results Breakout and Consolidation Let's Analyze in my "Chart of the Week"
Price Action:
- The stock shows a classic recovery pattern from March 2025 lows around ₹590-600
- Current price at ₹914.85 represents a significant 52% recovery from the March bottom
- The stock has been forming higher lows since March, indicating underlying strength
- Recent breakout above the ₹850 resistance level with strong volume confirmation
Volume Spread Analysis:
- Volume spike during the recent breakout suggests institutional participation
- The post-results reaction shows a healthy volume of 724.08K against a 20-day average of 5.73M
- Volume patterns indicate an accumulation phase during the consolidation period from April to June
Base Formation:
- Primary base established between ₹590-650 (March 2025 lows)
- Secondary base formed around the ₹750-800 level during April-May consolidation
- Current base being built around ₹880-920 after the recent breakout
Support and Resistance Levels:
Key Support Levels:
- Immediate support: ₹880-890 (recent breakout level)
- Strong support: ₹830-850 (previous resistance turned support)
- Major support: ₹780-800 (secondary base level)
- Ultimate support: ₹590-650 (primary base)
Resistance Levels:
- Immediate resistance: ₹950-970
- Major resistance: ₹1,000-1,020 (psychological level)
- Long-term resistance: ₹1,100-1,150 (previous highs from late 2024)
- Ultimate target: ₹1,400+ (all-time high region)
Technical Patterns:
Flag and Pole Pattern:
- The chart clearly shows a flag and pole formation
- The flag represents the consolidation phase from May to June 2025
- Recent breakout confirms the pattern completion with an upward trajectory
Ascending Triangle:
- The stock has formed an ascending triangle pattern with higher lows and consistent resistance around ₹850
- The breakout above this level validates the bullish continuation pattern
Post-Results Reaction:
- Kirloskar Oil Engines shares settled slightly, trading at Rs 803.75, representing a 9.36% increase, while the BSE Sensex was up by 0.25%.
- The positive reaction to results indicates market confidence in the company's performance
Trade Setup:
Entry Strategy:
- Primary entry: ₹900-920 (current levels on any dip)
- Secondary entry: ₹880-890 (on pullback to support)
- Aggressive entry: ₹930-950 (on breakout above current resistance)
Entry Levels:
- Conservative traders: Wait for pullback to ₹880-890 support
- Moderate traders: Enter at current levels around ₹910-920
- Aggressive traders: Enter on a breakout above ₹950
Exit Strategy:
Target Levels:
- Target 1: ₹1,000 (8-10% upside)
- Target 2: ₹1,100 (18-20% upside)
- Target 3: ₹1,250 (35-40% upside)
- Ultimate target: ₹1,400+ (50%+ upside)
Exit Timing:
- Book 30% profits at Target 1
- Book 40% profits at Target 2
- Hold the remaining 30% for the ultimate target with a trailing stop loss
Risk Management:
Stop-Loss Levels:
- Conservative stop-loss: ₹850 (6-7% downside)
- Moderate stop-loss: ₹830 (8-9% downside)
- Aggressive stop-loss: ₹800 (11-12% downside)
Position Sizing:
- Risk per trade: Maximum 2% of portfolio
- Position size calculation: Portfolio value × 2% ÷ (Entry price - Stop loss)
- For ₹1,00,000 portfolio with entry at ₹910 and stop at ₹850: Position size = ₹2,000 ÷ ₹60 = 33 shares
Sectoral Backdrop:
Industrial Machinery Sector:
- The industrial machinery sector has been showing resilience amid economic recovery
- Infrastructure push by the government supports demand for engines and pumps
- Agricultural mechanization trends favour companies like NSE:KIRLOSENG
Market Position:
- The company caters to the agriculture, ... Clients (Marine, Defence, etc), After Sales Support, Retail Channel – Tractor spares, Oil, Batteries.
- Diversified revenue streams provide stability across economic cycles
Fundamental Backdrop:
Financial Performance:
- Netprofit is up for the last 2 quarters, 68 Cr → 127 Cr (in ₹)
- Revenue is up for the last 2 quarters, 1454 Cr → 1753 Cr (in ₹)
- As of 31-Mar-2025, Kirloskar Oil Engines has a trailing 12-month revenue of 6349 Cr
Market Valuation:
- Its current market cap is 13,289 Cr with 14.5 Cr shares.
- Stock is trading at 4.30 times its book value
- Promoter holding has decreased over the last 3 years: -18.3%
Growth Outlook:
- The B2B business grew 5 per cent year on year, and the B2C business also witnessed a double-digit growth of 14 per cent year on year
- Strong positioning in agriculture and industrial segments provides sustainable growth prospects
- The final dividend of Rs 4 per equity Share indicates management confidence
My Take:
Investment Rationale:
- Technical breakout supported by improving fundamentals
- Diversified business model reduces concentration risk
- Strong balance sheet with consistent profitability
- Attractive valuation after the recent correction from highs
The combination of technical breakout, improving fundamentals, and supportive sectoral trends makes NSE:KIRLOSENG an attractive investment opportunity for medium to long-term investors with appropriate risk management measures in place.
Keep in the Watchlist.
NO RECO. For Buy/Sell.
📌Thank you for exploring my idea! I hope you found it valuable.
🙏FOLLOW for more
👍BOOST if you found it useful.
✍️COMMENT below with your views.
Meanwhile, check out my other stock ideas on the right side until this trade is activated. I would love your feedback.
Disclaimer: "I am not a SEBI REGISTERED RESEARCH ANALYST AND INVESTMENT ADVISER."
This analysis is intended solely for informational and educational purposes and should not be interpreted as financial advice. It is advisable to consult a qualified financial advisor or conduct thorough research before making investment decisions.
ETHUSD📈 BITSTAMP:ETHUSD Weekly Chart | CMP: $2975
✅ Flag breakout above $2750
✅ Triangle breakout confirmed
📉 Previous range: High $4105 (Dec 2024) – Low $1385 (Apr 2025)
With current breakout holding, if $2290 (weekly close) holds as stop loss,
🎯 Target: $4430 in 12–18 months
Structure looks strong for long-term upside.
#ETH #Ethereum #Crypto #Altcoins #ChartAnalysis

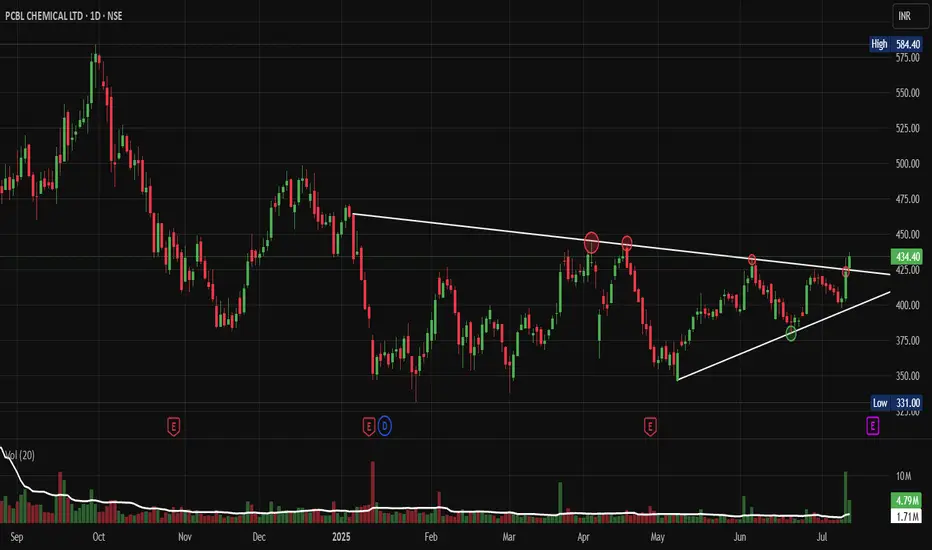
PCBL: The Sleeping Giant Ready to BreakOut of Its TriangleNSE:PCBL : The Sleeping Giant Ready to Break Out of Its Consolidation Triangle
Price Action Analysis:
• Stock has been trading in a well-defined ascending triangle pattern since early 2025
• Current price at ₹434.40 represents a +2.53% gain, showing bullish momentum
• The pattern shows a higher low formation with resistance around ₹450-460 levels
• Recent price action suggests an accumulation phase with controlled volatility
Volume Spread Analysis:
• Volume has been consistently above average during recent sessions (4.79M vs 1.71M average)
• Volume spike visible in recent trading sessions, indicating increased institutional interest
• The volume pattern supports the price consolidation with periodic accumulation phases
• Higher volume during up-moves compared to down-moves suggests buying interest
Key Technical Levels:
Support Levels:
• Primary Support: ₹420-425 (recent swing low)
• Secondary Support: ₹390-395 (ascending trendline support)
• Major Support: ₹360-370 (previous consolidation zone)
Resistance Levels:
• Immediate Resistance: ₹450-460 (triangle upper boundary)
• Key Resistance: ₹480-490 (previous highs)
• Major Resistance: ₹520-530 (psychological level)
Base Formation:
• The stock has formed a strong ascending triangle base over 6-7 months
• Base depth of approximately 15-20% from highs to lows
• Duration suggests a sustainable breakout when it occurs
• Base shows characteristics of institutional accumulation
Technical Patterns:
• Primary Pattern: Ascending Triangle (Bullish)
• Secondary Pattern: Flag formation on shorter timeframes
• Volume-Price Relationship: Positive divergence during recent consolidation
• Moving Average Setup: Price trading above all its key moving averages
Trade Setup:
Entry Strategy:
• Breakout Entry: ₹465-470 (above triangle resistance with volume confirmation)
• Pullback Entry: ₹440-445 (on any dip to support with volume)
• Accumulation Entry: ₹420-430 (for longer-term investors)
Exit Levels:
• Target 1: ₹520-530 (measured move from triangle base)
• Target 2: ₹580-590 (previous swing high zone)
• Target 3: ₹650-680 (extension target based on base depth)
Stop-Loss Levels:
• For Breakout Trades: ₹445-450 (below breakout level)
• For Accumulation Trades: ₹410-415 (below key support)
• Trailing Stop: Use an 8-10% trailing stop after the first target
Position Sizing:
• Conservative Approach: 2-3% of portfolio
• Moderate Approach: 3-5% of portfolio
• Aggressive Approach: 5-7% of portfolio (only for experienced traders)
Risk Management:
• Risk-Reward Ratio: Minimum 1:2 for all trades
• Maximum risk per trade: 2% of total capital
• Use the position sizing calculator based on stop-loss distance
• Avoid adding to losing positions
• Book partial profits at each target level
Sectoral Backdrop:
Chemical Sector Overview:
• Indian chemical sector showing strong fundamentals with export growth
• The speciality chemicals segment is experiencing robust demand
• The government's PLI scheme supports domestic chemical manufacturing
• Global supply chain diversification benefiting Indian chemical companies
Industry Trends:
• Increasing demand for agrochemicals and pharmaceutical intermediates
• Focus on sustainable and green chemistry practices
• Rising input costs are being managed through pricing power
• Strong export opportunities in speciality chemicals
Fundamental Backdrop:
Company Overview:
• NSE:PCBL is a leading player in speciality chemicals and carbon black
• Strong presence in the tire industry through carbon black manufacturing
• Diversified product portfolio, reducing concentration risk
• Established relationships with major tire manufacturers
Financial Highlights:
• Consistent revenue growth over the past few quarters
• Improving margin profile due to operational efficiency
• Strong balance sheet with manageable debt levels
• Increasing return on equity and asset efficiency
Growth Drivers:
• Expanding tire industry in India and globally
• New product launches in speciality chemicals
• Capacity expansion plans for key products
• Focus on high-margin speciality products
Risk Factors:
• Raw material price volatility
• Environmental regulations compliance costs
• Competition from global players
• Cyclical nature of the tire industry
My Take:
NSE:PCBL presents a compelling technical setup with its ascending triangle pattern nearing completion. The combination of strong volume accumulation, supportive sectoral trends, and improving fundamentals creates a favourable risk-reward scenario. Traders should wait for a decisive breakout above the ₹465 levels, accompanied by volume confirmation, for optimal entry. Meanwhile, investors can consider gradual accumulation at current levels, exercising proper risk management.
Keep in the Watchlist.
NO RECO. For Buy/Sell.
📌Thank you for exploring my idea! I hope you found it valuable.
🙏FOLLOW for more
👍BOOST if you found it useful.
✍️COMMENT below with your views.
Meanwhile, check out my other stock ideas on the right side until this trade is activated. I would love your feedback.
Disclaimer: "I am not a SEBI REGISTERED RESEARCH ANALYST AND INVESTMENT ADVISER."
This analysis is intended solely for informational and educational purposes and should not be interpreted as financial advice. It is advisable to consult a qualified financial advisor or conduct thorough research before making investment decisions.
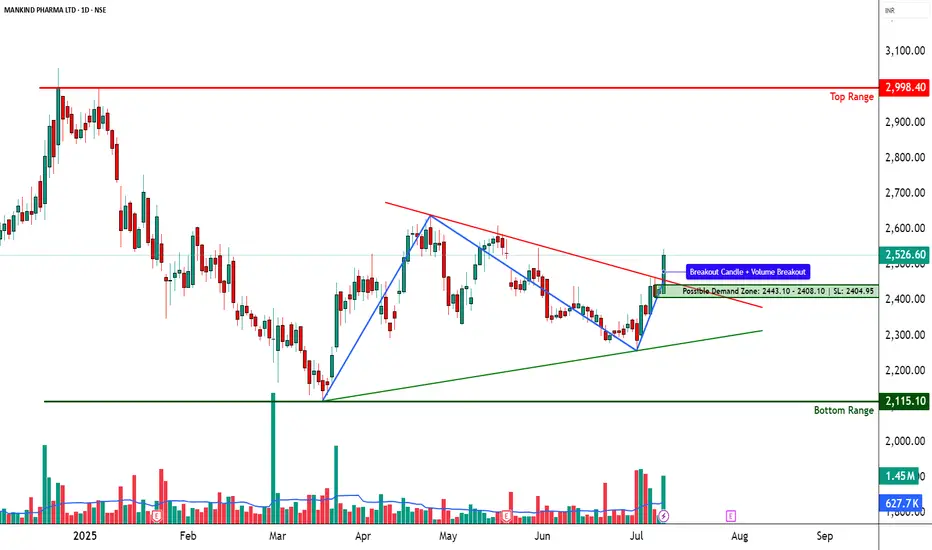
MANKIND PHARMA – Descending Triangle Breakout________________________________________________________________________________📈 MANKIND PHARMA – Falling Trendline Breakout | Strong Reversal Candle | Volume Spike
🕒 Chart Type: Daily Chart
📆 Date: July 9, 2025
________________________________________________________________________________
📌 Price Action:
MANKIND PHARMA has executed a decisive breakout above a falling trendline on the daily chart, breaking out of a multi-week descending structure. The price action had been consolidating within a triangular pattern, and on July 9, it registered a powerful wide-range bullish candle, closing at 2526.60 — well above the recent consolidation highs. This move came from a structured base with two strong pivot lows and now places the stock back into a strong bullish trajectory. The breakout is not random; it’s backed by structure, momentum, and confirmation — suggesting potential for a trend continuation if sustained.
________________________________________________________________________________
📊 Chart Pattern:
The chart shows a descending triangle breakout with compression near the apex. This setup builds pressure and usually resolves in the direction of volume. The move out of this pattern has occurred with authority, marked by a clean range expansion and bullish follow-through above resistance. This is a momentum-confirming breakout, which opens up room toward testing higher resistance zones.
________________________________________________________________________________
🕯️ Candlestick Pattern:
Strong Bullish Candle
Open = Low (Intraday strength)
Buy Today, Sell Tomorrow-type price action
Aligned with Volume Spike and Trendline Breakout
________________________________________________________________________________
🔊 Volume Analysis:
The breakout is accompanied by more than 2x the 20-day average volume, signaling real participation — not just speculative noise. Delivery volumes are notably strong, and volume came after a phase of tight consolidation, which indicates a possible transition from quiet accumulation to active participation by stronger hands.
________________________________________________________________________________
📈 Technical Indicators:
RSI (Daily): 66 – strong, trending up
MACD: Bullish crossover, both on Daily and Weekly
CCI: 220 – highly bullish momentum territory
Stochastic: 94 – overbought but confirming momentum
SuperTrend & VWAP: Clearly bullish
Bollinger Band: Price is expanding beyond upper band — volatility expansion in motion
________________________________________________________________________________
🧱 Support & Resistance:
🔻 Supports:
2448.27 – Immediate support (previous breakout zone)
2369.93 – Structure base support
2322.27 – Last defense before breakout invalidation
Bottom Range / Demand Zone: 2115.1 – Long-term accumulation zone
🔺 Resistance Zones:
2574.27 – First supply zone; watch for price reaction
2621.93 – Medium-term resistance; previously rejected here
2700.27 – Higher timeframe swing resistance
Top Range: 2998.4 – Long-term resistance; breakout confirmation if crossed
________________________________________________________________________________
👀 What’s Catching Our Eye:
What stands out is the confluence breakout — trendline, structure, volume, and indicators are all pointing in the same direction. The BB squeeze, RSI breakout, and strong candle together make this a multi-signal setup — rarely do we get such alignment across tools.
________________________________________________________________________________
🔍 What We’re Watching For:
Will the price hold above 2448–2526 for the next couple of sessions? If yes, this breakout can see momentum continuation toward 2574+. Any low-volume pullback toward the trendline or support zone could be a low-risk re-entry. If it fails to hold above the breakout candle, momentum could fade.
________________________________________________________________________________
✅ Best Buy Level for Equity (Low Risk Idea):
Entry: Above 2543.60 (post-breakout confirmation or clean retest of 2448–2455 zone)
Stop Loss: 2404.95 (on a closing basis)
Risk Reward Strategy: 1:1 initially, trail for 1:2+ if volume expands
Avoid chasing: Let the price validate with sustained volume above breakout
________________________________________________________________________________
💼 Sector Tailwinds:
The pharmaceutical sector is seeing renewed investor interest post-COVID, with growing focus on specialty products, chronic therapy lines, and export-led growth. MANKIND is among the strongest consumer-pharma brands with consistent results and brand recall — adding fundamental strength to this technical breakout.
________________________________________________________________________________
⚠️ Risk to Watch:
A close below 2448 could invalidate this setup
The overbought Stochastic means minor pullbacks or shakeouts are possible
Don’t chase — always confirm the breakout with a retest or follow-through candle
Over-positioning during volatility can lead to poor R:R trades
________________________________________________________________________________
🔮 What to Expect Next:
If this breakout holds, we may see follow-through toward 2574.27 in the short term. Strong volume above 2540+ can unlock upside toward 2621+. However, if the price closes below 2448, we may be dealing with a failed breakout — a scenario to strictly avoid. Watch next 2–3 sessions for clarity.
________________________________________________________________________________
🧠 How to Trade MANKIND PHARMA (For Educational Use Only):
🔹 Breakout Trade Plan
Entry: Above 2543.60
Stop Loss: 2404.95 (Closing basis)
Pullback Entry: Into 2448 zone with bounce candle
Risk-Reward: Start with 1:1, then trail to 1:2+
Position Sizing: Risk-calibrated, never go all-in
________________________________________________________________________________
⚠️ Disclaimer (Please Read):
• This chart is shared for educational purposes only and is not investment advice.
• I am not a SEBI-registered advisor.
• The information provided here is based on personal market observation.
• No buy/sell recommendations are being made.
• Please do your own research or consult a registered financial advisor before making any trading decisions.
• Trading involves risk. Always use proper risk management.
________________________________________________________________________________
💬 Found this helpful?
What’s your ideal approach to this setup — breakout entry or pullback into zone?
Drop your thoughts or questions in the comments below ⬇️
🔁 Share this post with your trading community
✅ Follow STWP for clean technical setups backed by price action and volume
🚀 Let’s trade with patience, logic, and clarity!
Be Self-Reliant | Trade with Patience | Learn with Logic
________________________________________________________________________________
Rossari Biotech Long setup 1:5 RR (Textile chemical sector)
Buy Rossari Biotech long setup
Between 700-710
Stop loss: 665
Target 1: 765
Target 2: 830
Target 3: 862
Trade as per your risk-taking capacity.
Triangle Pattern and trend line breakout with volume
They are among the largest manufacturers of textile specialty chemicals in India.
If US-India trade deal benefits textile sector, this will start running.

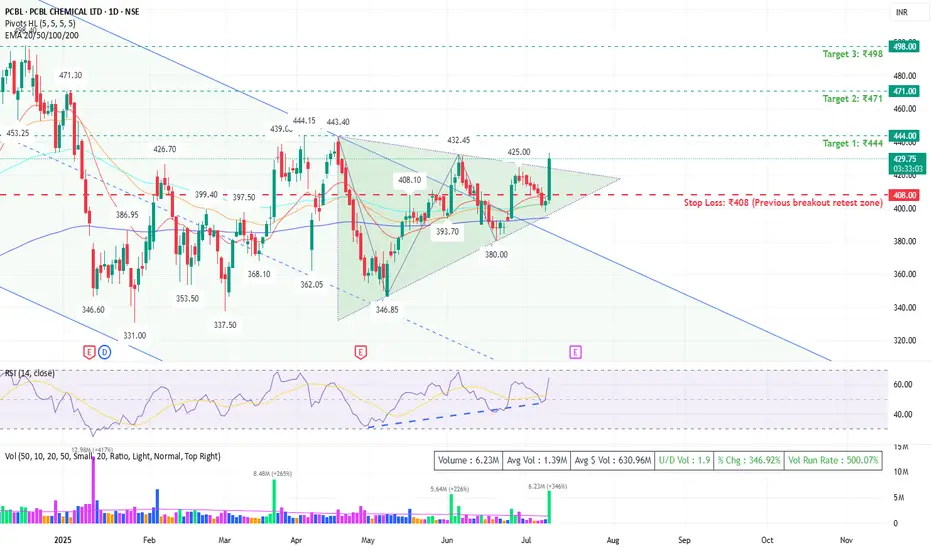
PCBL – Breakout from Symmetrical TriangleNSE:PCBL
📈 PCBL – Breakout from Symmetrical Triangle | Bullish Momentum Building 🚀
📌 Symbol: PCBL CHEMICAL LTD – NSE
🕒 Timeframe: Daily
💰 CMP: ₹431.85 (+6.80%)
📆 Date: July 9, 2025
🔷 Technical Summary:
PCBL has given a strong breakout above a well-formed *symmetrical triangle* with significant volume support. Price action indicates trend reversal from a long-term falling channel.
✅ Key Bullish Signals:
• Symmetrical triangle breakout above ₹425
• Bullish engulfing candle with 271% spike in volume
• RSI at 65 – strong but not overbought
• Price trading above all major EMAs (20/50/100/200)
• Vol Run Rate: 390% – confirms strong market participation
📊 Support & Resistance Levels:
• Support: ₹408 / ₹393.70 / ₹362
• Resistance: ₹444.15 / ₹471.30 / ₹498.40
📈 Trade Setup (Positional):
• Buy Zone: ₹425–₹432 (on dips or sustained close above ₹432)
• Target 1: ₹444
• Target 2: ₹471
• Target 3: ₹498
• Stop Loss: ₹408 (below breakout zone)
🧠 Analyst Note:
This breakout comes after months of consolidation and offers a favorable risk-reward ratio. Watch for follow-through above ₹444–₹448 for confirmation of a larger uptrend.
📢 Disclaimer: This is not investment advice. Please consult your financial advisor before making any trading decisions.
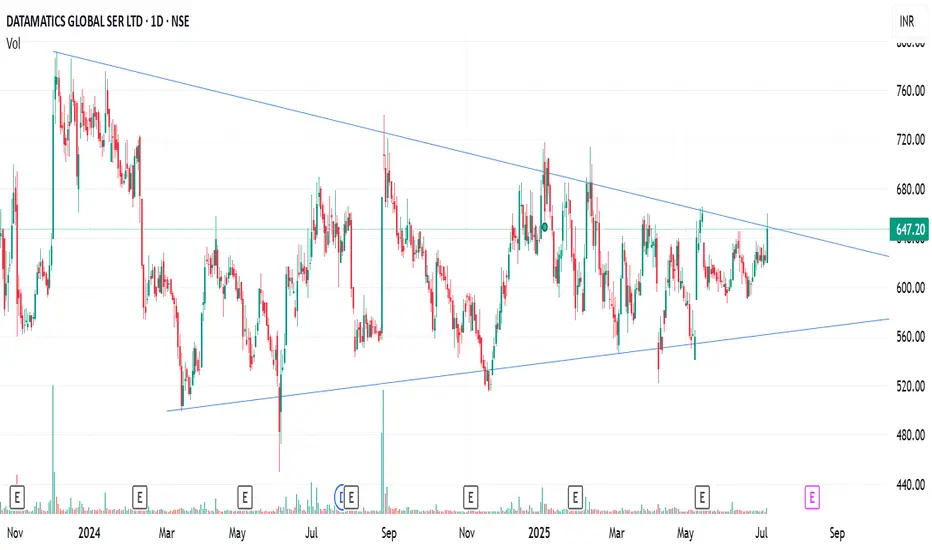
Datamatics Breakout | Swing tradeDatamatics will be giving a breakout soon. Its a triangle breakout.
I have little idea about fundamentals.
Lets see how it goes.
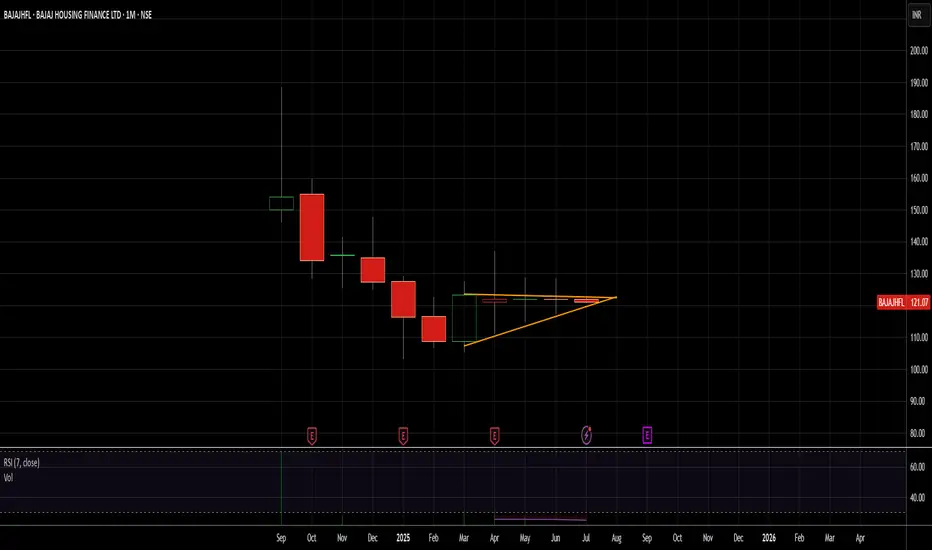
Clear ascending trianglethe position of the chart is super clear
The recent listing after the IPO never had such a good pattern
I am bullish on the pattern and the formation in the present chart
Bajaj Auto: Wave 4 Triangle Nearing CompletionAfter completing a complex W-X-Y-X-Z correction earlier this year, Bajaj Auto appears to have started a fresh impulsive rally. The move from 7,089 to 9,004 looks like a 5-wave structure in progress, with the chart now suggesting Wave 4 is unfolding as a contracting triangle.
Wave E of the triangle seems close to completion near the lower boundary.
SMA100 is aligned with this support zone, potentially offering additional footing for price.
The Fibonacci retracement zone (Wave 1–3) lies between 8,046 and 8,273.
RSI is stabilizing, indicating that downside momentum is weakening.
A breakout from the triangle could signal the start of Wave 5.
Key level to watch:
Invalidation at 7,612 — a break below this would invalidate the current bullish setup.
Note: This chart is part of my ongoing series where I aim to annotate and study as many NIFTY-listed stocks as possible using Elliott Wave principles and simple technical tools.
Disclaimer: This analysis is for educational purposes only and does not constitute investment advice. Please do your own research (DYOR) before making any trading decisions.

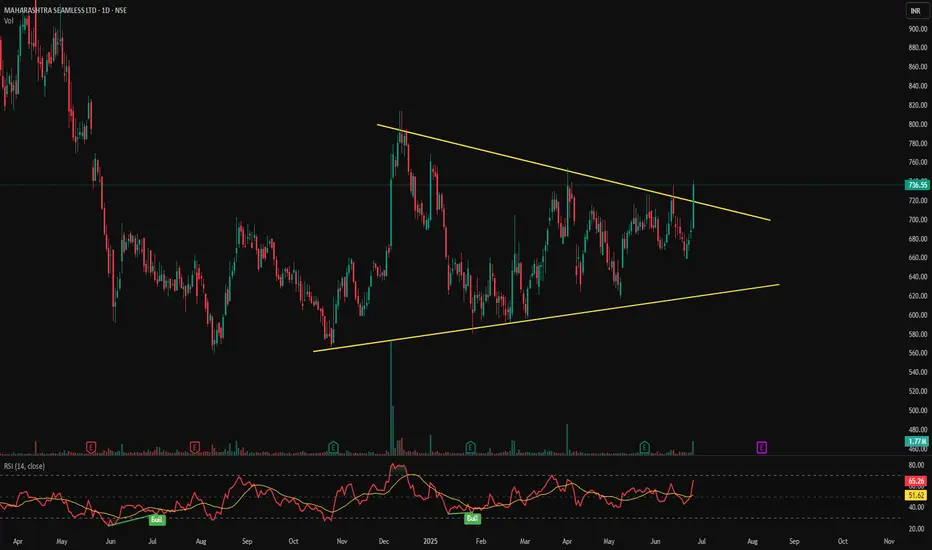
MAHSEAMLES - Symmetrical Triangle Breakout📊 MAHSEAMLES – Symmetrical Triangle Breakout | RSI Bullish | Volume Surge | Daily Timeframe
📅 Chart Date: June 26, 2025
📈 CMP: ₹736.55 (+7.20%)
📍 Ticker: NSE:MAHSEAMLES
🔍 Technical Analysis Overview
🔺 Symmetrical Triangle Breakout
After months of consolidation within a symmetrical triangle pattern, MAHSEAMLES has broken out with a strong bullish candle
Breakout level: Above ₹725, confirmed with strong price momentum
Breakout marks potential trend reversal and beginning of new bullish phase
📊 Volume
Volume spike to 1.77M, significantly higher than recent average – validates breakout strength
📈 RSI Indicator (14)
RSI at 65.26, trending upwards – bullish zone
Previous RSI Bullish signals noted at key turning points, providing confluence
📍 Key Technical Levels
✅ Breakout Level: ₹725
🚀 Potential Upside Targets (based on pattern height projection):
₹770
₹800
₹840+
🛡️ Support Zones:
₹700 (retest zone)
₹670 (lower trendline support)
₹635 (triangle base)
💡 Trade Setup Idea
Entry: On breakout close above ₹725 with confirmation
Stop Loss: Below ₹695 (just under triangle resistance)
Targets: ₹770 → ₹800 → ₹840+
Risk-Reward: Favorable with pattern breakout and rising momentum
⚠️ Disclaimer
This chart analysis is for educational purposes only. Always DYOR (Do Your Own Research) and consult a financial advisor before making investment decisions.
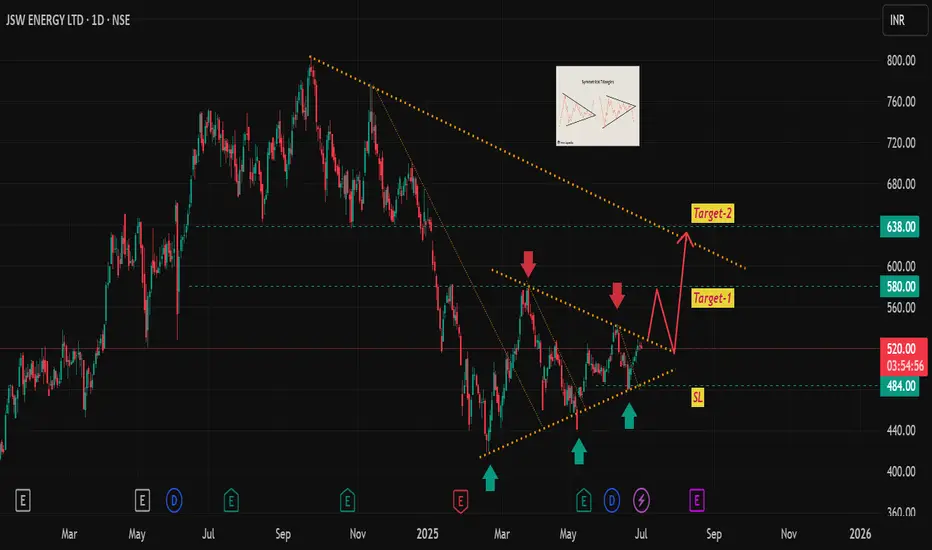
JSW Energy - symmetric triangle chart patternJSW Energy - under the formation of symmetric triangle chart pattern, it is near to breakout level, one can go long (short term) here, stop loss and targets are mentioned in the chart.
Please note: I am not a certified stock analyst, this chart is purely for education purpose, request you to do your own financial assessment before investment/trade.
How I Read Price Action Like a Pro (Most Miss This Step)The REAL Way to Read Price Action — No Indicators, Just Logic
I make educational content videos for swing trading .

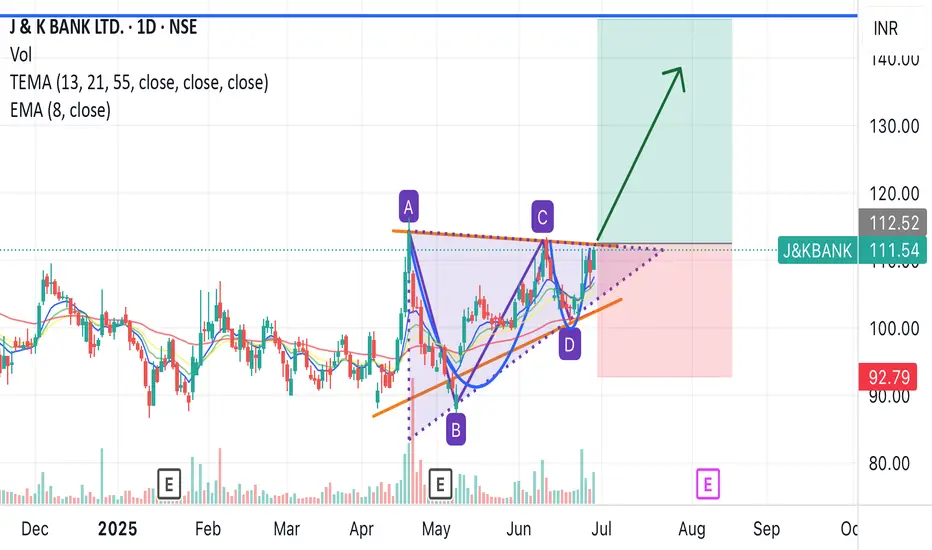
J&k Bank nearing breakout with triangle, and also. Up and handleJ&k bank nearing breakout according to triangle, and cup and handle pattern.
Entry - around 111
Target - 145
Duration- 2-3 months
With good fundamentals
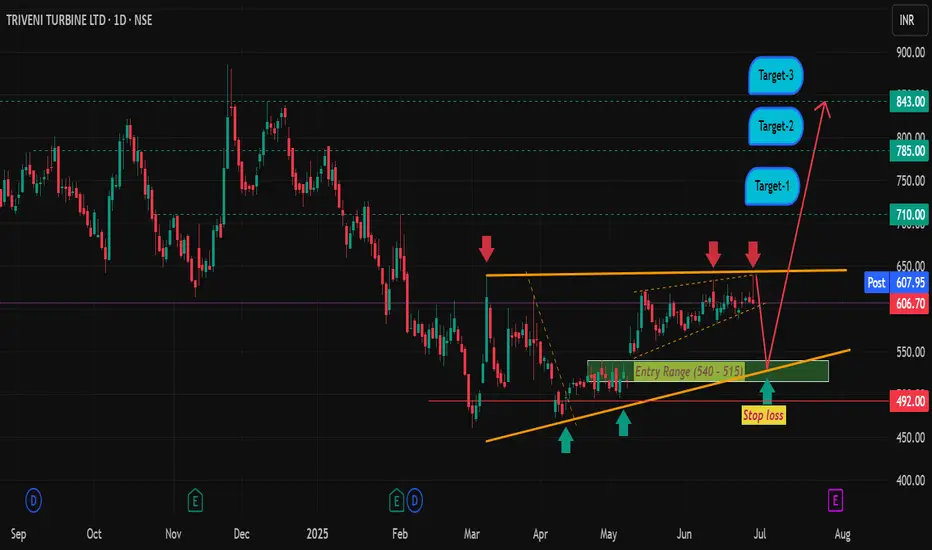
Triveni Turbine LtdTriveni Turbine specializes in the manufacturing and maintenance of steam turbines, particularly for industrial and power generation applications. They offer a range of steam turbines, including back-pressure and condensing types, designed for diverse pressure and flow requirements, up to 100 MW.
The company demonstrates strong profitability with a good profit growth of 25.1% CAGR over the last 5 years. They also have a healthy interest coverage ratio (64.45) and a good cash flow management.
Promoters hold a significant portion of the shares (55.84%), while Foreign Institutional Investors (FIIs) hold a substantial stake as well (28.01%)
Entry, stop loss and target details mentioned in the chart.
Note: Please do your self financial assessment before investment, I am not certified stock analyst.
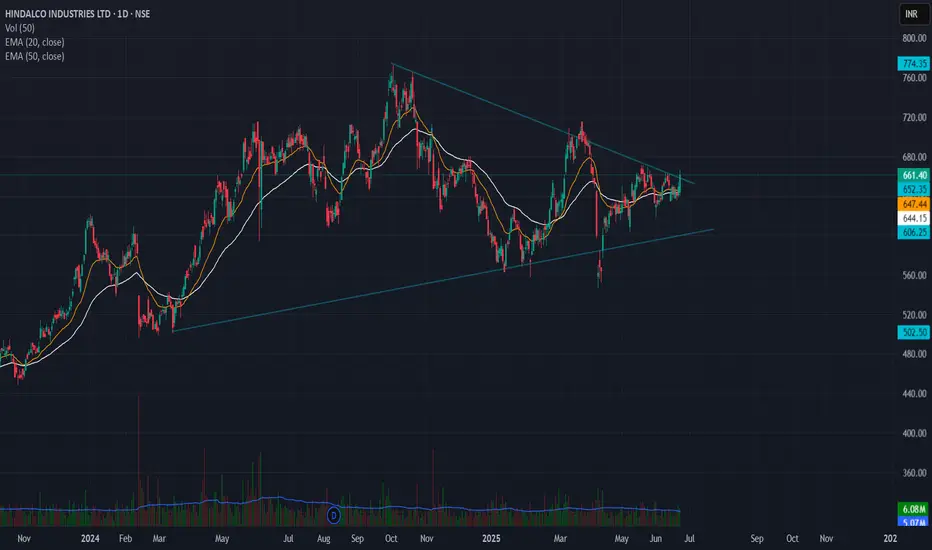
Hindalco Symmetrical Triangle breakout setup🔹 Pattern: Symmetrical Triangle
🔹 Breakout Level: ₹660
🔹 Stoploss: ₹635 (below swing low)
🔹 Target Zone: ₹850 – ₹900
🔹 Risk–Reward: 7.6 – 9.6
🔹 Timeframe: Positional (swing to medium term)
---
📊 Chart Analysis:
Hindalco has broken out of a well-defined symmetrical triangle on the daily chart, with strong price compression followed by bullish breakout confirmation.
The triangle height is ~₹200, projected from the breakout zone, giving a target range of ₹850–₹900.
🧠 Stoploss placed below the last swing low inside the triangle to avoid false breakdown traps.