Aeroflex | Symmetrical triangle breakout ### 📊 **Aeroflex Industries Ltd - Technical Analysis Summary (Daily Chart)**
#### 🚀 **Breakout Overview**
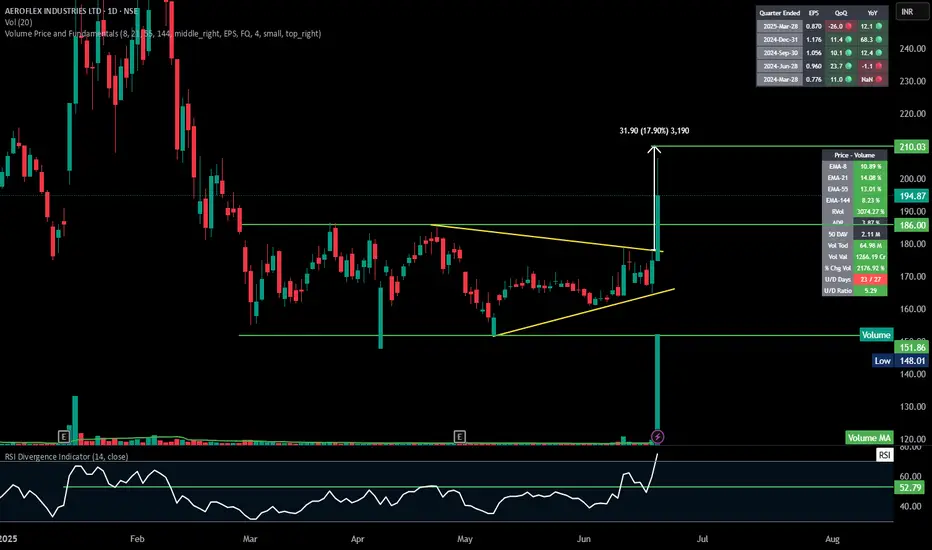
* **Pattern**: Symmetrical triangle breakout (tight range → explosive move)
* **Breakout Confirmation**: Massive bullish candle (+11.45%) with **volume spike (64.98M)** — over **1200% above average**
* **Breakout Level**: \~₹174–₹176
#### 🎯 **Target Projection**
* **Height of Triangle (Approx)**: ₹31.90
* **Target Price**: ₹176 (breakout level) + ₹31.90 ≈ **₹210**
#### 📌 **Key Price Levels**
* **Current Price**: ₹194.87
* **Immediate Resistance / Target**: ₹210
* **Support**: ₹186 (previous swing high and breakout retest level)
* **Stop Loss Zone**: Below ₹174
#### 📈 **Volume & Indicators**
* **RSI**: 74.80 — Overbought, but confirms strong momentum
* **EMA Confluence**:
* EMA-8: +10.89%
* EMA-21: +14.08%
* EMA-55: +13.01%
* EMA-144: +8.23%
* **RVol**: 3074.27% — Heavy institutional activity likely
* **U/D Ratio**: 5.29 — Strong buying dominance
#### 🧠 **Inference**
* **Strong bullish breakout** with rising volume and RSI confirmation.
* Good follow-through expected up to **₹210**.
* Watch for minor pullbacks or consolidation near ₹186 for potential entry on retest.
---
Triangle
AMBER | Watchlist | Symmetrical triangle | DailyHere’s the analysis of your chart for **Amber Enterprises Ltd (NSE)**:
---
### 📊 **Price Action & Patterns**:
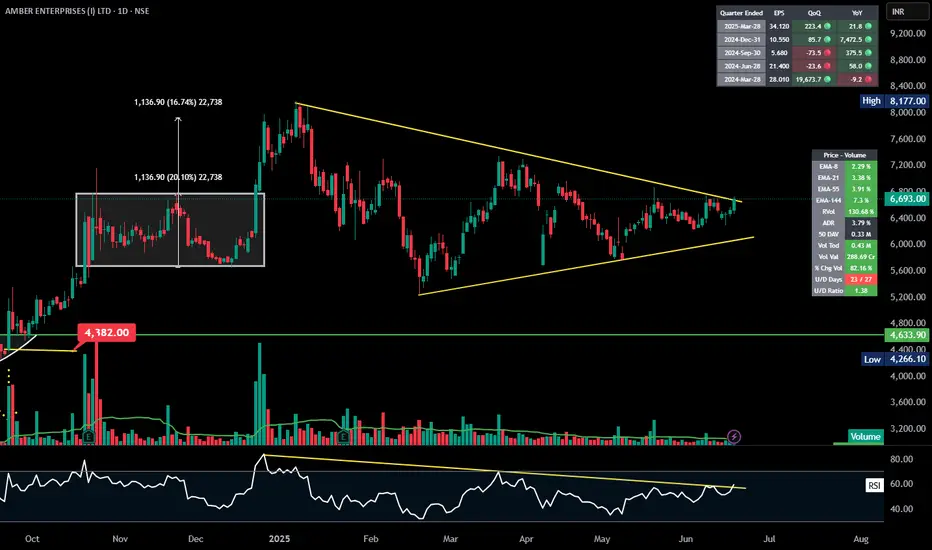
* The stock is forming a **symmetrical triangle** pattern, which is visible by the yellow trendlines.
* Recently, the price has **broken out** above the top trendline around ₹6,693.
* Prior to this triangle, there was a strong upward move — this often increases the probability of an upward continuation.
---
### 📈 **Volume Analysis**:
* Breakout is accompanied by an **increase in volume** (\~0.43M), suggesting strong participation.
* The volume profile also shows that current volume is **higher than average** (50-DMA Vol = 0.33M), reinforcing the breakout strength.
---
### 🔍 **Indicators**:
* **RSI** is breaking above its downward trendline (\~60 level), which indicates a **momentum shift to the upside**.
* Moving averages show short-term EMA (8 & 21) **crossing over** the longer-term averages — supportive of bullish strength.
---
### 🧠 **Key Levels**:
* 📈 **Resistance Breakout** around **₹6,693** — next psychological resistance could be around ₹7,200–7,400.
* 📉 **Support** lies at **₹6,400** (near breakout level) and then ₹6,000.
---
### 🧮 **EPS & Fundamentals**:
* Quarterly EPS (March-2025) at **34.120**, up strongly (223% QoQ, 21.8% YoY), so fundamentals support the move.
---
### ✅ **Summary**:
**Amber Enterprises Ltd** is showing a **technical breakout with strong volume** after consolidating in a symmetrical triangle pattern. Momentum looks positive — a **continuation toward the previous swing high (\~₹7,200)** is possible as long as price stays above ₹6,400.
Symmetrical Triangle pattern in Torrent Pharma Symmetrical Triangle Breakout Setup
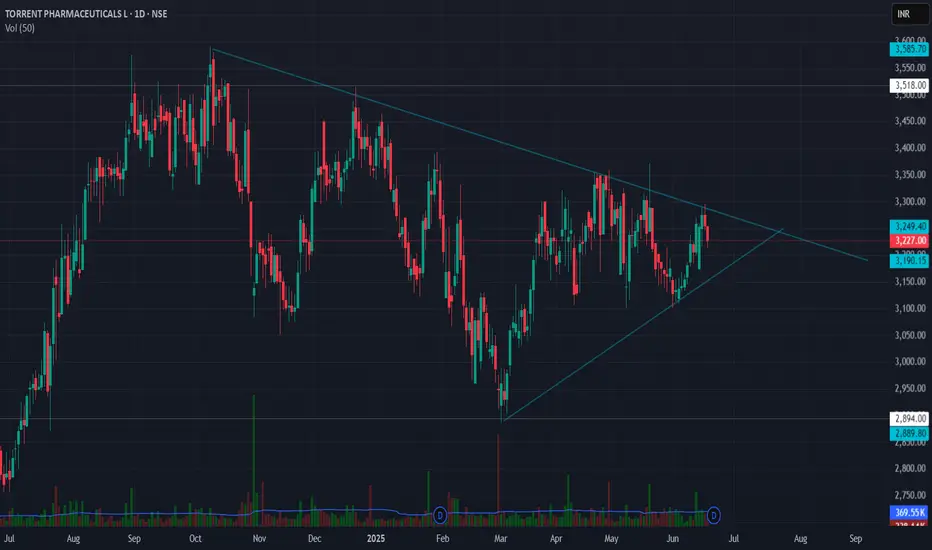
Torrent Pharmaceuticals Ltd (TORNTPHARM)
Breakout Level: ₹3,300
Stop Loss: ₹3,150 (below triangle support)
Target: ₹4,000 (based on height of triangle)
Risk:Reward: ~2.8:1
✅ Technical Confirmation:
RSI near 52 — momentum shifting bullish above 55.
MACD positive crossover, rising histogram — trend strength improving.
Volume: Awaiting breakout candle with above-average volume for confirmation.
EFI (Elder Force Index) turning positive — signals potential surge in buying force.
📌 Strategy Insight:
A breakout above ₹3,300, backed by volume and momentum, could lead to a sharp trend continuation toward ₹4,000. The symmetrical triangle represents consolidation after trend — a potential bullish continuation pattern.
Usoil trade setup Very bullishUSOIL harmonic chart pattern
Head & Shoulder Pattern for few days.
Levels marked on the chart.
#bullish
#harmonic
#USOIL

SHAKTIPUMP | Chart Analysis | Symmetrical triangle | Daily---
### 📊 **Technical Summary:**
#### 🔹 **Chart Pattern:**
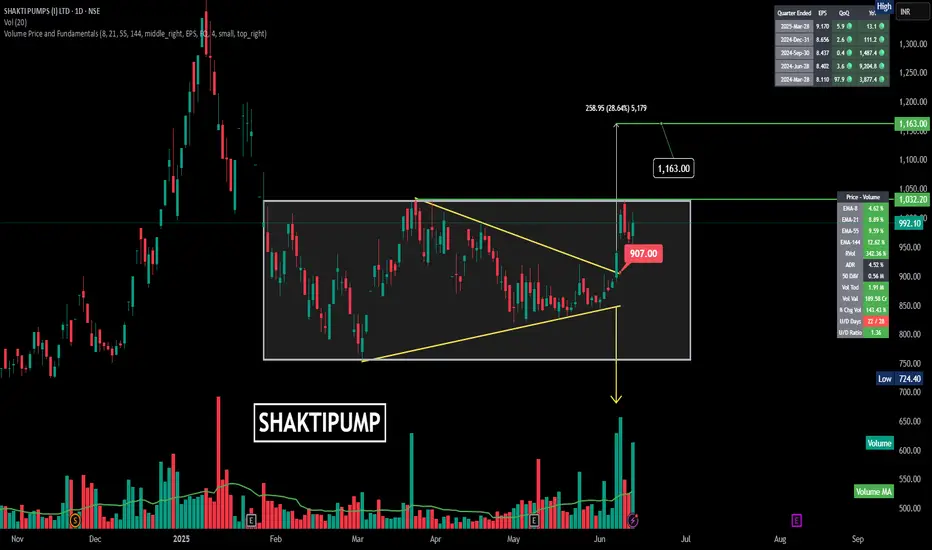
* A **falling wedge** breakout occurred **within a broader rectangular consolidation** (boxed range).
* The breakout zone was near **₹907**, and the stock has since surged past the key resistance.
#### 🔹 **Breakout Confirmation:**
* Price closed at **₹992.10**, sustaining above the breakout.
* The wedge breakout followed by a strong bullish candle confirms **upward momentum**.
#### 🔹 **Volume Action:**
* Noticeable spike in volume during the breakout — indicating **institutional or strong hands entry**.
* Volume > 1.91M, which is far above the 50-day average, confirming strength.
#### 🔹 **Target Projection:**
* Target = Breakout height added to breakout level
\= ₹907 + ₹258.95 ≈ **₹1,163**
* Marked on chart as **28.64% upside potential**
#### 🔹 **Indicators (Right Panel):**
* **EMA Trend**: All EMAs (8, 21, 55, 144) are rising — bullish alignment.
---
### 🔍 **Levels to Watch:**
| Type | Price (₹) |
| ---------------------- | --------- |
| **Breakout Level** | 907.00 |
| **Current Price** | 992.10 |
| **Resistance/Target** | 1,163.00 |
| **Support Zone** | 907–925 |
| **Volume Spike Price** | \~900–930 |
---
### ✅ **Conclusion:**
SHAKTIPUMP is showing a **textbook falling wedge breakout** with heavy volume. The target stands at **₹1,163**, offering a potential **17%+ upside** from current levels. As long as it holds above ₹907–925, the bullish structure remains intact.
---
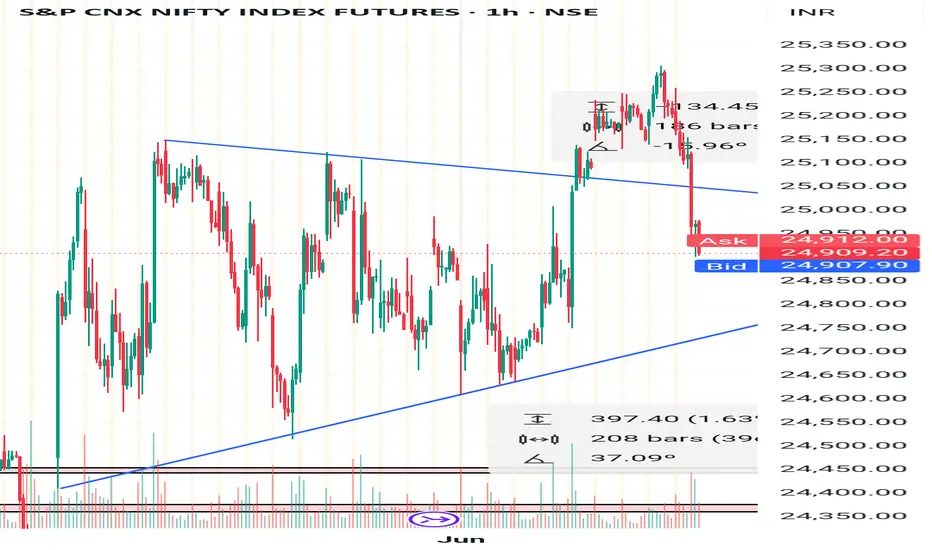
Nifty : symmetry triangle fake BONifty moving in a symmetric triangle
Broke out strong on RBI interest rate decision day
Breakout faded as bulls failed to move price higher
Consecutive last 3 trading days closing<openings
During closing hours big boys moved the price downside and closed below key round level 25000 and trendline of the triangle.
Possible target are marked in chart
Play bear put spread with 1:4 RR.
Happy trading.
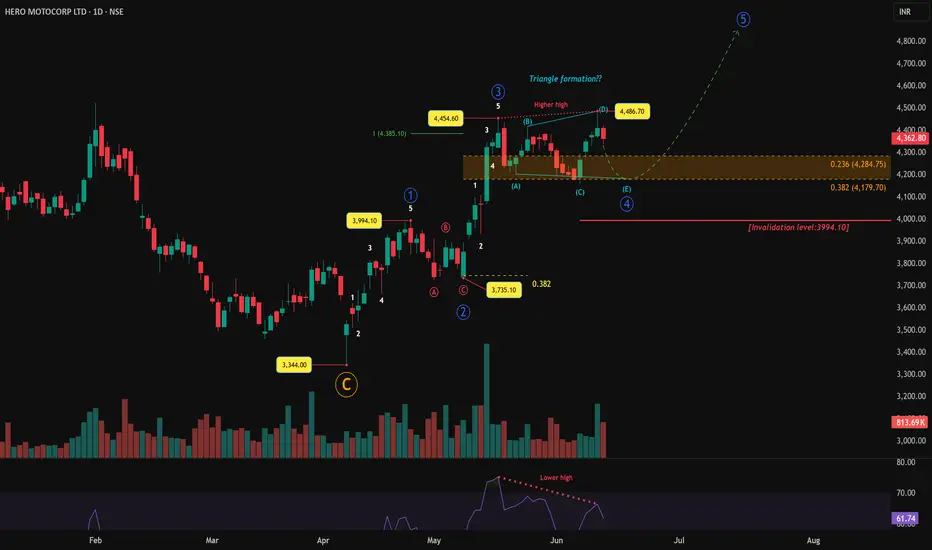
The Silent Power of Wave 4: Why You Shouldn’t Ignore TrianglesMarkets often scream during impulse waves but whisper during corrections. Yet it’s in those quiet phases—especially Wave 4 corrections—that the next big move is born. HERO MOTOCORP’s current price action may just be one of those setups that rewards the patient.
Spotting the Triangle in Wave 4
After a strong Wave 3 high at ₹4,454.60, the price began consolidating. Instead of a sharp drop, a sideways grind with overlapping price action began unfolding—classic signs of a triangle possibly forming. So far, the internal structure appears to be evolving as an (A)-(B)-(C)-(D)-(E) formation, although the triangle is not yet confirmed . The final leg (E) is pending, and until a proper breakout with impulsive character occurs, this remains a working hypothesis.
The retracement zone between 0.236 (₹4,284.75) and 0.382 (₹4,179.70) of Wave 3 has held price so far. This shallow pullback supports the idea of a triangle, which is typically more time-consuming than other corrective forms.
RSI Divergence: A Sign of Weakness
There’s also a noticeable RSI divergence in play. While price made a higher high, RSI printed a lower high—a clue that momentum is cooling. This supports the idea that Wave 3 ended and Wave 4 is underway. Momentum cooling during a triangle formation is common, as the market pauses before its next move.
Volume Behavior
Volume spikes during impulsive waves and contracts during consolidations. HERO’s chart reflects just that—volume expanded strongly during Wave 3 and has dried up during this suspected Wave 4. This aligns well with triangle behavior, where uncertainty reduces participation before the breakout.
Invalidation Level and Risk Clarity
₹3,994.10—Wave 1’s top—acts as the invalidation level. If price breaks below this, the current wave structure becomes invalid and must be recounted. As long as this level holds, the bullish bias remains intact. A breakout above the Wave 3 high with conviction could mark the beginning of Wave 5.
Since Wave 4 hasn’t completed, potential targets for Wave 5 can only be projected once it ends. Typically, Wave 5 can extend to 1x or 1.618x of Wave 1, measured from the end of Wave 4—once its final low is in place.
Final Thoughts
Triangles are often ignored. But in Elliott Wave Theory, they are hidden launchpads—silent phases that precede explosive moves. HERO MOTOCORP might be presenting one such opportunity. If the triangular structure completes cleanly and holds key levels, a fresh impulse could be unfolding.
Chart will be updated as price action evolves.
Disclaimer: This analysis is for educational purposes only and does not constitute investment advice. Please do your own research (DYOR) before making any trading decisions.
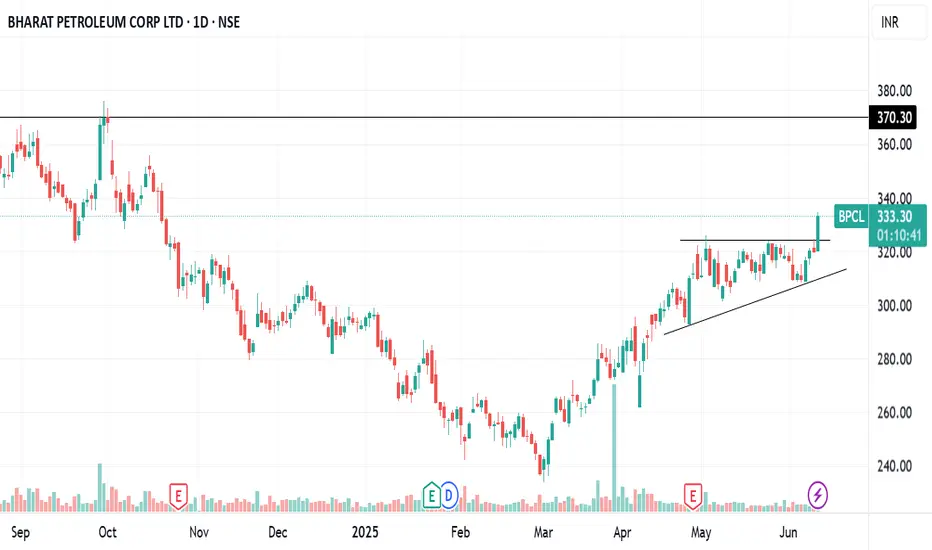
BPCL ASCENDING TRIANGLE BREAKOUTBPCL breaking ascending triangle pattern
bullish RSI ,huge volume
macd crossover done
#target 370
NO BUY/SELL RECOMENDATION
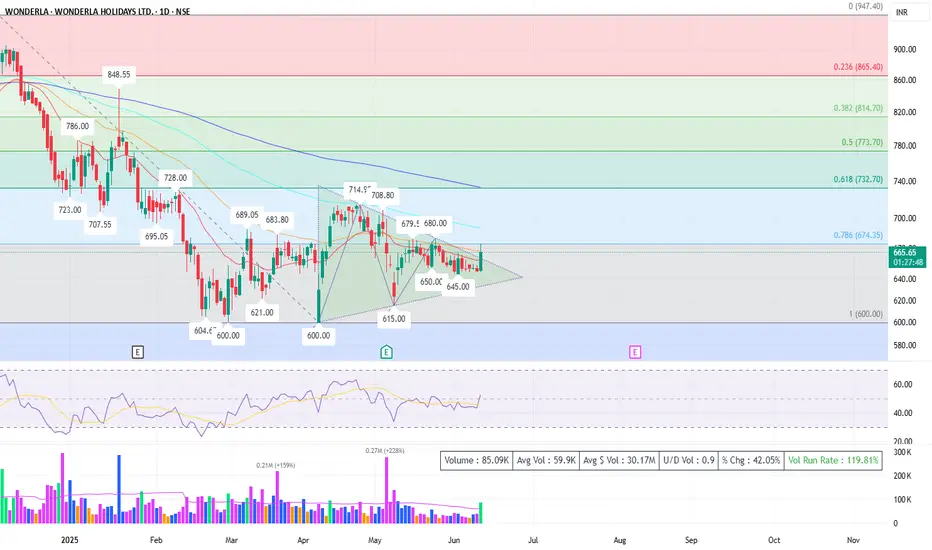
$NSE:WONDERLA : Triangle Pattern Bullish ViewNSE:WONDERLA
WONDERLA HOLIDAYS LTD
*Chart Type:* Daily
*Date of Analysis:* June 11, 2025
*CMP:* ₹666.30 (+3.30%)
*Volume:* 66.9K (Above Average)
---
### *Chart Observations*
#### 🔷 *Pattern Formation*
* *Symmetrical Triangle* breakout appears in progress.
* Price has closed *above triangle resistance* (\~₹665), indicating a potential bullish breakout.
* Prior consolidation between *₹600–₹714* has created a solid base.
---
#### 📊 *Fibonacci Retracement Levels (From ₹947.40 to ₹600)*
* *0.786:* ₹674.35 → *Now testing this level*
* *0.618:* ₹732.70 → *Likely next target post breakout*
* *0.5:* ₹773.70 → Midway retracement
* *0.382:* ₹814.70 → Strong resistance zone
* *0.236:* ₹865.40 → Extended target
---
### *Indicators Used*
#### ✅ *RSI:*
* RSI turning up with a current reading around *55–60*, showing *positive momentum* building.
* RSI bounce from neutral zone suggests fresh buying interest.
#### ✅ *Volume:*
* *Volume spike* on breakout candle confirms strength.
* *Volume Run Rate:* 72.6% of avg → Signaling participation
---
### *Moving Averages*
* Price has crossed *short-term EMAs* and is heading toward the *200-day MA* (\~₹690–₹700 zone).
* Sustained close above 200-DMA will strengthen bullish trend further.
---
Key Levels to Watch (WONDERLA)
🔹 Immediate Resistance: ₹674–₹690
↪️ Testing 0.786 Fibonacci level + 200-DMA zone
🎯 Short-Term Target: ₹732
↪️ Aligned with 0.618 Fibonacci retracement
🎯 Mid-Term Target: ₹773
↪️ 0.5 Fib level and psychological resistance
🎯 Extended Targets: ₹814 / ₹865
↪️ Based on 0.382 and 0.236 Fibonacci retracements
🔻 Support: ₹645
↪️ Triangle base & recent swing low
🛡️ Major Support Zone: ₹600–₹615
↪️ Strong historical demand zone & pattern bottom
---
🔔 Trading Strategy
Bias: Bullish
✅ Entry on dips above ₹665, maintaining a stop-loss at ₹645
🎯 Initial Target: ₹732
🎯 Next Target: ₹773
🔁 Once breakout is confirmed, trail stop-loss to entry level to lock in gains
---
### ⚠️ * Risks & Disclaimer *
* *Markets can be volatile*, and chart patterns may fail.
* *Set Stop Losses*, position sizing is critical.
* This analysis is for *educational purposes only* and not financial advice. Please consult your financial advisor before investing.
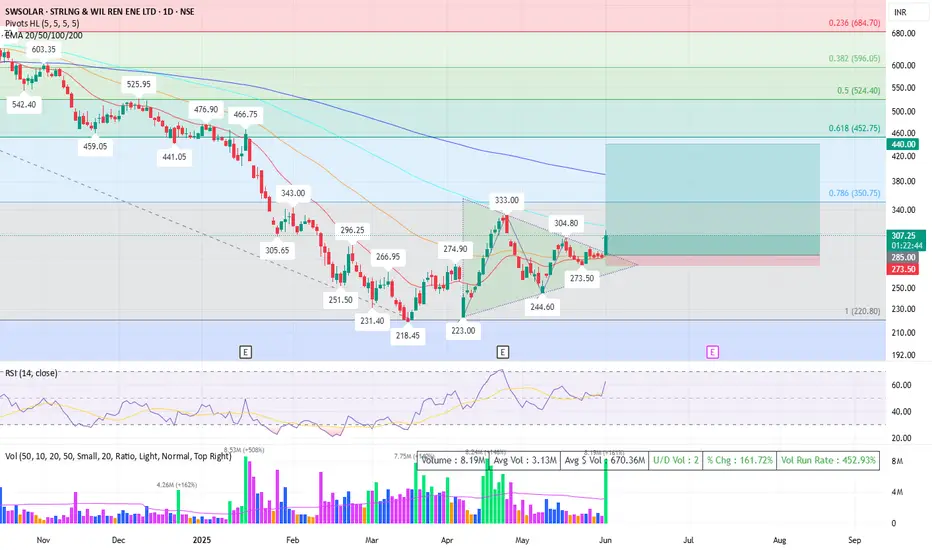
$NSE:SWSOLAR : Triangle Breakout with Volume ConfirmationNSE:SWSOLAR
🧠 CHART OVERVIEW
Exchange: NSE
Current Price: ₹304
Volume: 7.4M (above avg: 3.11M)
Indicators Used in this analyis: EMA (20/50/100/200), RSI (14-day), Volume, Fibonacci Retracement, Support/Resistance, Pivot HL, Symmetrical Triangle Breakout
---
🔍 TECHNICAL ANALYSIS
1️⃣ Breakout & Trend Structure
- Symmetrical triangle breakout confirmed with high volume
- Strong buying interest (7.4M vs 3.1M avg volume)
2️⃣ Support & Resistance Levels
- Support: ₹273.50, ₹244.60
- Resistance: ₹333.00, ₹350.75, ₹390.00–452.75
3️⃣ Fibonacci Retracement Insights
- Reversed from ₹220 (1.0 retracement), now approaching ₹350.75 (0.786 Fib)
- Key targets: ₹452.75 (0.618 Fib), ₹524.40 (0.5 Fib)
4️⃣ Moving Averages
- Price above EMA 20/50/100 but below 200 EMA (₹390.44)
- Short-term momentum bullish, long-term trend yet to confirm
5️⃣ RSI & Momentum
- RSI: 64.05 – Bullish but near overbought
- Momentum picking up, supporting breakout
6️⃣ Volume & Price Action
- 137% above avg volume suggests institutional interest
- Bullish marubozu candle with no upper wick
---
🎯 PRICE TARGETS (Next 3 Months)
- ₹333.00: Short-term resistance
- ₹350.75: 78.6% Fib retracement
- ₹390.00: 200 EMA & major resistance
- ₹452.75: 61.8% Fib breakout zone
---
🛑 STOP LOSS & SCENARIOS
- SL: ₹244.60 (conservative), ₹273.50 (moderate)
- Bullish: Above ₹312 → Buy dips, trail SL
- Neutral: ₹273–333 range → Observe
- Bearish: Below ₹273 → Exit, re-enter near ₹244
---
📢 DISCLAIMER
This analysis is for **educational purposes** only. Not investment advice. Markets are volatile; consult a financial expert before making decisions.
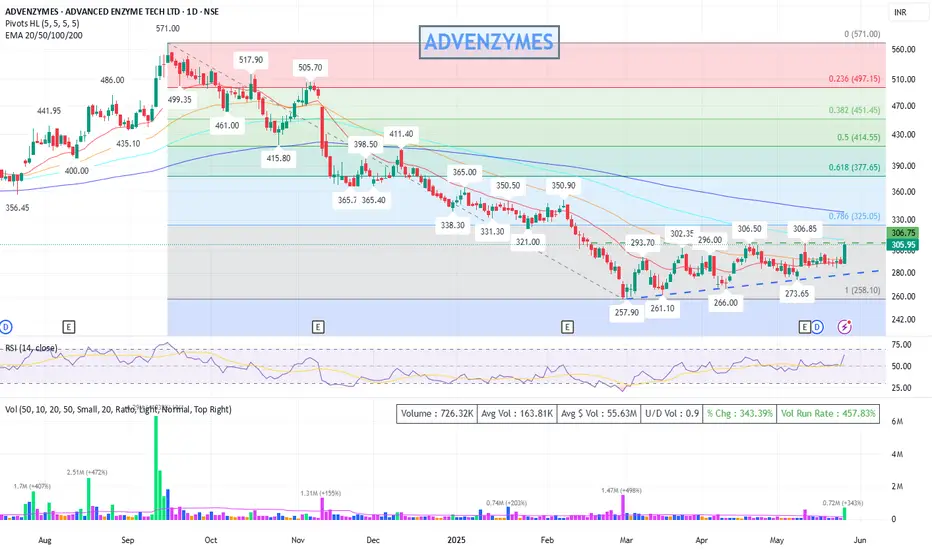
Bullish structure : ADVENZYMES - Ascending Triangle
### 🧾 **Chart Type & Time Frame**
* **Daily Candlestick Chart** (1D)
* **Exchange**: NSE (India)
* **Latest Price**: ₹305.95 (+6.12% on the day)
* **Volume**: 726.33K (well above average — **457.83%** Volume Run Rate)
---
### 📉 **Trend Analysis**
* **Primary Trend**: Downtrend from ₹517.90 (high in Nov 2024) to a bottom around ₹257.90 (March 2025).
* **Current Action**: Price is showing a **potential reversal** from a long downtrend.
* **Higher Lows Pattern**: Since the bottom at ₹257.90, price has made:
* ₹261.10 → ₹266.00 → ₹273.65 → ₹306.85 → (Now breaking above ₹306.75)
This forms an **ascending triangle** pattern (bullish bias).
---
### 📊 **Indicators & Overlays**
#### 1. **Moving Averages (EMA)**
* EMA levels:
* EMA-20: ₹290.07
* EMA-50: ₹292.01
* EMA-100: ₹310.17
* EMA-200: ₹337.89
**Current price (₹305.95)** is:
* Above EMA-20 & EMA-50 → Short-term bullish
* Slightly below EMA-100 and EMA-200 → Mid-to-long term resistance still ahead
If it breaks and sustains above EMA-100 & EMA-200, stronger uptrend confirmation.
---
#### 2. **Fibonacci Retracement (from ₹571 to ₹258)**
* **Key levels:**
* 23.6% → ₹497.15
* 38.2% → ₹451.45
* 50% → ₹414.55
* 61.8% → ₹377.65
* 78.6% → ₹325.05 *(Immediate target zone)*
**Price approaching 78.6% retracement (₹325.05)**, which is a key resistance zone. A breakout here can push prices towards ₹337-₹350 zone.
---
#### 3. **RSI (14, Close)**
* Current RSI: **\~62.90**
* Moving above the 60 level, indicating building bullish momentum.
* Still not overbought (>70), room for upward move exists.
---
#### 4. **Volume**
* Spike in volume on the breakout day → Strong confirmation.
* Today's volume: **726.33K** vs average 163.81K → Over **4x average**.
---
### 📌 **Support & Resistance Levels**
#### Key Resistance:
* ₹306.85 (recent swing high) → **Broken today**
* ₹325.05 (Fibo 78.6%)
* ₹337.89 (EMA-200)
* ₹350–365 (previous price clusters)
#### Key Support:
* ₹293–296 (previous resistance, now support)
* ₹273.65 (swing low)
* ₹258 (Fibo 100% level)
---
### 🔺 **Pattern Observed**
* **Ascending Triangle** breakout confirmed with high volume
* Bullish structure: Higher lows with flat resistance (₹306 zone)
* If price sustains above ₹306, could target ₹325–₹350 short term
---
### 🔮 **Conclusion & View**
✅ **Bullish Bias in Short Term**
* Breakout of important level with strong volume
* RSI supportive
* EMA crossovers may follow if trend continues
📈 **Short-Term Target**: ₹325 → ₹337 → ₹350
📉 **Stop Loss**: ₹293 or ₹280 (based on risk appetite)
📌 Disclaimer: This analysis is for educational and informational purposes only and does not constitute investment advice. Please do your own research or consult with a financial advisor before making any trading decisions. Markets are subject to risks.
Tirumalai: The Anatomy of a BreakoutOn the daily chart, TIRUMALCHM appears to be approaching a potential breakout from an ascending triangle pattern, a formation often associated with bullish continuation. Notably, the price has managed to close above all key EMAs, including the 200-day EMA, which is widely regarded as a long-term trend indicator.
From a momentum perspective, both the RSI and MACD indicators are showing strength on the daily and weekly timeframes. These signals may suggest the early stages of a sustained upward trend, contingent on broader market conditions and follow-through price action.
Given the current technical setup, the stock may be considered for gradual accumulation near the CMP. Alternatively, more conservative participants might prefer to wait for a potential retest of the breakout zone in the coming sessions, which could offer a more favourable risk-reward entry with a next long term resistance of ₹340 .
A technical invalidation level could be considered below the ₹251 mark, depending on individual risk tolerance and trading strategy.
Disclaimer: This analysis is intended solely for educational and informational purposes. It does not constitute investment advice or a recommendation to buy or sell any financial instrument. Market participants are strongly encouraged to conduct their own research or consult with a qualified financial advisor before making any investment decisions.

BEPL Breakout soonBEPL about to breakout with 16% profit in short term with triangle pattern and also 55 ema has crossed 8,13,21 ema which shows strong uptrend on moving average
Hold duration around 1-2 month
Entry - 117
Target -138
Stock has good fundamentals
So I suggest to buy BEPL Bhansali eng. Polymers LTD

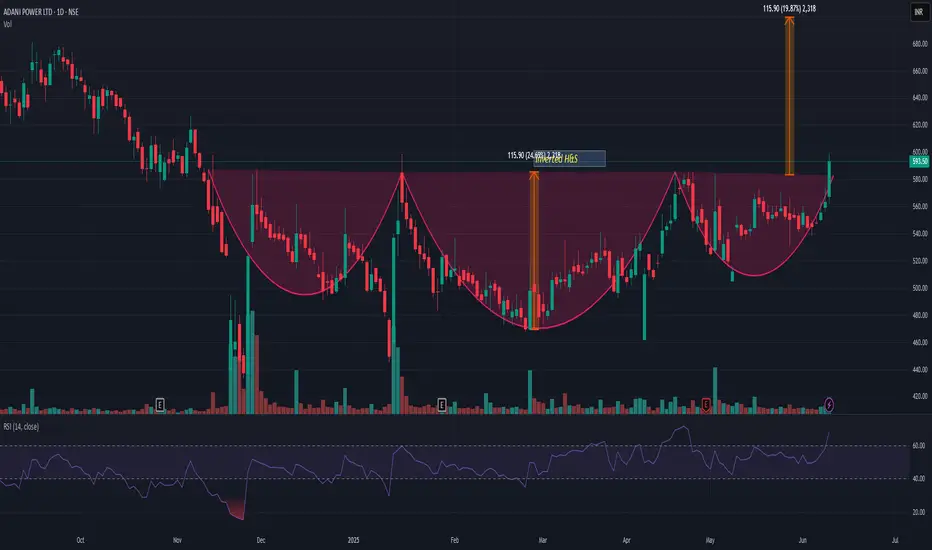
ADANIPOWERADANIPOWER has given inverted H&S breakout with very good volume. All ADANI stocks showing a strength. If we look at the pattern then it may add more 18-20% from here. My view may change we it closes below 540.
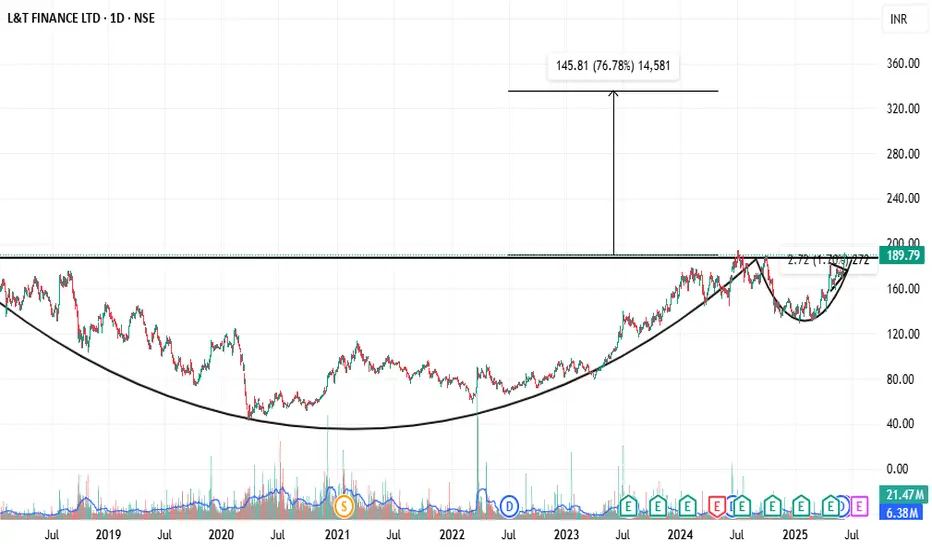
BULLISH ON NBFC STOCKS, "LTF" IS ONE OF THEMEid-Ul-Adha Pick
Technical View
Cup & Handle Pattern Formation...
Near To All Time High Breakout...
Ready To Multiyear Breakout...
Ascending Triangle Breakout In Daily Chart...
Long On "LTF"
Entry Near 180-190
Buy On Dips Near 150
Sl 135
Target 205/245/335++++
#The_Chartist
I Am Not Sebi Registered Research Analyst Or Investment Advisor. You Should Advice From Your Financial Advisor. Recommendation Only For Educational Purpose.
SHAKTI PUMP : A text book break out• Stock broke a 4 month long short term trendline on 06th Jun25.
• Taken support from long term trendline.
• Big boys took position for the last 2 months without disturbing the price.
• An increase in volume is the testament of the hypothesis.
• Go long on positional/swing basis.
• Target 1: 1029.5
• Target 2: 1192
• Target 3: 1356.5
• SL for Swing traders: 878
• SL for positional trader: 839
• A RR of 1:4.75. A classical textbook breakout.
• Enjoy the show!!!

Bank Nifty - All time high...Daily time frame shows price has formed an ascending triangle and price has closed above it on Friday creating all time high.
Near by support is seen at 55950 to 56150. Resistance is seen at 56700 zone.
One hour time frame shows price is moving inside a rising channel. Buying zones are above 56000 or 56700 zones. Sustaining above this, price can reach 56920, 57100, 57320, 57560, 57680, 57840 and 58000.
Do your own analysis before taking any trade.

ICICIGIICICIGI has given triangle breakout with very decent volume. In recent time traction in insurance sector has been observed. At current level 2000-10 there is resistance. But if it crosses and closes above this resistance level then it may do wonder! On lower side 1860 is very strong support. And upper end momentum can be played up to 2210 level. But strong upside play is possible only above 2010 closing

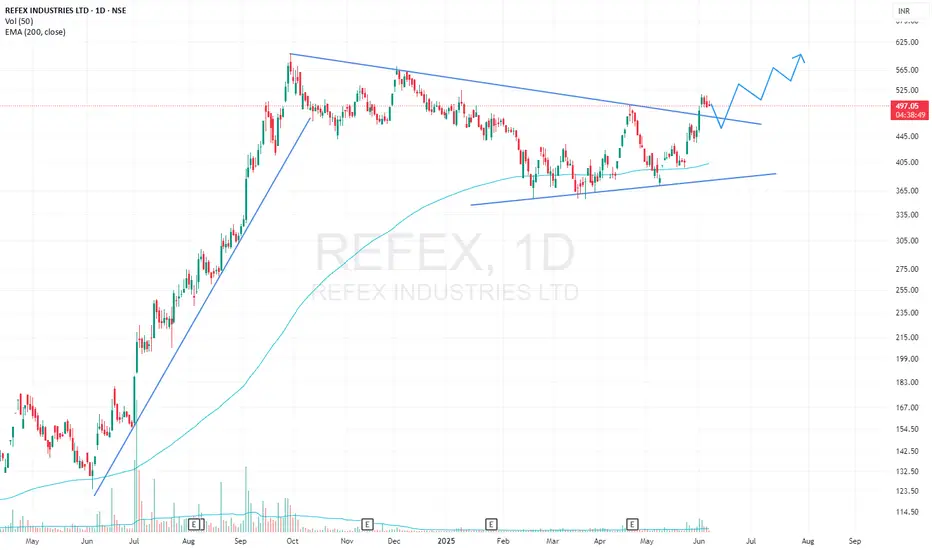
REFEX Triangle & Bull Flag BreakoutREFEX has given a breakout from Symmetrical Triangle and Bull Flag pattern on 1D timeframe with high volumes. Stock has also bounced several times from 200 EMA. Long Position can be initiated with proper risk management.
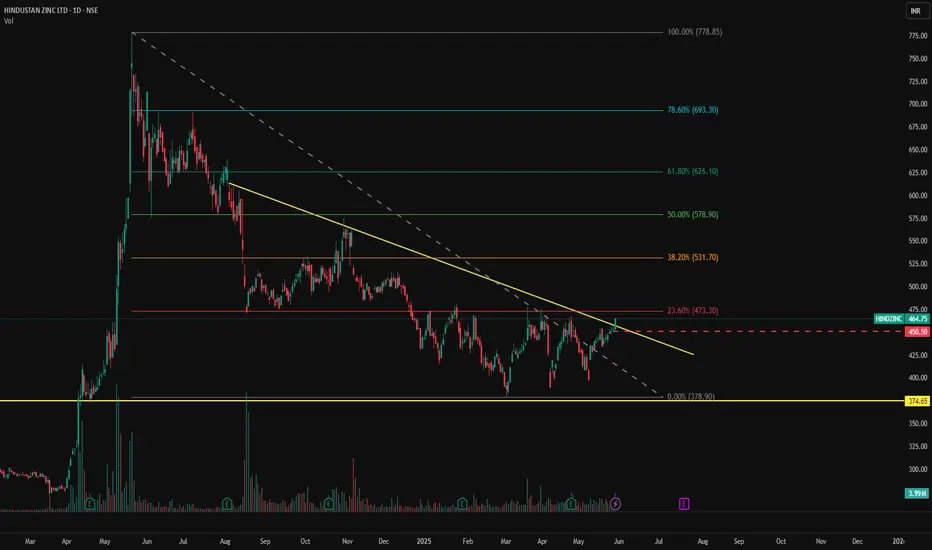
HINDZINC - NSE | Daily Chart Analysis📊 HINDUSTAN ZINC LTD (HINDZINC) – NSE | Daily Chart Analysis
📅 Date: May 30, 2025
📈 CMP: ₹464.75 (+2.68%)
📌 Ticker: NSE:HINDZINC
🧠 Technical Breakdown
🟢 Descending Trendline Breakout 🟢
The stock is showing early signs of strength as it approaches the apex of a long-term descending trendline. Price action is attempting a trendline breakout from a nearly year-long downtrend, suggesting the possibility of a bullish reversal.
🔍 Volume Confirmation
Steady volume buildup over the past few sessions, potentially indicating accumulation ahead of a confirmed breakout.
📉 Well-Defined Support
₹374.65 has acted as a strong demand zone on multiple occasions, offering a solid base for the current move.
📍 Key Price Levels
🔺 Resistance (Trendline Breakout Zone): ₹465
🔻 Major Support: ₹374.65
🎯 Upside Targets (on breakout):
₹500
₹535
₹575+
🛡️ Stop Loss: Below ₹440 (on breakout failure)
📌 Trading Strategy
Aggressive Entry: On breakout + closing above ₹465 with volume surge
Conservative Entry: Retest of trendline post-breakout
SL: ₹440
Target Zone: ₹500–₹575
⚠️ Disclaimer
This post is for educational purposes only and does not constitute financial advice. Always conduct your own analysis or consult a financial advisor before investing.
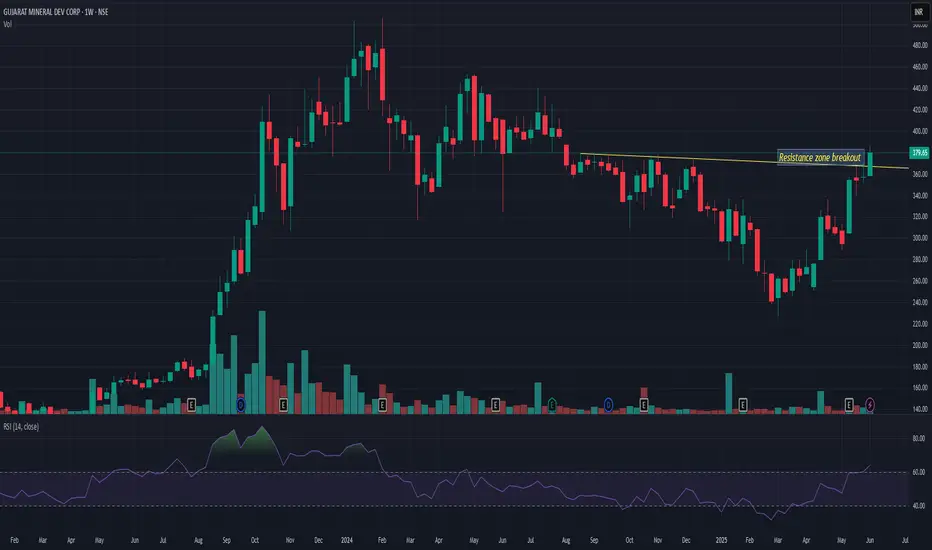
GMDCLTD GMDCLTD seems very strong on weekly charts. Shown strong momentum in recent trading days. And closing above 200 MA since last 5-7 sessions. Now if it closes above 385 then again it may resume its uptrend and may go up to 460 levels from here. 350 is very strong support. So closing below this may change my view
OFSS | Symmetrical Triangle | BreakOut |DailyGot it! I see the **ORACLE FIN SERV SOFT LTD** chart.
Let’s break down what we’re seeing:
---
**🔍 Pattern Observed:**
✅ **Symmetrical Triangle / Ascending Triangle:**
The chart shows an **ascending triangle breakout** pattern — higher lows and horizontal resistance. Volume is starting to increase, suggesting an upcoming move.
✅ **Base Formation:**
* There was a **rectangle base** (accumulation zone) from March to April 2025, marked with a box.
* Post breakout from this rectangle (around 8,000 zone), the stock formed higher lows, consolidating into the triangle.
✅ **Resistance:**
* Horizontal resistance around ₹8,913.15 – key breakout level.
* Once price closes above this zone with volume, the pattern confirms.
---
**📈 Measured Move Target:**
* Height of the triangle / base: \~₹1,000
* Breakout level: \~₹8,900
* **Target:** ₹8,900 + ₹1,000 = **₹9,900 – ₹10,000** zone
---
**🔧 Indicators:**
* Volume increased during the breakout attempt – bullish sign.
* EMAs are starting to converge; above EMA-21 and EMA-55, showing short-term trend strength.
---
**✅ Conclusion:**
* **ORACLE FIN SERV SOFT LTD** is attempting an ascending triangle breakout.
* Confirmation comes with a strong close above ₹8,913 on increased volume.
* Target potential: ₹9,900 – ₹10,000.
Would you like me to highlight support/resistance, trendlines, and add potential trade setups (stop-loss/target zones) for this breakout? Let me know! 🚀📊

Gold on it’s target - Next Move BullishOur yesterday analysis went TRUE . As expected after reaching high gold came down for correction. As you all know today there is PMI news today, so market will come down and after that take upward momentum. So do wait for it and after that execute the trade.
Key point.
Support - 3348, 3335, 3329
Resistance - 3354, 3362, 3371
Any Query Reach Us or comment down
Rudra Vasaikar Wishes You A Great And Very Amazing Trading Life. Trade Safe, Trade Right.
RISK WARNING 🔴 🔴 🔴
There is high risk of loss in Trading Forex, Crypto, Indices, CFDs, Features and Stocks. Choose your trade wisely and confidently, please see if such trading is appropriate for you or not. Past performance is not indicative of future results. Highly recommended - Information provided by Pro Trading Point are for Educational purpose only. Do your investment according to your own risk. Any type of loss is not our responsibility.
HAPPY TRADING.
#gold #xauusd #xauusdtrading #goldtrading #goldanalysis #forextrading #forex #trendline #goldsignals #goldnews goldlatestanalysis #xauusdtradesetup #forextradingguide #fxgold
