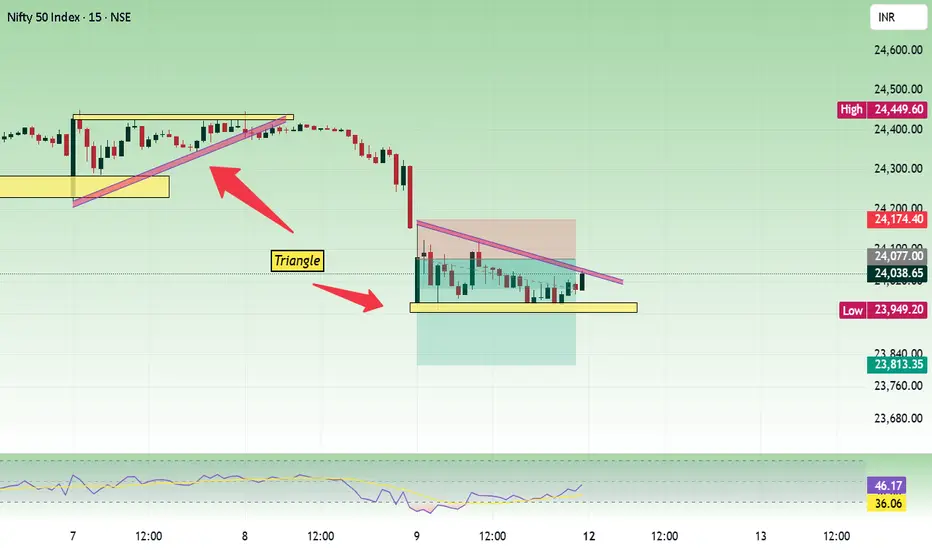
Nifty - Weekly Review May 11 to May 16We had a gap down and consolidation move on Friday. Consolidation has formed a descending triangle. 24000 is an important support zone and the price is sustaining above it so far.
Buy above 24120 with the stop loss of 24070 for the targets 24160, 24220, 24300, 24380, 24420 and 24480.
Sell below 23960 with the stop loss of 24000 for the targets 23920, 23880, 23820, 34780 and 23720.
23950 to 24100 is a slow moving zone where bulls and bears will fight to hold 24000.
Always do your own analysis before taking any trade.
Triangle
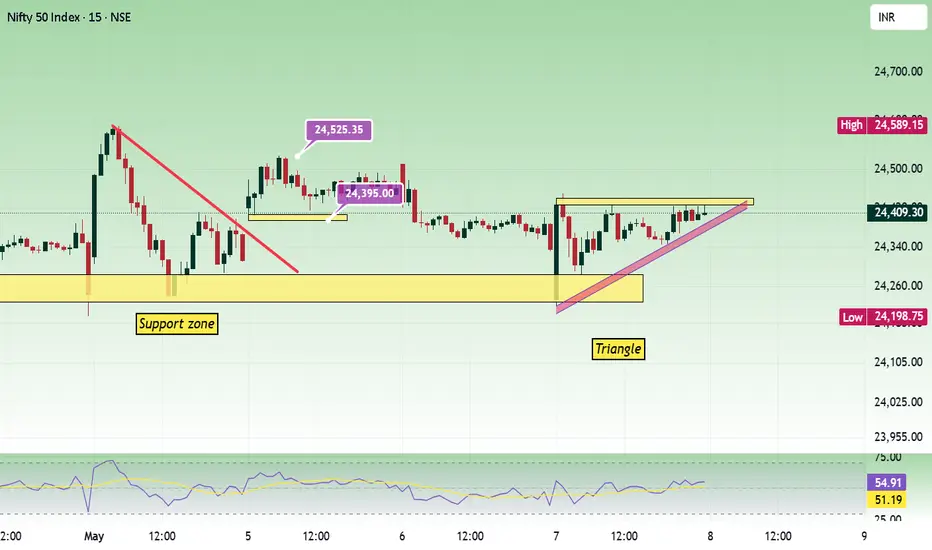
Nifty - May 8 Expiry day analysisToday also we had a narrow range movement day. Price has formed an ascending triangle in that process. Sustaining above 24400 is important to be bullish.
Buy above 24440 with the stop loss of 24400 for the targets 24480, 24520, 24580 and 24620.
Sell below 24340 with the stop loss of 24380 for the targets 24300, 24260, 24220 and 24160.
Always do your own analysis before taking any trade.
Bank NiftyLower time frame shows, price has broken the descending triangle and falling towards 54000 support zone. Near by resistance is seen at 54600.
If price takes support from 54000, buy above 54100 with the stop loss of 54020 for the targets 54200, 54280, 54400, 54520, 54620 and 54740.
Sell below 53900 with the stop loss of 54000 for the targets 53800, 53720, 53600, 53520, 53400, 53320, 53200 and 53060.
Daily time frame looks interesting.
Descending triangle or bullish flag? 🤔
Always do your analysis before taking any trade.

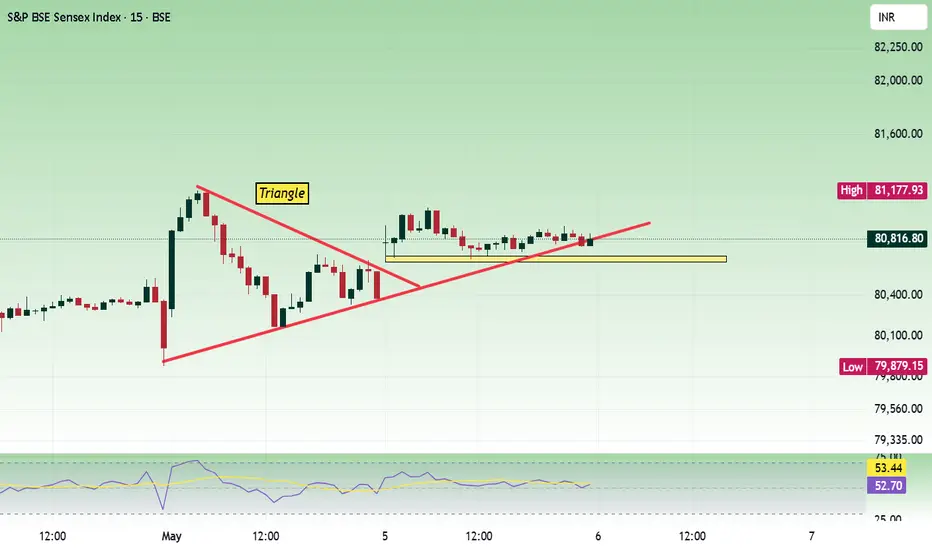
Sensex - Weekly expiry analysis May 6We had a very narrow range movement between 80660 to 81060 today. 81160 - 81220 is also a temporary resistance. Price have to sustain above 81000, then break 81200 to move towards 81600. Price movement is choppy when there are near by support/resistance zones.
Buy above 81060 with the stop loss of 80960 for the targets 81160, 81220, 81340, 81460 and 81660.
Sell below 80840 with the stop loss of 80940 for the targets 80740, 80660, 80540, 80440, 80300 and 80180.
Always do your own analysis before taking any trade.
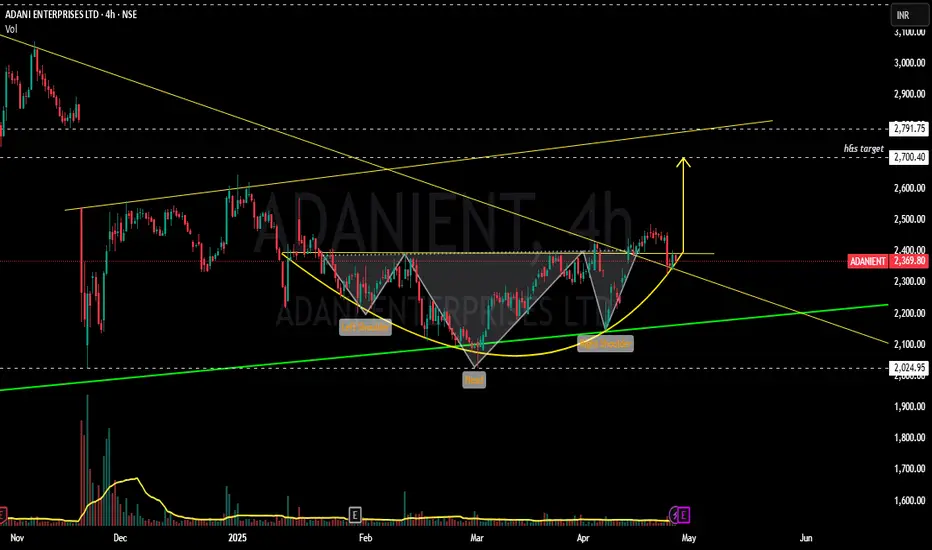
ADANIENT - Bulls getting ready to bump up ?????!!!Y essss!!! !
Chart patterns inculcating me the above titled opinion.
1. Monthly timeframe shows the symmetrical triangle pattern from 2020 till now, now the stock at support line(chart image shown below)
2. Weekly time frame shows us the INSIDE BAR candlestick pattern(mother baby pattern) with good volumes....with the low umtested till now.(made the low of 2025 on 22 nov 2024)
3. Daily time frame shows the Breakout attempt out of the 11 month old trendline.
4. Now, with the results on may 1, we can expect a volatile move.... .with the inverted h&s pattern around the corner.
Voluminous Entry can be made after the BREAKOUT WITH GOOD VOLUMES...
will update once the breakout happens.
Just add it to your watchlist and keep an eye on it.
THIS IS JUST MY OPINION..NOT A TIP NOR ADVICE.
Thank you .
RelianceAs per the daily chart, price is moving up for many days. It can give some pull back. 1400 is an important zone to decide the trend direction. Price have to sustain above this to be bullish.
Buy above 1415 with the stop loss of 1402 for the targets 1432, 1454, 1470, 1486 and 1498.
Sell below 1390 with the stop loss of 1402 for the targets 1376, 1360, 1344, 1330 and 1312.
Always do your own analysis before taking any trade.

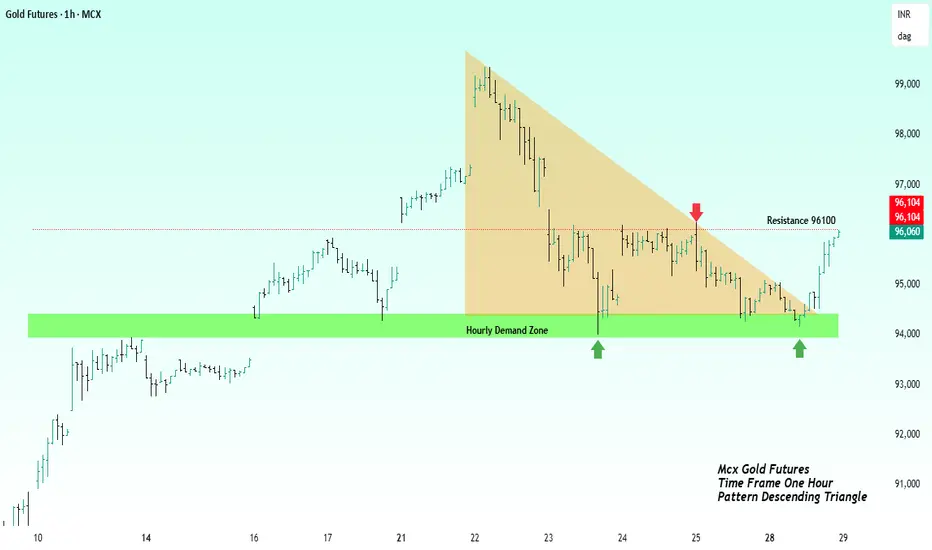
Gold Futures Charging at ResistanceHello Traders hope you are fine and doing well. Gold Futures are approaching a breakout above 96100 after strong demand zone defenses. This idea outlines a potential bullish setup awaiting confirmation for a momentum driven move.
Gold Futures (MCX) is currently forming a bullish setup with multiple rejections from a strong hourly demand zone and compression below the 96100 resistance level. A confirmed breakout above 96100 on the 1-hour timeframe will indicate renewed buying interest and a potential trend continuation.
Trade Plan-:
Entry: 1-hour candle close above 96100.
Stop Loss: To be defined post breakout, based on structure.
Target Levels:
97500, 98500, 99000
A decisive breakout with strong momentum will validate this setup.
Please note-: Final stop loss will be determined after the breakout confirmation.
Stay disciplined and manage risk carefully!
This publication is meant for only learning purpose and not contains any type of trading advice.
Best regards-: Amit
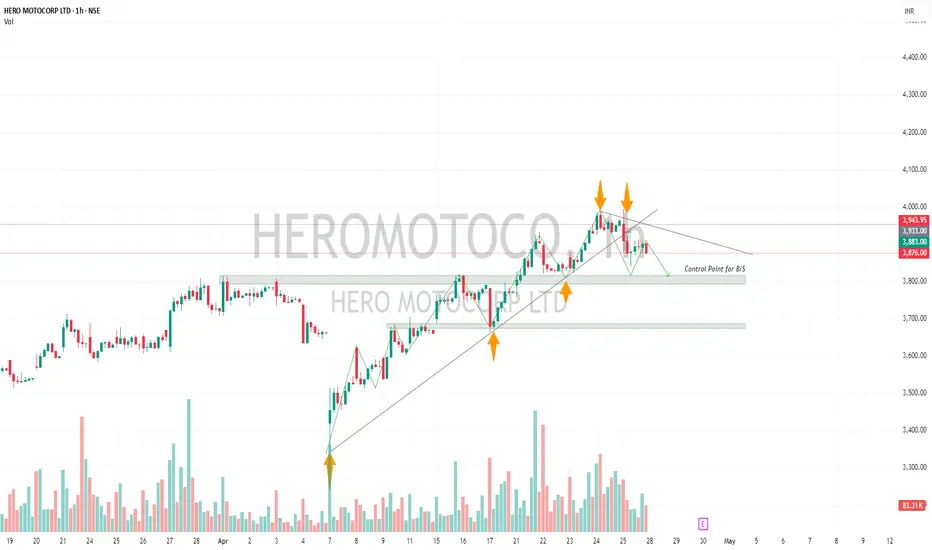
HEROMOTOCO-Positional Short Trade Stock upside taking support from trendline. Friday's session 25'th April The stock has shown weakness potential trend reversal.
There are two possibilities:
1)Head and Shoulder Pattern
2)Descending Tringle Pattern
For both the possibilities it the neckline/Support zone 3800 needs to break. If that happens it may test 3680.
If opens gap up Above 3960 Avoid!
Please don't forget click on follow button so you won't miss any upcoming ideas.
Any confusion, feel free to drop msg. Happy to help :)
This is only for educational purpose, please manage your risk accordingly.
Replicating the other Finance chartsOverall the Financialo space looks great
These are just random examples that are having smart charts on the Monthly

TATA CHEMICALPrice has formed a double bottom in the daily timeframe. Currently, the price is trying to break resistance moreover there’s an ascending triangle, cup and handle pattern in 15 mins TF. We can go long if price breaks this level.

Ambuja Cement news can shake up thingsThis is making a great stock pattern on the long-term charts
The Ambuja acquisition news can only sweeten the deal for NSE:ORIENTCEM

Hindustan Foods Ltd-Symmetrical Triangle Breakout!Hindustan Foods Ltd.—Symmetrical Triangle Breakout! 🚀📈
📅 Published on: April 12, 2025
📊 Chart Insight:
HNDFDS has broken out of a well-formed symmetrical triangle pattern on the daily chart, signaling a potential bullish continuation. The breakout is accompanied by a solid green candle and volume surge, hinting at strong momentum ahead.
🔍 Key Technical Highlights:
🔺 Pattern: Symmetrical Triangle (Lower highs + Higher lows)
📏 Breakout Level: ₹560
📈 Current Price: ₹571.65 (+4.03%)
📊 Volume Spike: 109.28K—a notable increase compared to recent sessions
📌 Support & Resistance Levels:
Immediate Support: ₹560 (breakout level)
Next Support (lower trendline): ₹530
Resistance Levels to Watch:
₹586 (minor supply zone)
₹615
₹645 (swing high)
📉 RSI Indicator:
Current RSI: 60.40—strong upward move, not yet overbought
Hidden Bullish Divergence (visible on chart): RSI made higher lows while price was consolidating—early bullish signal
Bearish markers now invalidated post-breakout
🧠 Trade Idea / Strategy:
📥 Buy on dips near ₹560–₹565 if price retests breakout
🛑 Stop-loss: ₹530 (below ascending trendline)
🎯 Targets: ₹586 ➡ ₹615 ➡ ₹645
📘 Note: Triangle breakouts typically indicate strong price movement after consolidation. Volume confirmation adds conviction.
🔔 Disclaimer: This chart is for educational purposes only. Do your own analysis or consult a financial advisor before investing.

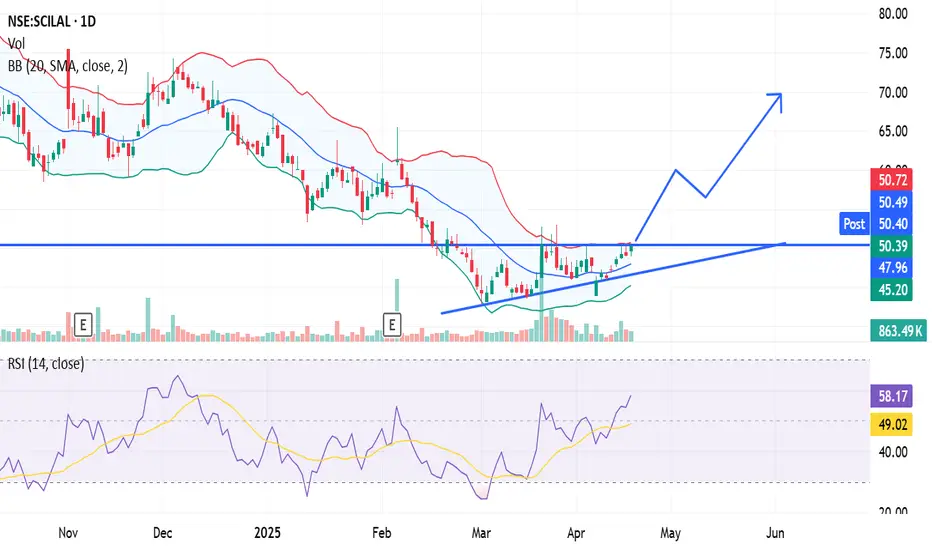
TECHNICAL BET ON SCILALSCILAL has an excellent setup for an upward move. Any closing above 52 can be taken as an entry for long-term profits.
PS: Only for educational purposes.
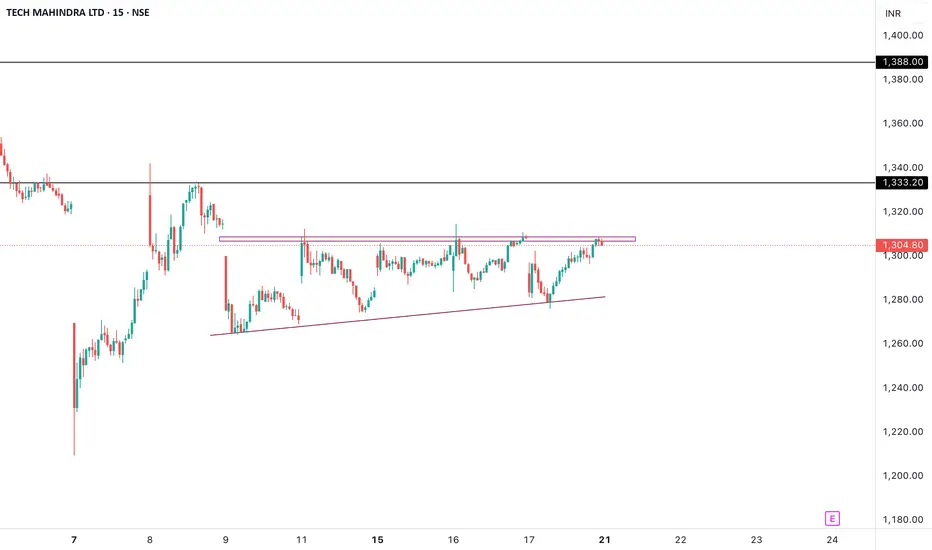
TECHM Ascending triangle in 15 min TFTECHM is trying to break a resistance level where we have 200 EMA too in the 15 min TF. Stock is in a downtrend and it has formed a very ascending triangle pattern. It’s a good opportunity to trade or buy if price sustains above the resistance level.
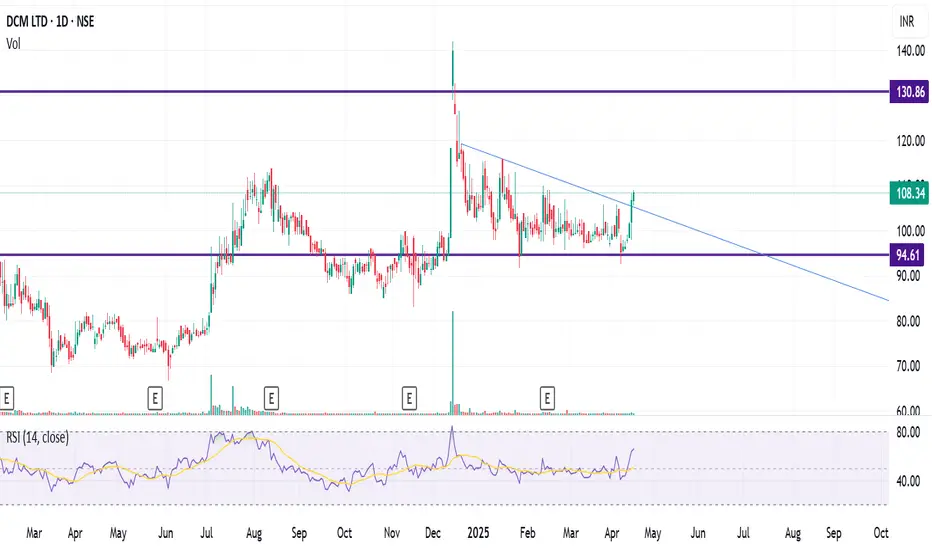
DCM LTD. Swing trade setup and ideaDisc: for educational purposes only.
A good descending triangle setup. No idea of the company recent updates and no concalls but looking at the setup, something is definitely cooking.
Entry: current price.
Exit: 25% upside.
SL: day close below the base line.
Another bank Break away gap...HDFC bank is showing Breakaway gap.
This is another bank which this pattern.
This means a good rally is brewing in this counter.
SL 1795 can be considered.

SbinPrice is testing the trend line in lower and higher time frame. Also price is having at 760 zone.
Buy above 763 with the stop loss of 758 for the targets 768, 774, 780 and 788.
Sell below 754 with the stop loss of 759 for the targets 749, 744 and 738.
Always do your own analysis before taking any trade.

HCLTECH-INTRADAY-LONGStock is forming Ascending tringle in 1hr chart. Good opportunity to go long if it opens flat.
Ignore if it opens below 1405, if gap up wait for retest at 1426.
Please don't forget click on follow button so you won't miss any upcoming ideas.
Any confusion, feel free to drop msg. Happy to help :)
This is only for educational purpose, please manage your risk accordingly.

BANKBARODA-Intraday- Short tradeBANKBARODA has formed Descending tringle in 15minute timeframe.
The key level to watch on 15th April trading session would be 230 if breaks It would be in downtrend for short term till 223 to 220.
If it opens gap up please avoid.
Please don't forget click on follow button so you won't miss any upcoming ideas.
Any confusion, feel free to drop msg. Happy to help :)
This is only for educational purpose, please manage your risk accordingly.

CITY UNION BANK - Buy above 188₹BUY BUY BUY CUB - Dont miss opportunity if 188₹ levels are broken
Ascending triangles tend to be bullish as they indicate the continuation of an upward trend. In some cases, they may point to the reversal of a downtrend. A descending triangle is bearish. That's because it points to the continuation of a downtrend or the reversal of an uptrend.

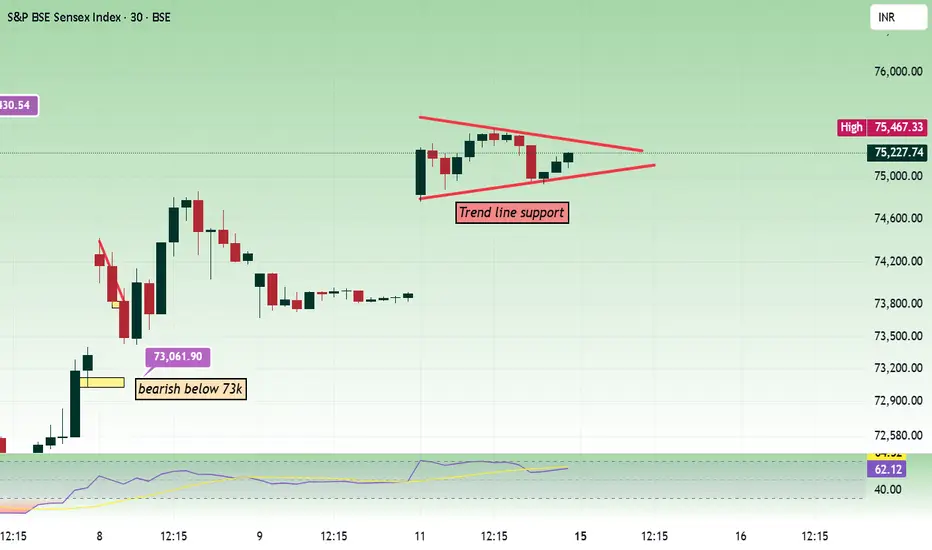
Sensex - Apr 15 expiry day analysisPrice moved in a range in the last trading session. 75400 - 75500 is important to decide the trend direction now.
Buy above 75520 with the stop loss of 75420 for the targets 75600, 75720, 75800, 75920, 76000 and 76120.
Sell below 75300 with the stop loss of 75400 for the targets 75200, 75120, 75020, 74900, 74780, 74660 and 74520.
Always do your analysis before taking any trade.
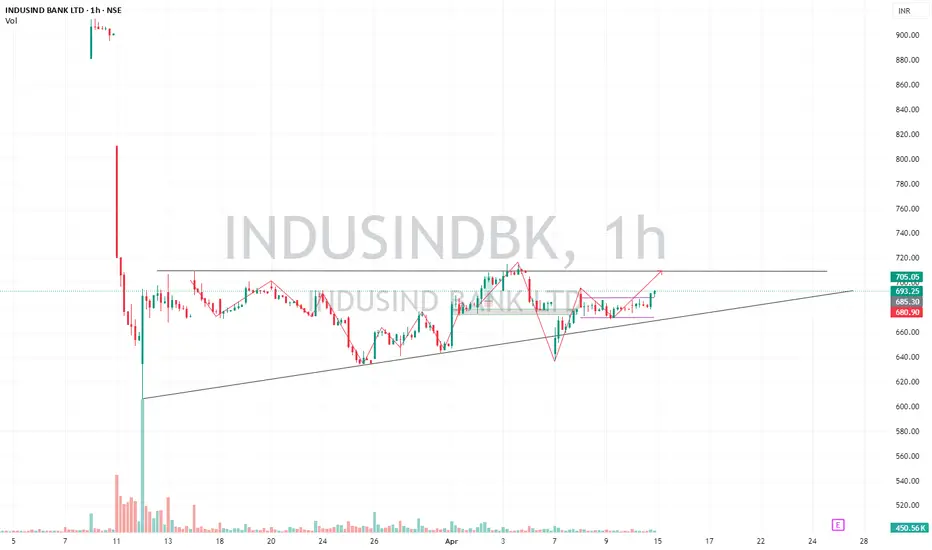
INDUSINDBK-Intraday/short term positional After the big fall, stock is consolidating from last month.
It has formed Ascending tringle pattern. From past 2 days i.e. 8th and 9th April 2025. It is trading in range. which states that buyers are accumulating.
It has potential to move if it opens between 692-700. It may go sideways for one more day it is a good opportunity for Long Intraday/short term positional trade.
If it opens 666, avoid.
Any confusion, feel free to drop msg. Happy to help :)
This is only for educational purpose, please manage your risk accordingly.
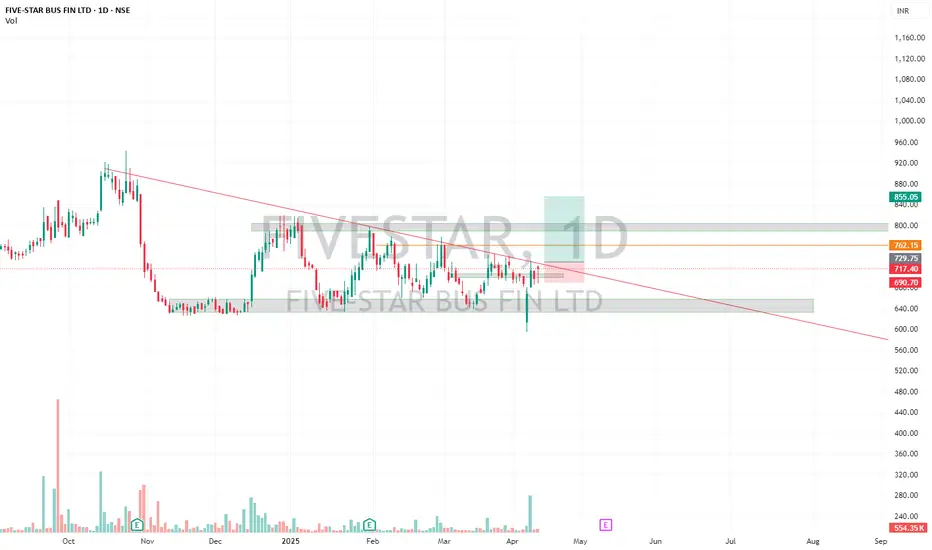
Descending triangle-DailyFIVESTAR-Descending triangle-Daily timeframe
Good Opportunity for short term trade above 737-741, Target-762, 803, 855.
Avoid-Opens gap down 685.
Any confusion, feel free to drop a msg. Happy to help :)
This is only for educational purpose, please manage your risk accordingly.