ANGELONE Classical Textbook Elliott waveIf you don't believe, see it yourself
Classical Textbook Elliott wave forming in ANGELONE
Contracting Triangle
Descending
(Top declining, bottom flat)
Trianglepatterns

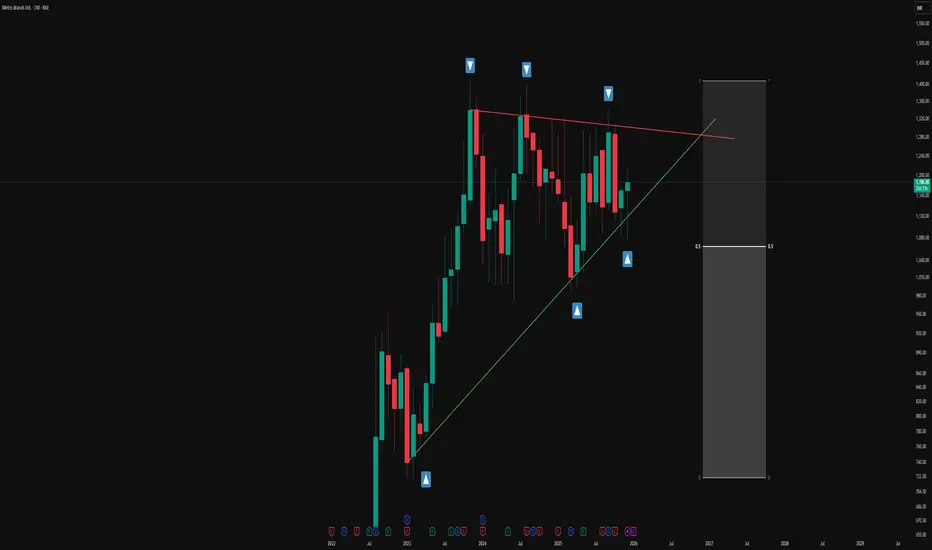
Simple Triangle Pattern on a Monthly Time FrameOverview -
This monthly chart illustrates a symmetrical triangle pattern defined by a series of higher lows and relatively stable swing highs, framed by a green ascending trendline and a red counter-trendline. The structure is presented in an observational manner to highlight how price has evolved within these converging boundaries over an extended period.
Triangle structure -
1.The green line represents the primary trendline, drawn from successive higher swing lows where price has repeatedly found support and turned back up. Each time price touches or approaches this green line, the contact is marked with a blue upward arrow box to emphasize how buyers have consistently responded around this rising level. Together, these points of contact visually document the stepping pattern of higher lows that contributes to the lower boundary of the triangle.
2.The red line acts as the counter-trendline, connecting multiple prominent swing highs where upward movement has stalled and reversed. Blue downward arrow boxes are placed at these touchpoints to highlight how price has respected this sloping resistance zone over time. The repeated interaction with the red line shows how sellers have been active around this upper boundary, creating a series of contained pushes to the upside.
Understanding -
The overall construction emphasizes how multiple touches on both the trendline (T) and counter-trendline (CT) are used to validate the presence of this symmetrical triangle. Rather than focusing on any single candle, the chart showcases the cumulative behaviour of price over many months, making it a useful visual example for studying how support and resistance can evolve into a geometric pattern on a higher time frame.
Disclaimer: This description is purely educational and observational, intended to explain chart structure and pattern formation. It does not constitute investment advice, trade recommendations, or any suggestion to buy, sell, or hold any financial instrument.
GOLDHello & welcome to this analysis
GOLD after a super duper move from AUG - OCT followed by a sharp decline now appears to be consolidating within a triangle.
Currently appears to be in leg D which should be followed by leg E to complete the contracting triangle squeeze and from thereon the resumption of uptrend.
For those new to patterns - triangles are time wise correction that see less price retracement within a longer duration of time. The current triangle appears to be a contracting one.
Leg D could end near 4175 / 125750 approx while leg E could end near 4050 / 122250 approx.
The view would be incorrect if either the current up move goes above 4245 / 127950 without a pullback or the expected retracement goes below 4000 / 121000.
The interesting part here is that GOLD prior to its rally from 3250 was also within a triangle for 4 months. What followed was a parabolic move from a squeeze. Lets see if this one will also give such a move or not.
All the best

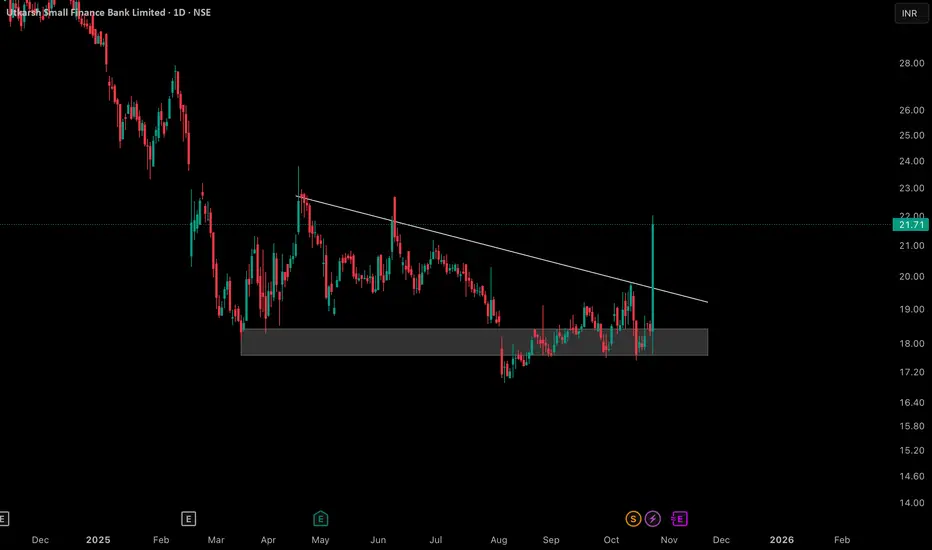
Descending Triangle fake breakdowns explainedThe daily chart for Utkarsh Small Finance Bank Limited displays a well-defined descending triangle, marked by a consistent supply trendline and an established horizontal support zone. During the recent price action, there was a temporary dip below the support, which was quickly retraced as price action returned within the range and formed a distinct lower wick rejection candle at the base.
This chart highlights the role of false moves and re-entries within important technical zones, as well as the reaction to a descending trendline. No trading advice or forecast is implied—this is for educational and analytical purposes, providing an example of how certain classical patterns and market behaviors may unfold within price structure.
Indian Hotels Company stuck in a triangle?Currently, what appears to be a triangle unfolding in Indian Hotels, we may see a fall for a final wave e and then a bounce to make new highs.

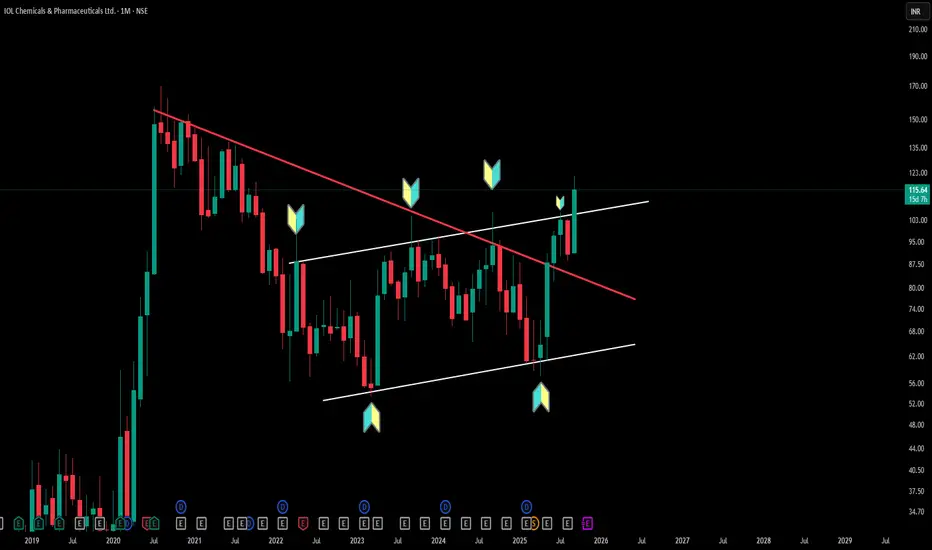
Multi-Pattern Insights: Triangle & Channel Structures (Timeframe: Monthly)
IOLCP's monthly chart perfectly demonstrates how triangle patterns (converging trendlines creating compression) can coexist with parallel channel patterns (equidistant support/resistance lines). Triangle formations indicate price consolidation with diminishing volatility, while parallel channels show consistent bounce zones between defined boundaries.
This multi-timeframe view reveals how experienced chartists identify multiple technical structures within a single timeframe—enhancing pattern recognition skills. Understanding these foundational concepts helps distinguish between different consolidation types and their structural characteristics.
Disclaimer: This analysis is for educational purposes only and does not constitute investment advice. Always conduct your own research before making any trading decisions.
Every Chart Speaks — Learn to Hear It like a PROFrom bearish flags to bullish trendlines and triangles — discover how one stock can tell multiple stories. Start reading charts like a trader, not just a viewer. This video will take you on the journey to love price action and charting .

JSW ENERGY - SwingJSW Energy is transitioning aggressively toward renewables, with investments in solar, wind, energy storage, and green hydrogen.
P/E ratio stands at 46.36, indicating a premium valuation compared to the sector average of 32. While growth is underwhelming, the company maintains good asset quality. Debt levels are manageable, and promoter holding remains strong.
The stock recently showed consolidation between 510 - 530, with support near ₹500 and strong resistance around 540. Technical indicators suggest a bullish bias, with MACD showing early signs of upward momentum. Traders may consider swing opportunities if the stock breaks above ₹542 with volume confirmation.

Transformers and Rectifiers India Ltd (TARIL)TARIL is a small-cap power equipment manufacturer specializing in transformers up to 400kV. It has a strong order book and benefits from government infrastructure and power sector capex. In FY24, revenue grew 25% YoY, with improving margins (8–9%) and profit turnaround. Debt levels have reduced, and cash flows improved. However, the business remains cyclical and exposed to raw material price volatility. With increasing demand from renewables and railways, growth prospects are positive, but valuations and execution risks warrant cautious optimism.

Triangle Breakout is expected in REDINGTON.Elliott wave analysis:-
Running Flat took place with B wave as triangle. now an upside move is expected.
i am not a SEBI registered advisor. Before taking a trade do your own analysis or consult a financial advisor. I share chart for education purpose only. I share my trade setup.

HINDOILEXP - Triangle Breakout A short triangle pattern has been forming since October 2024, and today it broke out decisively with a strong bullish engulfing candle on the daily timeframe. Additionally, a morning star candlestick pattern is evident on the weekly timeframe, reinforcing the bullish outlook.

SHREECEM - Stock to be in RADARView : To be determined
Entry Zone- Once the price breaks out of the triangle in Weekly Timeframe
Timeframe: Weekly
Notes: The price has been consolidating since October 2023, forming a Triangle pattern. Resistance and support levels are marked on the chart, showing how the price has consistently respected these levels.
* This is not a trading recommendation; for educational purposes only

THERMAX - Stock to be in RADARView : To be determined
Entry Zone- Once the price breaks out of the triangle with a strong green candle.
Timeframe: Daily and Weekly
Notes: The price has been consolidating since April 2024, forming a Triangle pattern. Resistance and support levels are marked on the chart, showing how the price has consistently respected these levels.
* This is not a trading recommendation; for educational purposes only

SOUTHWEST - Triangle Breakout with all Hidden trendlinesView : Bullish
Entry Zone- 157- 162 (Triangle break and hidden trendline break)
Exit Zone - Based on Trader mindset. Exit 1 - 188
Exit 2- 215
Exit 3 - 240
Stoploss : Black color Trendline.
Risk/Reward Ratio: 1:1, 1:2 and 1:3
Timeframe: Daily
Notes: Triangle pattern breakout along with hidden line breakout. Price consolidates since Sep 2021.
* This is not a trading recommendation, for educational purposes only

GRINFRA - Stock to be in RADARView : To be determined
Entry Zone- Once the price breaks out of the triangle with a strong green candle.
Timeframe: Daily
Notes: The price has been consolidating since May 2024, forming a Triangle pattern. Resistance and support levels are marked on the chart, showing how the price has consistently respected these levels.
* This is not a trading recommendation; for educational purposes only

NMDCThere are multiple patterns visible here and it seems a breakout is being prepared considering all the patterns.
I see a large triangle formation breakout inside which a Wolfe Wave was already working and some of you know how much I love the Wolfe Wave.
Further the price action has taken supports multiple time from the same trend line.

Bank Nifty - Will This Be Wave E towards 52000+ As discussed last .....BankNifty unfolding a triangle & again took support close to 51000 which is most important support zone 50800-51000
Can we get Wave-E upside & achieve 800-1000 points target upside
Strictly -----No Buying ------If Index drops below 51000 ...................
Regards,
WaveTalks
Abhishek

4 Amazing swing trade ideas for 6 Nov 2024 Markets I make educational content videos for swing / positional trading

SHALBY - Stocks to be in RADARPrice consolidating since September 2023 and respecting the trendline at 230 Range. It is forming good triangle structure now. We can enter once it breakout the triangle.

GHCL : Descending Triangle Pattern Breakout with huge volumesGHCL breaking out from a triangle pattern breakout in a weekly timeframe with a decent buying volumes. It can rise upto the initial triangle pattern target 🎯 of 900.
🔰 I've indicated two scenarios of the stock to reach its target 🎯.
🟢 Range : 620-630
🎯 Target : 700 / 800 / 900
🛑 Stop : below 500 (wcb)
⚠️ Disclaimer : it's not a buy/sell advice, it's only a view on the stock for the educational purposes.

STYLAM INDUSTRIES - Traingle BreakoutPrice is respecting the trendline from June 2023 and it is now breakout the triangle.
2. First target will be 2000
Please like and share if you like this idea.
Chart is Self Explanatory. I am not SEBI registered advisor and all Ideas posted by me are for Educational Purpose.

VISHNU CHEMICALS - Triangle BreakoutPrice is forming triangle since Feb 2022 and it breakout this week. Good trade for short term.
However, NIFTY is near resistance and we have to wait until this weekend before enter in to trade.
Chart is Self Explanatory. I am not SEBI registered advisor and all Ideas posted by me are for Educational Purpose.

bajajfinsv made triangle pattern watch for breakoutWatch for Triangle Pattern Breakout in Bajajfinsv. Currently in consolidation can see good upmove in coming days
