Vedanta for a fall.Vedanta for a fall.
In the first long term wave, we are in the second correction of the wave two and if you see the wave, it is in a third wave fall of the 3 sub waves which could be as deep as .618 fib levels as per me.
Also, it is now at a triangle resistance at the top of the trend line if you see the dark white line and the volumes have weakened significantly with no buying momentum. The fundamentals are bad with a 61 percent los QoQ. Plus, commodities and interest rates have an inverse relationship because higher interests lead to increased cost of holding and weakens demand. Now with the potential rate hikes on cards, my view of Vedanta is a fall with a target of 253.
If we open below the 274 support line, it is a further confirmation. For safety, it can be taken when the triangle breaks down.
The metal index also seems to be in the second corrective wave and with rate hikes, a correction seems on the way.
Trianglepattren

Triangle Pattern & Psychology behind itSymmetrical Triangle Pattern & Psychology behind it
NSE:GESHIP - Triangle pattern on the verge of breakout
Everything is explained on the chart itself.
Entry can be made after the breakout. R:R should be according to appetite. This is no trade recommendation in any way.


Symmetrical triangle pattern reversal in GUJGASLTD. GUJGASLTD ( GUJARAT GAS LIMITED)
Key highlights: 💡⚡
📈 On 1D Time Frame Stock Showing Reversal of symmetrical Triangle Pattern.
📈It can give movement upto the Reversal target of 3250+.
📈There have chances of breakdown of support level too.
📈 After breakdown of support level this stock can gives strong down side rally upto -310.
📈 Can Go Short in this stock by placing stop loss Above 528 or last swing high.
📈 After breakdown this can give risk:reward up to 1:3+.

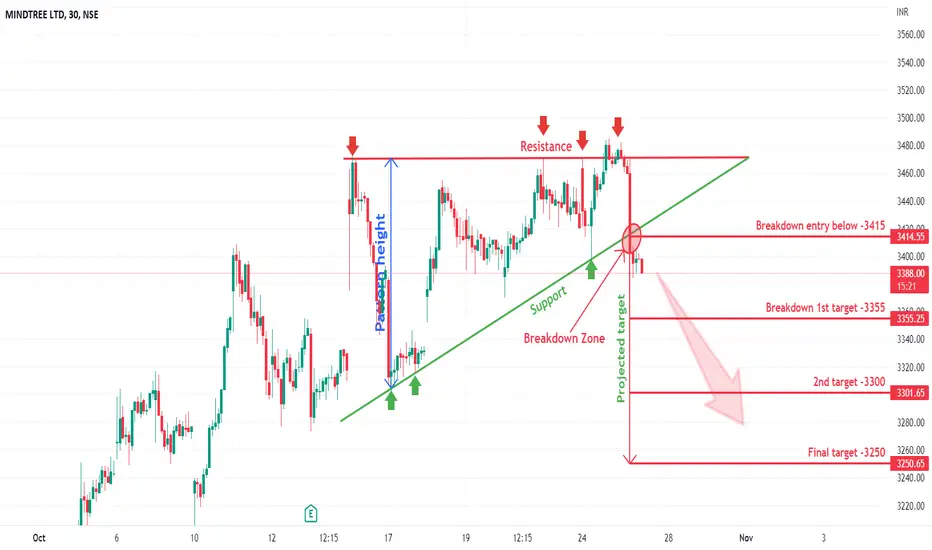
Triangle pattern breakdown in MINDTREE.In 30Min timeframe MINDTREE stock has given breakdown to triangle pattern with a breakdown entry below 3415- there are chances of going up to their Short target of 3250+.
KDDL LTD. UPDATETRIANGLE BREAK 21% AND RUNNING. after perfect triangle pattren break KDDl is ready for a big run.

Parallel channel - Looks good4 hours time frame
Good opportunity, add to your watchlist and take advantage.


PAGEIND - Channel patternChannel pattern - good opportunity, but wait for the confirmation and take advantage.
Add to your watchlist.

CGCL analysisformation of triangle pattern in stock
watch for breakout or breakdown
fundamentally a good stock
having support of long term trendline

United poly triangle breakout potential of 15-25% returns🔥🔥NSE:UNITEDPOLY
United poly triangle breakout potential of 15-25% returns🔥🔥
follow for more ideas 🙏


Consolidation for new trendstock forming kind of triangle pattern
getting support of trend line both side
wait for break out or breaks down
Borosil Renewables Ltd. engages in manufacturing and sale of solar glass. The firm operates through the following geographical segments: Within India and Outside India.
52 WK HIGH LOW 833 - 320

APARINDS - Breakout of a Triangle pattern - Short term SwingThe analysis is done on daily TF hence price may take few days to few weeks in order to reach the targets.
Trade setup is explained in image itself.
The above analysis is purely for educational purpose. Traders must do their own study & follow risk management before entering into any trade
Checkout my other ideas to understand how one can earn from stock markets with simple trade setups. Feel Free to comment below this or connect with me for any query or suggestion regarding this stock or Price Action Analysis.


UBL Ascending triangle !!NSE:UBL
#NSE:UBL formed Ascending triangle in 4 months consolidation, any time may show very good momentum !!


Divis Lab possibility of going bearish for short term.As you can see Divis Lab is on the way to downside, in minor Wave E forming a Triangle pattern.
As per EWT minutte wave (c) can travel till fibo ratio 1 or 1.2 which are also my target.
But a trader must be cautious if it breaks the invalid level of 3710, if this level breaks above all study/ Analysis will be invalid.

Mindtree chart analysisMindtree on 1H timeframe
forming symmetrical triangle pattern
can take support from here
more downside if breks down the line

BEL can go long, triangle breakout given.As per above chart BEL has given a triangle breakout which is end of Wave 4 and can go above for till those two target 264, 298
