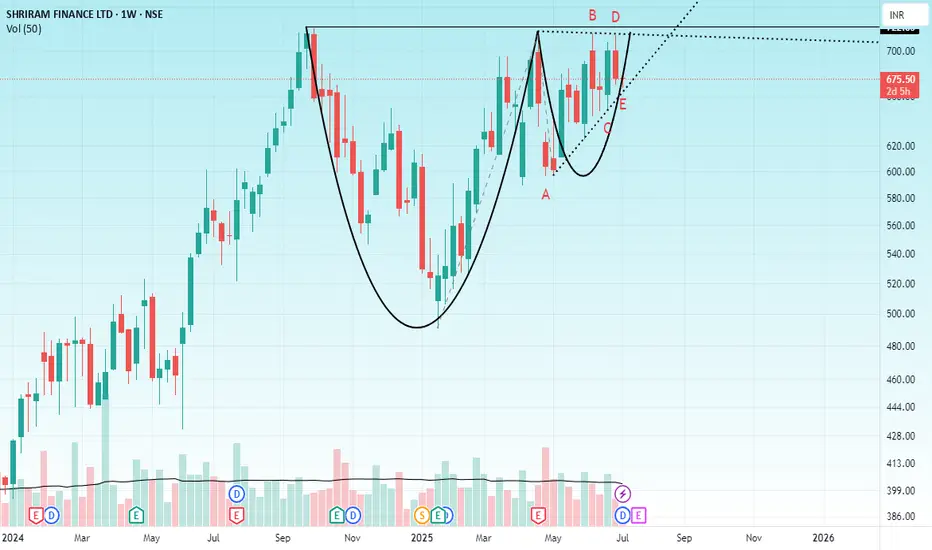
SHRIRAM FINANCEHello & welcome to this analysis
After a very strong uptrend the stock went into a consolidation to form a cup & handle pattern, the handle being completed now in the form of a triangle.
As long as it does not break below 640 it has a high probability of breaking above the trendline at 700 for targets of 800 / 875 / 950
Good risk reward set up at the moment.
All the best
Trianglepattren
Samvardhana Motherson BreakoutMOTHERSON Stock Analysis
MOTHERSON stock is breaking out again on the monthly chart after previously reaching a new all-time high and then declining. It recently broke the trend-line with good buying pressure. The target could be the all-time high or lower, but it may take a few months to reach if things go well. Stop-loss should be set based on individual risk appetite.
Index Inclusion : Part of NIFTY NEXT 50 and NIFTY 100 indices, indicating significant market presence.
Financial Highlights:
- Revenue Growth : Consistent increase over recent quarters, reaching Rs 113,662 crore in Mar 2025.
- Net Profit : Also rising, with Rs 3,618 crore in Mar 2025.
- EPS : Improved to Rs 5.50 in Mar 2025.
- Annual Revenue & Profit : Steady growth over the past five years, with revenue surpassing Rs 113,662 crore and net profit over Rs 3,618 crore in 2025.
Financial Performance:
- Profit Margins : Net profit margin around 3.18% in Mar 2025.
- Valuations : P/E ratio at approximately 23.81, indicating moderate valuation.
- Debt Levels : Debt-to-equity ratio at 0.42, reflecting manageable debt.
- Cash Flow & Balance Sheet : Operating cash flow remains strong; assets and liabilities Show growth aligned with revenue expansion.
These financial insights are sourced from Moneycontrol.
Conclusion :
Motherson International shows a consistent growth in revenue and profits, with stable financial ratios and manageable debt levels. Its inclusion in major indices and recent financial performance suggest it remains a significant player in its sector. However, the recent stock decline indicates market caution, so investors should monitor market sentiment closely.
This is for educational purposes only and not a buy or sell recommendation.

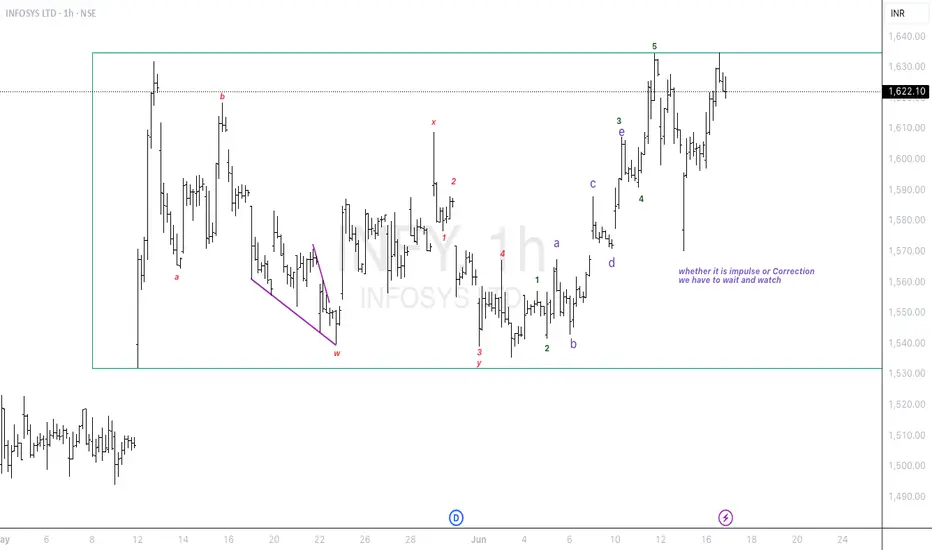
Infosys impulse or correction continuation.....
Elliott Wave Analysis:-
Possibility no.1:-
A corretion has been completed. Now an impulse wave has beed arised.
Possibility no.2:-
After the correction of WXY wave there may be a correction continuation which may form WXYXZ. We have to wait and watch the structure formation.
I am not a SEBI registered advisor. Before taking a trade do your own analysis or consult a financial advisor. I share chart for education purpose only. I share my trade setup.
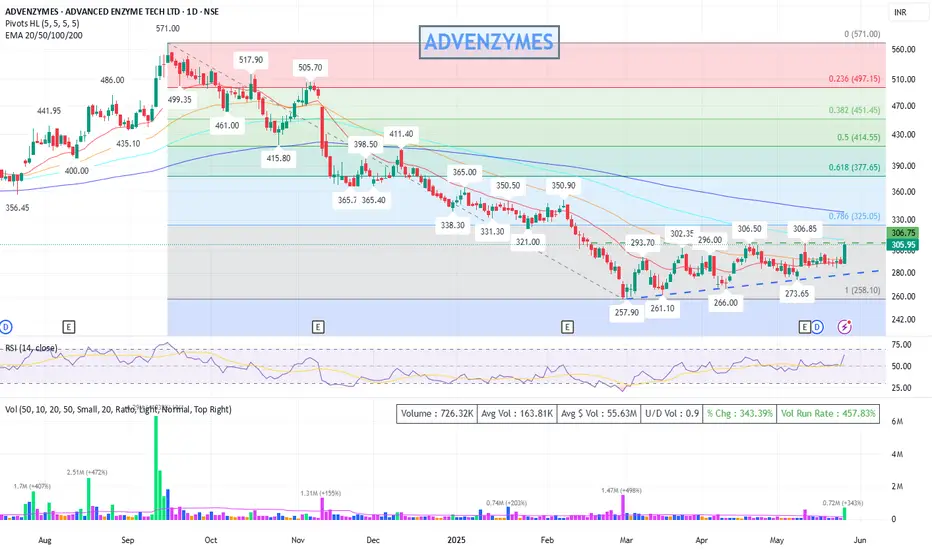
Bullish structure : ADVENZYMES - Ascending Triangle
### 🧾 **Chart Type & Time Frame**
* **Daily Candlestick Chart** (1D)
* **Exchange**: NSE (India)
* **Latest Price**: ₹305.95 (+6.12% on the day)
* **Volume**: 726.33K (well above average — **457.83%** Volume Run Rate)
---
### 📉 **Trend Analysis**
* **Primary Trend**: Downtrend from ₹517.90 (high in Nov 2024) to a bottom around ₹257.90 (March 2025).
* **Current Action**: Price is showing a **potential reversal** from a long downtrend.
* **Higher Lows Pattern**: Since the bottom at ₹257.90, price has made:
* ₹261.10 → ₹266.00 → ₹273.65 → ₹306.85 → (Now breaking above ₹306.75)
This forms an **ascending triangle** pattern (bullish bias).
---
### 📊 **Indicators & Overlays**
#### 1. **Moving Averages (EMA)**
* EMA levels:
* EMA-20: ₹290.07
* EMA-50: ₹292.01
* EMA-100: ₹310.17
* EMA-200: ₹337.89
**Current price (₹305.95)** is:
* Above EMA-20 & EMA-50 → Short-term bullish
* Slightly below EMA-100 and EMA-200 → Mid-to-long term resistance still ahead
If it breaks and sustains above EMA-100 & EMA-200, stronger uptrend confirmation.
---
#### 2. **Fibonacci Retracement (from ₹571 to ₹258)**
* **Key levels:**
* 23.6% → ₹497.15
* 38.2% → ₹451.45
* 50% → ₹414.55
* 61.8% → ₹377.65
* 78.6% → ₹325.05 *(Immediate target zone)*
**Price approaching 78.6% retracement (₹325.05)**, which is a key resistance zone. A breakout here can push prices towards ₹337-₹350 zone.
---
#### 3. **RSI (14, Close)**
* Current RSI: **\~62.90**
* Moving above the 60 level, indicating building bullish momentum.
* Still not overbought (>70), room for upward move exists.
---
#### 4. **Volume**
* Spike in volume on the breakout day → Strong confirmation.
* Today's volume: **726.33K** vs average 163.81K → Over **4x average**.
---
### 📌 **Support & Resistance Levels**
#### Key Resistance:
* ₹306.85 (recent swing high) → **Broken today**
* ₹325.05 (Fibo 78.6%)
* ₹337.89 (EMA-200)
* ₹350–365 (previous price clusters)
#### Key Support:
* ₹293–296 (previous resistance, now support)
* ₹273.65 (swing low)
* ₹258 (Fibo 100% level)
---
### 🔺 **Pattern Observed**
* **Ascending Triangle** breakout confirmed with high volume
* Bullish structure: Higher lows with flat resistance (₹306 zone)
* If price sustains above ₹306, could target ₹325–₹350 short term
---
### 🔮 **Conclusion & View**
✅ **Bullish Bias in Short Term**
* Breakout of important level with strong volume
* RSI supportive
* EMA crossovers may follow if trend continues
📈 **Short-Term Target**: ₹325 → ₹337 → ₹350
📉 **Stop Loss**: ₹293 or ₹280 (based on risk appetite)
📌 Disclaimer: This analysis is for educational and informational purposes only and does not constitute investment advice. Please do your own research or consult with a financial advisor before making any trading decisions. Markets are subject to risks.
Amber Enterprise - Symmetrical Triangle Breakout from a Symmetrical triangle on a weekly chart
Triangle Height : 2100 points
Breakout above 6650 (breakout done)
Target : 8740 (Return 31-32%)
#Medium Term Trade.
Indicators are also showing strength for upside.

NIFTYHello & welcome to this analysis
There is a good chance of the narrow range bound action that we are witnessing in the index to continue probably till the RBI policy, after that it could attempt a break on the upside.
The triangle outlook will be invalid if spot breaks 24525 on the downside.
Broader market specially Mid & Small caps continue to seeing buying.
Regards

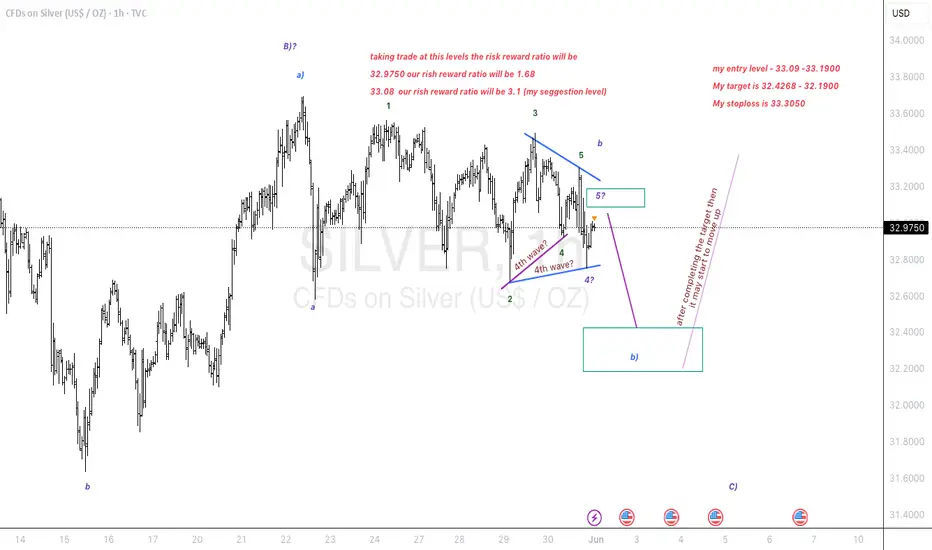
Triangle breakout in silver. Down to earth..
Elliott Wave Analysis:-
1st possibility:- (look Previous chart published)
Silver is in a triangle breakout. if it is getting towards upside breakout then we have a nice opportunity of pullback and and we can add it if the pullback occurs. else we can enjoy this journey quietly.
2nd possibility:-
Silver had already made a pullback towards down side breakout. Once it start the way it will fly towards downside and then it will complete a C wave in whole B wave then upside C wave will be impulsive.
My Entry, Stop, Target all have been discussed.
My suggestion to take a trade at this place to reduce the risk better reward.
I just spoke what chart whisper's in my ear.
I am not a SEBI registered advisor. Before taking a trade do your own analysis or consult a financial advisor. I share chart for education purpose only. I share my trade setup.
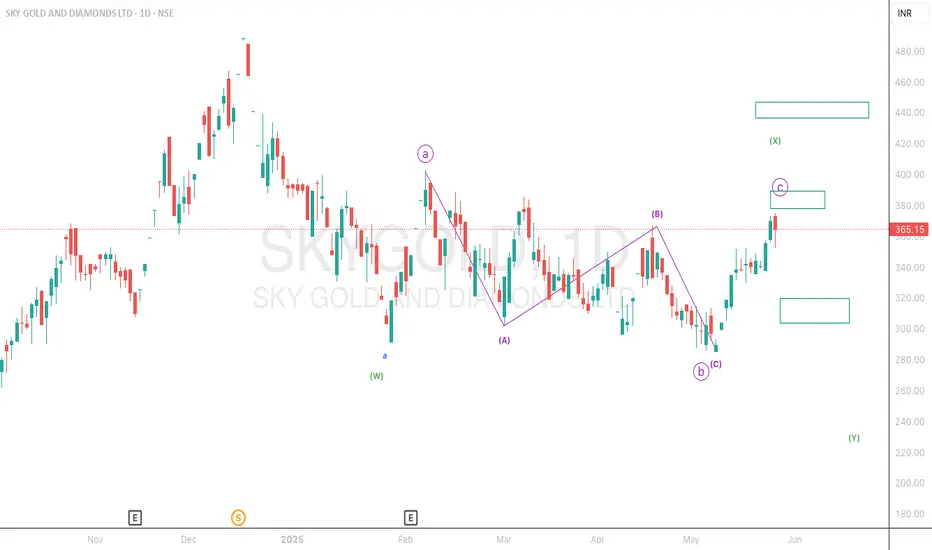
Too cloudy in sky gold and diamond..A consolidation phase is going on. as of now this script having correction or pullback value of 78.6% as its nature.
We need to wait and watch till the clouds disappear..
i am not a SEBI registered advisor. Before taking a trade do your own analysis or consult a financial advisor. I share chart for education purpose only. I share my trade setup.
End of correction in Hinduja Global SolutionsElliott wave analysis:-
A long bear trend has been almost over and we may expect a slight fall from here or the Candle may rise to stars from here. if you wish to be cautious then wait for a pullback for almost 65% to 78%. keep the previous low as your stop loss go for a long ride.
i am not a SEBI registered advisor. Before taking a trade do your own analysis or consult a financial advisor. I share chart for education purpose only. I share my trade setup.

Triangle Breakout is expected in REDINGTON.Elliott wave analysis:-
Running Flat took place with B wave as triangle. now an upside move is expected.
i am not a SEBI registered advisor. Before taking a trade do your own analysis or consult a financial advisor. I share chart for education purpose only. I share my trade setup.

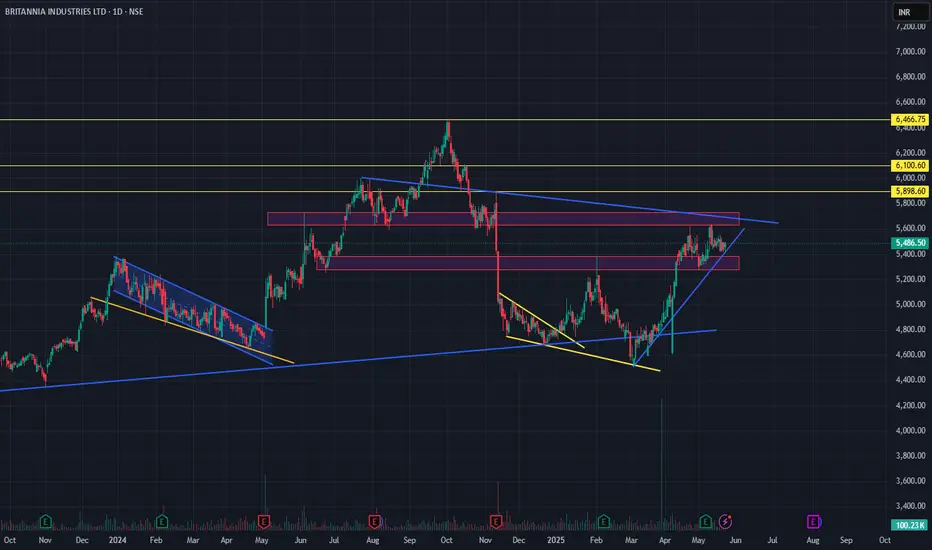
Britannia Industries – Triangle Breakout Loading?NSE: BRITANNIA | CMP: ₹5,486.50 | Timeframe: Daily
Britannia is approaching a crucial symmetrical triangle apex, formed by a long-term descending resistance and a recent ascending trendline. The price is compressing — signaling a potential breakout soon.
🔍 Key Levels:
Resistance: ₹5,890 (triangle top + horizontal zone)
Support: ₹5,280–5,400 (demand zone)
Targets on breakout: ₹6,100 → ₹6,466
📊 Structure Highlights:
Previous falling wedge breakout led to a solid uptrend.
Current price action shows higher lows, indicating strength.
Breakout + volume = bullish confirmation.
🧭 Strategy:
Bullish bias above ₹5,890 with volume.
Watch for invalidation if price breaks below ₹5,280.
📌 Tight consolidation = Big move ahead. Add to watchlist!
AKUMSAKUMS seems stronger and given triangle breakout. Volume is also very decent as its just 1st hour of trading and almost nr previous day volume. We may see momentum rally nearing 12-15% from here as long as its closing above this trendline it may continue to outperform. Risk reward is quite good. Result is on 26th may. Keep it on radar

New opportunity; Nupur Recyclers ltd: 70% Roi ; SwingAdd this to watchlist and wait for entry.👁️🗨️
For short term investment ;
Leave a " Like If you agree ".👍
.
Wait for small retracement & daily candle to close above - "66".
Trade carefully untill ENTRY level.
.
Entry: 66
target:75-90-100-110-121
sl:57
major stoploss/ support: 50
.
.
Enter only if market Sustains above
"Yellow box" mentioned.
.
.
Don't make complicated trade set-up.📈📉
Keep it " simple, focus on consistency "💹
Refer our old ideas for accuracy rate🧑💻
Follow for daily updates👍
.
Refer old posted idea attached below.


CHFJPY triangle formed big rally ahead#CHFJPY
Sharing a perfect trade, please take a look at below Image,
As per EWT wave 4 Triangle is formed, is near a demand area
wait for price to react .
and the trade starts boom 💥🚀🚀 wave 5 - approx. 400 pips move.

SBICARD: Monthly Pennant Breakout - How High Can It Fly?NSE:SBICARD
The stock has given a pennant pattern breakout on monthly chart with good volume along with second month on consecutive buying
This month's closing would be interesting to watch as it'd confirm the follow on move
916.95 / 946 / 1149 will act as strong resistance levels especially 1149 which is around it's ATH level a monthly close above it will fuel the further rally.
Since it's ATH in September 2021 stock has been in a downtrend but seems like things are about to change for good
SBI Cards & Payment Services is India's second-largest credit card issuer and a subsidiary of SBI.
Market Position :
SBI Cards is a leader in the credit card industry, holding an 18.5% market share in card-in-force and a 15.7% share in spending. You'll find them actively expanding into Tier-2 and Tier-3 cities to tap into new markets. Plus, partnerships with brands like Apple and Singapore Airlines help them attract premium customers.
Recent Financials (Q3 FY25):
Revenue: ₹4,767 crore (up 1% YoY).
Net Profit: ₹383 crore (down 30% YoY).
Net Interest Income (NII): ₹3,790 crore (down 3.5% YoY).
Asset Quality: Gross NPA at 3.24%, Net NPA at 1.18%.
9-Month Performance (9MFY25):
Revenue: ₹14,300 crore (up ~2% YoY).
Net Profit: ₹1,200 crore (down ~25% YoY).
Where is SBI Cards Headed?
Management is optimistic, projecting annual revenue growth of 10%-15% over the next two years. The plan involves:
Tapping into smaller cities to bring in new customers.
Boosting the digital experience for seamless customer interactions.
Launching exciting co-branded cards aimed at high-value users.
And don't forget, potential RBI rate cuts in FY26 could lower borrowing costs and boost the bottom line.

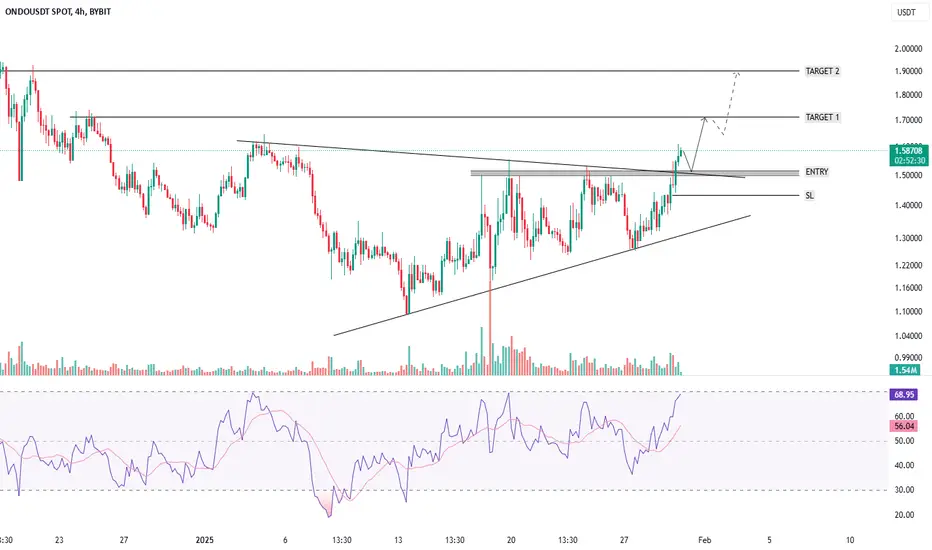
ONDOUSDT - TRIANGLE PATTERN BREAKOUT - BULLISH OUTLOOKSymbol - ONDOUSDT
ONDOUSDT continues to demonstrate an upward trend, with periodic cyclical counter-trend corrections. The chart is currently indicating a potential conclusion of the correction phase, suggesting a readiness for further upward movement. A significant consolidation pattern has developed within the context of the prevailing uptrend. In this regard, the price is attempting to break above the consolidation resistance (triangle) and surpass the next key resistance level at 1.538. This level is of particular importance. Should the bulls successfully maintain support above 1.538, ONDO may experience a recovery towards the 1.7–1.9–2.15 range in the short to medium term.
Support levels: 1.538, 1.44
Resistance levels: 1.7344, 1.90
A minor pullback to support, followed by a false breakdown, remains a possibility. However, sustained price consolidation above this level would confirm readiness for upward movement. Entry, SL & Target levels are indicated on the chart.
#BHARTIARTL - Potential Trend Line Break Out📊 Script: BHARTIARTL
Key highlights: 💡⚡
📈 VCP formation in Daily chart.
📈 Price gave a good up move, then went Side Ways
📈 wait for more consolidation near Resistance / Trend Line
📈 Enter on BO when spike in Volume is seen
📈 MACD Bounce
📈 One can go for Swing Trade.
BUY ONLY ABOVE NA DCB
⏱️ C.M.P 📑💰- 1644
🟢 Target 🎯🏆 – NA%
⚠️ Stoploss ☠️🚫 – NA%
⚠️ Important: Always Exit the trade before any Event.
⚠️ Important: Always maintain your Risk & Reward Ratio.
✅Boost, Like and follow to never miss a new idea! ✅
Disclaimer: I am not SEBI Registered Advisor. My posts are purely for training and educational purposes.
Eat🍜 Sleep😴 TradingView📈 Repeat 🔁
Happy learning with MMT. Cheers!🥂

MAN INFRA: potential upside move<Man infra has successfully given breakout of two good chart patterns.
<Flag and pole which is clearly visible.
<Triangle pattern which can be seen if we draw a line from top red candle to the <breakout candle respecting all the wicks.
<We are learning this trade respecting the flag pattern.
<The stock has given upside breakout with good volume indicating bulls hold.
<The risk reward ratio for the trade is 1:5.

Tilak Nagar triangle pattern breakout expectedWinters are here and liquor sales are going rocket.
Tilaknagar allied blenders united spirits all are expected to go high next quarter numbers will give more boost to this rally

Light crude oil, offering potential +33% return on investmentA triangle pattern formed in Light crude oil Futures. A breakout above this pattern could lead to the market reaching the target of USD 95. Offering a potential +33% return on investment. Best of luck!

SHAKTIPUMP RESISTANCE BREAKOUTSHAKTIPUMP, currently trading at ₹899.35, has shown a solid breakout above the marked resistance levels on the chart, indicating a strong potential for upward momentum in the coming weeks. Additionally, the stock has confirmed an ascending triangle breakout, reinforcing the bullish sentiment beyond the resistance level. This is a clear example of effective price action. The technical indicators look promising, with volumes steadily building up over the past few days, supporting the recent breakout.

Wisdomtree crude oil, potential +30% return on investmentA triangle pattern formed in Wisdomtree WTI crude oil. A breakout above this pattern could lead to the market reaching the first target of EUR 12. Offering a potential +30% return on investment. Best of luck!
