TVS Electronics: Falling Wedge Breakout (Volume Confirm Pending)The Technical Setup TVS Electronics (NSE: TVSELECT) has been in a corrective structure for months, forming a classic Falling Wedge Pattern. This pattern typically signals that selling pressure is exhausting.
Current Observations:
Structural Break: The price has successfully closed above the upper resistance trendline of the wedge (~500 levels).
Momentum Divergence: While the price has broken out, the volume is currently below the 30-day average.
The Missing Link: For a high-probability reversal, we typically look for a "Volume Expansion" to prove institutional interest. The current move is price-led, not participation-led.
Key Levels to Watch:
Invalidation Zone: If the price slips back inside the wedge (below ~480), the breakout may be a "False Move."
Confirmation Zone: A strong daily close above the recent swing high (~525) with rising volume would validate the reversal.
Technical Resistance: Structurally, the previous supply zones exist near 630 and 670.
Risological View: This is a "Watchlist Candidate." The structure is perfect, but the fuel (Volume) is missing. We are waiting for the "Smart Money" footprint before considering the trend changed.
TVSMOTOR

TVSMOTOR's DOWNTREND OVER? NSE:TVSMOTOR
Price was in a clear downtrend earlier with lower lows. But notice the change in behaviour :
The last big down-leg was not able to break the previous low – sellers lost strength.
From that low, price bounced up with strong volume, showing fresh buying interest.
After that, price has been holding around the same zone for ~15 days, moving in a tight range instead of falling back. This looks like supply getting absorbed near resistance.
NSE:CNXAUTO chart also gave initial breakout from tight range.
Heres the 30 min chart
For me this is a potential range-breakout setup:
Entry: Above the range high around ₹3,505 on a strong candle.
Stop-loss: Below the range low near ₹3,460.
First target: Around ₹3,560.
Extended target: Near the next resistance zone around ₹3,600+ if momentum continues.
Plan is simple – as long as price stays above the breakout level, bias is bullish. A breakdown back inside the range or below ₹3,460 will invalidate the idea.
Study the chart and then act with probabilities.
Keep Learning
Happy Trading.

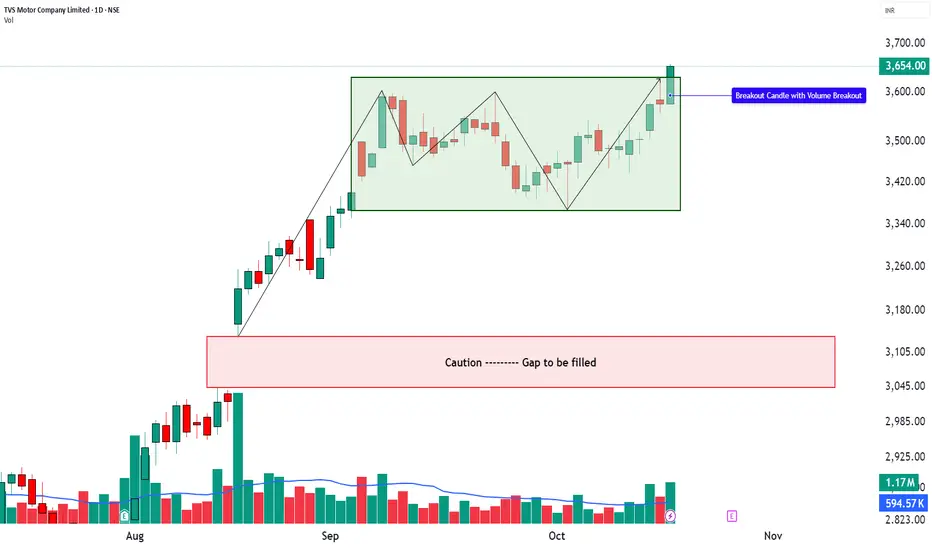
TVS Motor | 52-Week Breakout Case Study________________________________________
🏍️ TVS MOTOR (NSE: TVSMOTOR) | CMP 3,658.00
Sector: Auto & 2-Wheeler | Date: 19 Oct 2025
________________________________________
📊 Chart Summary
TVS Motor has delivered a 52-week breakout with a strong bullish Marubozu candle, signalling aggressive buying momentum.
The stock closed firmly near day’s high, reinforcing confidence among participants.
This move comes after a sustained consolidation phase, with volumes spiking well above the short-term average — confirming institutional and HNI participation around the 3,650 zone.
Structurally, the stock is transitioning from a Consolidation Phase into an Expansion Phase, marking the possible beginning of a fresh markup leg.
________________________________________
🟡 Technical Indicators Summary
The chart highlights Bullish Momentum supported by a Strong Bullish Marubozu, indicating conviction among buyers.
A clear RSI breakout (76) confirms strengthening momentum, while the Bollinger Band breakout and BBSqueeze-Off suggest volatility expansion — often preceding strong directional moves.
MACD at 5.54 shows a positive crossover, CCI 205.96 signals extended strength, and Stochastic 98.62 confirms short-term over-extension yet strong momentum.
VWAP support at 3,639.46 keeps intraday trend structure intact.
This confluence reflects multi-indicator alignment — the kind of structure often seen in sustained breakout phases.
________________________________________
📈 Price Action & Key Levels
Resistance: 3683 / 3712 / 3765
Support: 3600 / 3547 / 3518
VWAP: 3639.46
The breakout occurred above 3,658, which now acts as a pivot zone.
Sustaining above this level could keep momentum active, whereas any dip toward VWAP or ₹3,600 may offer short-term retest potential.
________________________________________
🧭 STWP Trade Analysis
Bias: Bullish
Breakout Level: Above 3658
Intraday Support: 3626
Swing Support: 3501
Intermediate Support: 3274
Momentum: Moderate
Trend: Neutral (Turning Bullish)
Risk: Low
Volume: High
📌 Observation: The strong candle structure backed by volume and RSI expansion suggests continued bullish sentiment.
A possible HNI setup was visible near 3654–3658 with support at 3518, while a lower build-up setup is also seen near 3647 with support at 3493 — confirming tiered accumulation.
________________________________________
🧭 STWP Note – Gap-Up Retest Zone
If TVS Motor opens gap-up above ₹3,658, key pullback levels to watch are ₹3,639 (VWAP), ₹3,547 (EMA support), and ₹3,443 (0.786 Fibonacci level). A mild, low-volume pullback toward these zones would represent a healthy retest within the ongoing expansion phase. The breakout remains valid and momentum bullish as long as price holds above ₹3,443.
________________________________________
📘 Learning Perspective (Educational Insight)
TVS Motor’s setup illustrates how multiple bullish confirmations (RSI breakout, MACD crossover, BB expansion, and VWAP strength) can align during a 52-week breakout phase.
The pattern teaches traders to spot volume-backed momentum near higher-timeframe resistance zones — a sign that larger players may be entering.
________________________________________
🧩 Final Outlook
TVS Motor currently displays:
Momentum: Moderate
Trend: Neutral turning Bullish
Risk: Low
Volume: High
While KST remains mildly bearish (34.45), the overall setup hints at a momentum continuation phase, provided the stock sustains above 3626–3600 levels.
Traders should watch price action around 3,683–3,712 for confirmation of follow-through strength.
________________________________________
💬 STWP Mentor Note
When multiple indicators speak in one direction — price, volume, and structure often follow. Watch how VWAP and RSI behave in the next few sessions; that’s where breakout traders can learn the art of patience and precision.
________________________________________
⚠️ Disclosure & Disclaimer (SEBI-Compliant)
This content is created solely for educational and informational purposes to help readers understand technical analysis and market structure.
It does not constitute investment advice, research recommendation, or a solicitation to buy or sell any security.
The author is not a SEBI-registered investment adviser or research analyst.
All charts, patterns, and levels are based on personal study and historical data available from public sources such as TradingView and NSE India.
Position Status: No active position in TVSMOTOR at the time of publication.
Trading and investing involve risk. Market movements can be unpredictable, and losses may exceed invested capital.
Readers are strongly advised to consult a SEBI-registered investment adviser before making any trading or investment decisions.
By engaging with this post, you acknowledge that you take full responsibility for your own trades, decisions, and outcomes.
________________________________________
💬 Found this useful?
🔼 Boost this post to support structured learning content.
✍️ Share your thoughts, questions, or observations — let’s grow together!
🔁 Share with learners and traders to promote responsible market education.
👉 “If you liked this breakdown, follow for more disciplined, educational trade setups.”
🚀 Stay Calm. Stay Clean. Trade With Patience.
Trade Smart | Learn Zones | Be Self-Reliant 📊
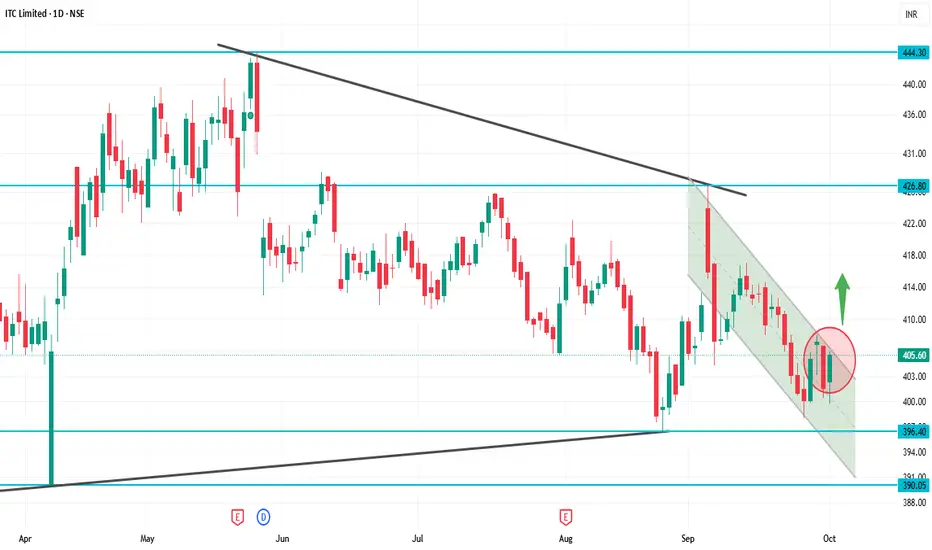
ITC 1D Time frameCurrent Price: ₹405.60
52-Week High: ₹524.35
52-Week Low: ₹390.15
Trend: Downward — trading below 5, 20, 50, 100, 200-day moving averages
Daily Chart Insights
Price below moving averages → bearish trend.
RSI & MACD → weak momentum, signaling short-term selling pressure.
Support zone at ₹390–₹400 → critical; a break below can push price down to ₹370–₹380.
Resistance at ₹420–₹430 → a strong close above may signal trend reversal.
Strategy / Outlook
Bearish Bias: Short-term trend is downward.
Buying Opportunity: Near support zones (₹390–₹400) if it holds.
Bullish Trigger: Close above ₹430 with strong volume indicates potential reversal.
Risk Management: Use stop-loss below critical support zones.
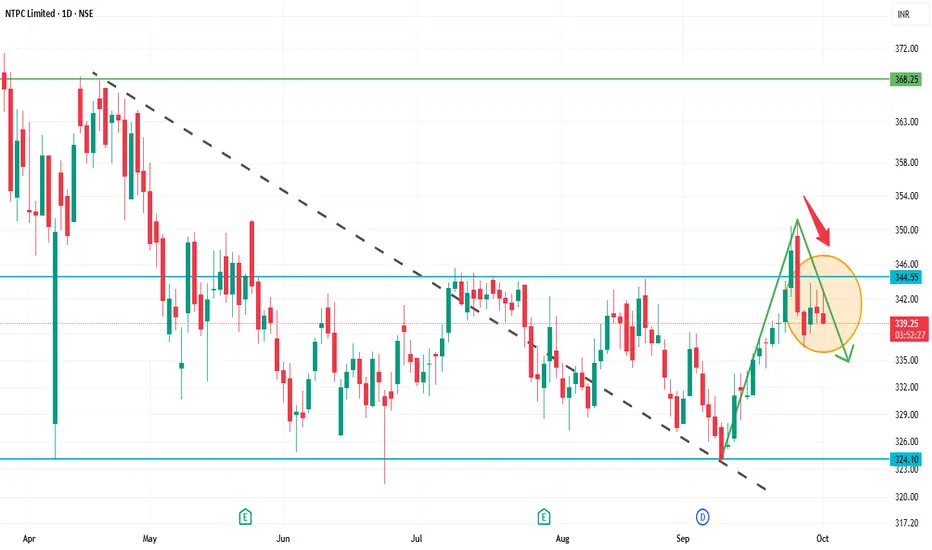
NTPC 1D Time frameOpening Price: ₹340.30
Closing Price: ₹340.25
Day Range: ₹339.45 – ₹343.05
📉 Trend Analysis
Short-Term Trend: Bearish — The stock is trading below key moving averages, confirming the bearish trend.
Medium-Term Trend: Neutral — The stock is in a consolidation phase, characterized by lower highs and lower lows.
Long-Term Trend: Neutral — No significant trend identified; the stock is trading within a range.
🔮 Conclusion
NTPC Ltd. is in a bearish trend with weak momentum.
Break below ₹335.00 could lead to further decline toward ₹330.00.
Break above ₹347.00 would indicate a potential trend reversal.
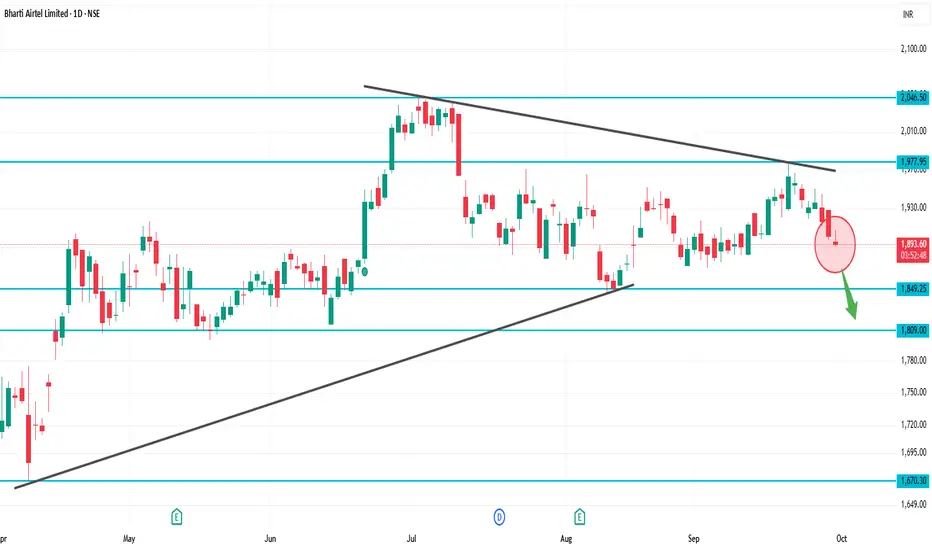
BHARTIARTL 1D Time frameCurrent Price Snapshot
Current Price: ₹1,897.80
Day’s Range: ₹1,890.80 – ₹1,907.60
52-Week Range: ₹1,511.00 – ₹2,045.80
Technical Indicators
RSI (14-day): 44.19 — indicates a neutral to slightly bearish momentum.
MACD: -4.010 — suggests bearish momentum.
Moving Averages:
5-day: ₹1,896.00 — indicates a Sell signal.
50-day: ₹1,890.00 — indicates a Sell signal.
200-day: ₹1,850.00 — indicates a Buy signal.
Technical Summary: Predominantly Sell signals across various indicators.
Summary
Above ₹1,907.60: Potential rise toward ₹1,920 – ₹1,940.
Below ₹1,890.80: Potential fall toward ₹1,880 – ₹1,860.
Between ₹1,860 – ₹1,900: Likely range-bound movement.
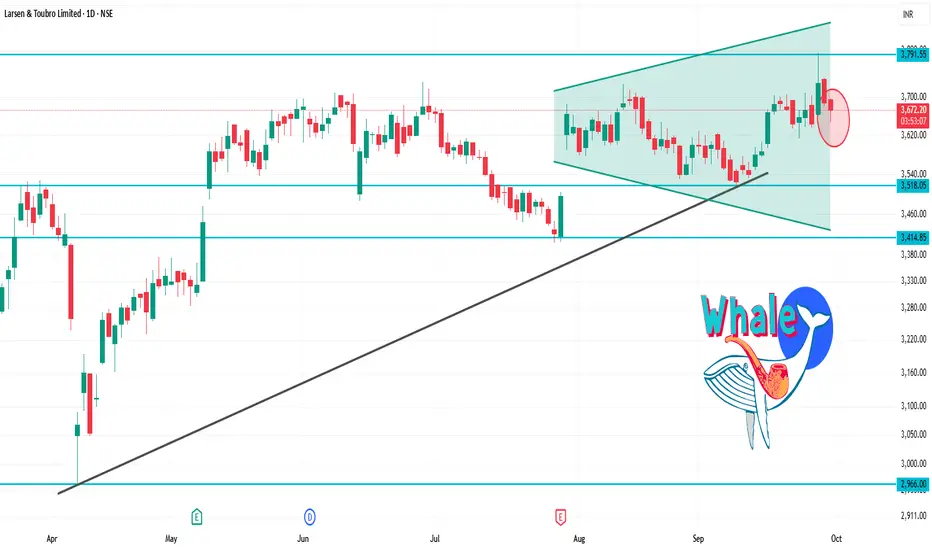
LT 1D Time frameCurrent Price: ₹3,655.30
Day’s Range: ₹3,648.00 – ₹3,696.60
52-Week Range: ₹2,965.30 – ₹3,963.50
Technical Indicators
RSI (14-day): 41.19 — indicates a neutral to slightly bearish momentum.
MACD: -1.47 — suggests bearish momentum.
Moving Averages: Mixed signals — short-term averages are bearish, while long-term averages are bullish.
Technical Summary: Predominantly Sell signals across various indicators.
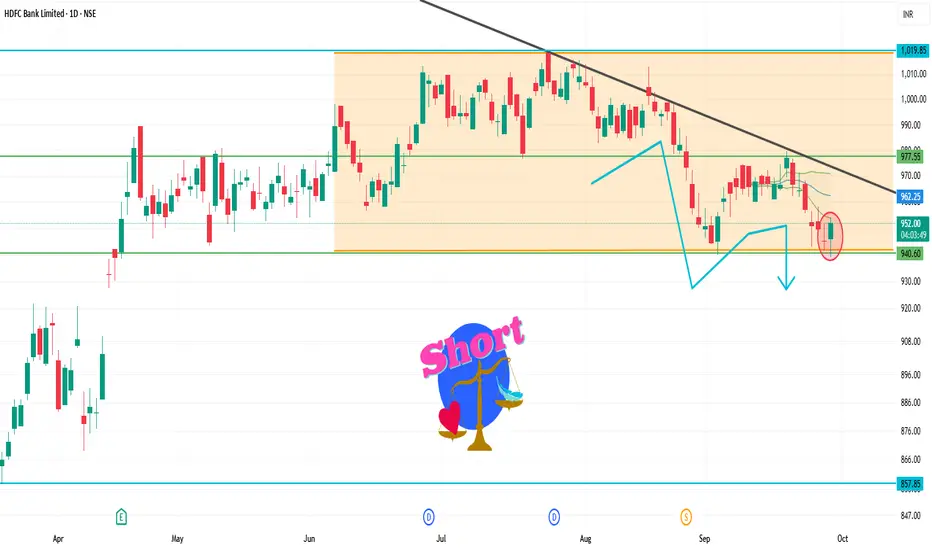
HDFCBANK 1D Time frameCurrent Market Snapshot
Current Price: ₹954.05
Opening Price: ₹945.10
Day's Range: ₹939.10 – ₹953.00
Previous Close: ₹945.05
🔑 Technical Indicators
Relative Strength Index (RSI): 35.08 – indicating a neutral to bearish condition.
Moving Average Convergence Divergence (MACD): -6.02 – suggesting bearish momentum.
Moving Averages: Trading below the 50-day and 200-day moving averages, indicating a bearish trend.
📈 Key Support & Resistance Levels
Immediate Support: ₹939
Immediate Resistance: ₹953
Pivot Point: ₹946
📉 Market Sentiment
Trend: The stock is trading below its 50-day and 200-day moving averages, indicating a bearish trend.
Volume: Trading volume is higher than average, suggesting increased investor activity.
📈 Strategy (1D Timeframe)
1. Bullish Scenario
Entry: Above ₹953
Stop-Loss: ₹939
Target: ₹960 → ₹965
2. Bearish Scenario
Entry: Below ₹939
Stop-Loss: ₹953
Target: ₹930 → ₹925
⚠️ Risk Management
Limit risk to 1% of capital per trade.
Always use stop-loss to protect against unexpected market movements.
Monitor broader market trends and sector-specific news that may impact stock performance.
SENSEX 1D Time frameOpening Level: ₹80,500
Current Level: ₹80,15.23
Day's Range: ₹80,300 – ₹80,800
🔑 Key Support & Resistance Levels
Immediate Support: ₹80,500
Immediate Resistance: ₹81,000
Pivot Point: ₹80,745.23
📊 Market Sentiment
Trend: The Sensex has experienced a six-day losing streak, indicating bearish momentum.
Reuters
Volume: Trading volume is significantly higher than its 20-day average, suggesting increased investor activity.
📈 Strategy (1D Timeframe)
1. Bullish Scenario
Entry: Above ₹81,000
Stop-Loss: ₹80,500
Target: ₹81,300 → ₹81,500
2. Bearish Scenario
Entry: Below ₹80,500
Stop-Loss: ₹81,000
Target: ₹80,200 → ₹80,000
⚠️ Risk Management
Limit risk to 1% of capital per trade.
Always use stop-loss to protect against unexpected market movements.
Monitor broader market trends and sector-specific news that may impact index performance.

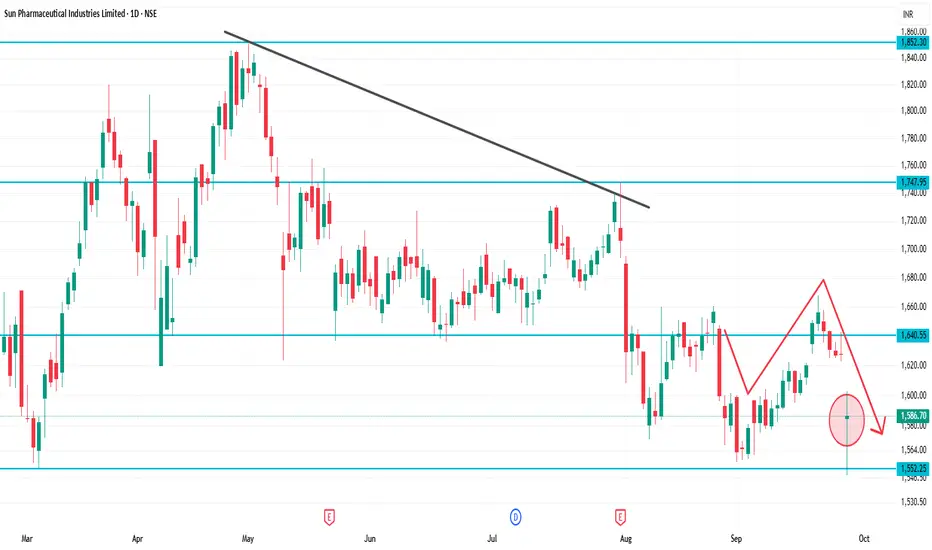
SUNPHARMA 1D Time frameCurrent Price: ~₹1,586
Day Range: ~₹1,582 – ₹1,600
52-Week High: ~₹1,960
52-Week Low: ~₹1,553
📈 Technical Outlook
Immediate Support: ₹1,580 (very close to current price)
Strong Support: ₹1,553 – ₹1,560 (52-week low zone)
Immediate Resistance: ₹1,600 – ₹1,620
Major Resistance: ₹1,650 – ₹1,670
Trend Bias:
Stock is weak, testing lower supports.
If it breaks below ₹1,580, then ₹1,553 may be tested.
A bounce is only possible if it sustains above ₹1,600.
📌 Step-by-Step Market View
Above 1,600: Chance for small recovery toward ₹1,620 – ₹1,650.
Stays between 1,580 – 1,600: Consolidation zone.
Breaks below 1,580: Weakness may extend to ₹1,553.
INFY 1D Time frame📊 Daily Snapshot
Closing Price: ₹1,484.65
Day’s Range: ₹1,476.50 – ₹1,502.70
Previous Close: ₹1,494.60
Change: Down –0.64%
52-Week Range: ₹1,307.00 – ₹2,006.45
Market Cap: ₹6.17 lakh crore
P/E Ratio (TTM): 22.62
Dividend Yield: 2.90%
EPS (TTM): ₹65.63
Beta: 1.09 (indicating moderate volatility)
🔑 Key Technical Levels
Support Zone: ₹1,469 – ₹1,473
Resistance Zone: ₹1,485 – ₹1,490
Pivot Point: ₹1,480.97 (Fibonacci)
All-Time High: ₹2,006.45
📈 Technical Indicators
RSI (14-day): 44.45 – approaching oversold territory, suggesting potential for a rebound.
MACD: Negative at –6.34, indicating bearish momentum.
Moving Averages: Trading below the 50-day (₹1,511.06) and 200-day (₹1,495.15) moving averages, indicating a bearish trend.
Stochastic RSI: Between 45 and 55, indicating a neutral condition.
CCI (20): Between –50 and 50, implying a neutral condition.
📉 Market Sentiment
Recent Performance: Infosys experienced a decline of 0.64% on September 25, 2025, underperforming the broader market.
Volume: Trading volume was significantly higher than its 20-day average, indicating increased investor activity.
📈 Strategy (1D Timeframe)
1. Bullish Scenario
Entry: Above ₹1,485
Stop-Loss: ₹1,469
Target: ₹1,490 → ₹1,500
2. Bearish Scenario
Entry: Below ₹1,469
Stop-Loss: ₹1,485
Target: ₹1,460 → ₹1,450
SBIN 1D Time frame📊 Daily Snapshot
Closing Price: ₹861.15
Day’s Range: ₹859.95 – ₹870.15
Previous Close: ₹866.20
Change: Down –0.59%
52-Week Range: ₹680.00 – ₹880.50
Market Cap: ₹794,895 crore
P/E Ratio: 10.01
Dividend Yield: 1.85%
EPS (TTM): ₹86.06
Beta: 1.00 (indicating average market volatility)
🔑 Key Technical Levels
Support Zones: ₹860.00 – ₹854.00 – ₹844.00
Resistance Zones: ₹876.00 – ₹886.00 – ₹892.00
All-Time High: ₹912.00
Fibonacci Pivot Point: ₹865.68
📈 Strategy (1D Timeframe)
1. Bullish Scenario
Entry: Above ₹876.00
Stop-Loss: ₹859.00
Target: ₹886.00 → ₹892.00
2. Bearish Scenario
Entry: Below ₹859.00
Stop-Loss: ₹866.00
Target: ₹854.00 → ₹844.00

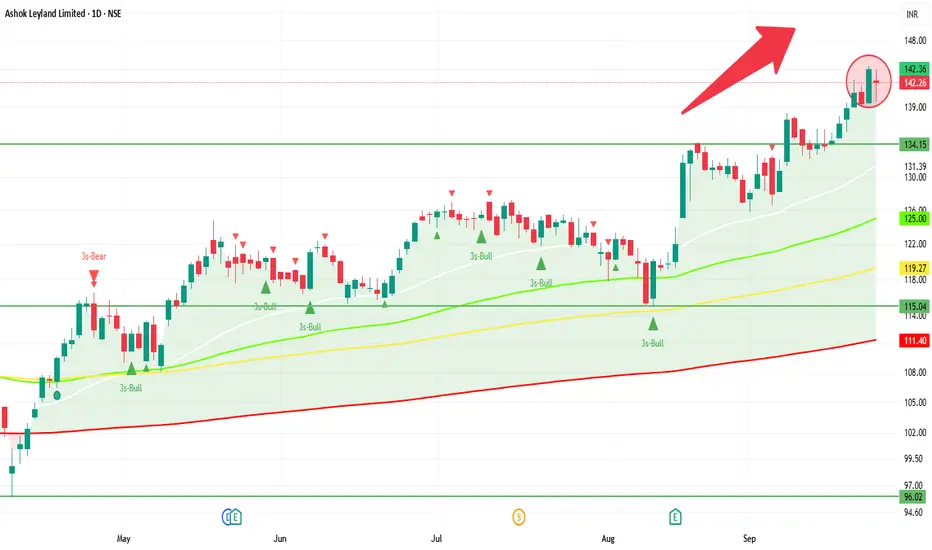
ASHOKLEY 1D Time frame📊 Today's Performance
Closing Price: ₹142.26
Day’s Range: ₹139.60 – ₹143.99
Previous Close: ₹144.04
Change: Down ~ –1.24%
52-Week Range: ₹95.93 – ₹144.50
Volume: ~36.96 million shares
Market Cap: ₹83,556 crore
P/E Ratio: 26.05
Dividend Yield: 4.39%
EPS (TTM): ₹5.46
🔍 Key Technical Levels
Support Zone: ₹139.60 – ₹140.00
Resistance Zone: ₹143.50 – ₹144.50
All-Time High: ₹144.50
📈 Strategy (1D Timeframe)
1. Bullish Scenario
Entry: Above ₹143.50
Stop-Loss: ₹141.50
Target: ₹146.00 – ₹148.00
2. Bearish Scenario
Entry: Below ₹139.60
Stop-Loss: ₹141.50
Target: ₹136.00 – ₹134.00
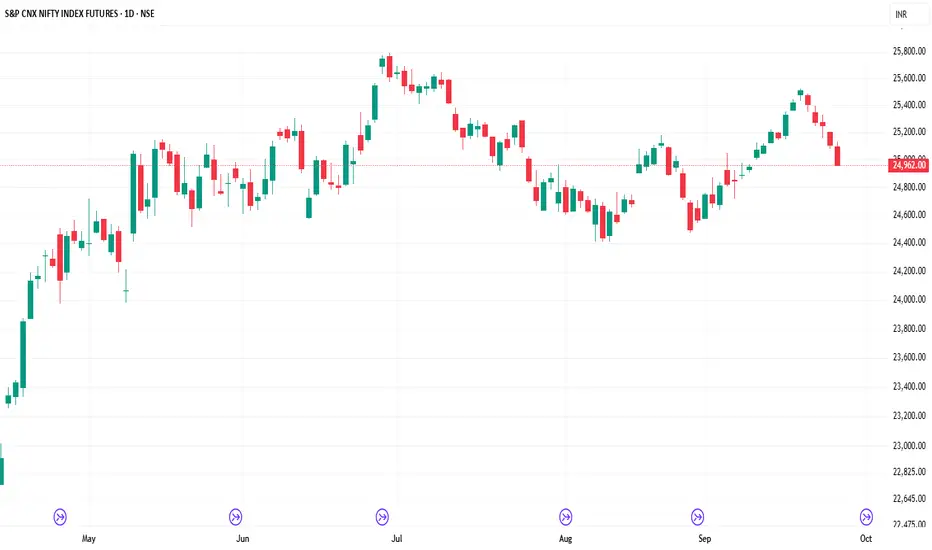
SENSEX 1D Time frame📊 Today’s Sensex Performance
Closing Level: ~ 81,715.63
Point Change: ~ –386.47
% Change: ~ –0.47%
The market has been weak lately; today extends losses.
Broad weakness across sectors, with IT & financials under pressure.
🎯 Key Support & Resistance Levels
Support Zone: ~ 81,550 to 81,400
Strong Support: ~ 81,200
Resistance Zone: ~ 82,000 to 82,150
If Sensex rises above 82,150 and holds, bullish bias may resume.
But if it breaks below 81,400 with strength, further downside possible.
📝 Strategy Ideas for Next Trading Day(s)
Bearish Setup (if weakness continues)
Short when Sensex rallies into resistance (~ 82,000–82,150) and shows reversal candle or weakness.
Stop-loss just above 82,200.
Target toward support zones: 81,400 → 81,200.
Bullish Setup (if rebound happens)
If Sensex finds support near ~ 81,400–81,550 and bounces with strength, go long.
Stop-loss below 81,300.
Target toward 82,000 → 82,150.
Range / Intraday Play
Trade between 81,400 (support) and 82,100 (resistance) as range, until a decisive breakout occurs.
Keep tight stop-losses, take small profits.

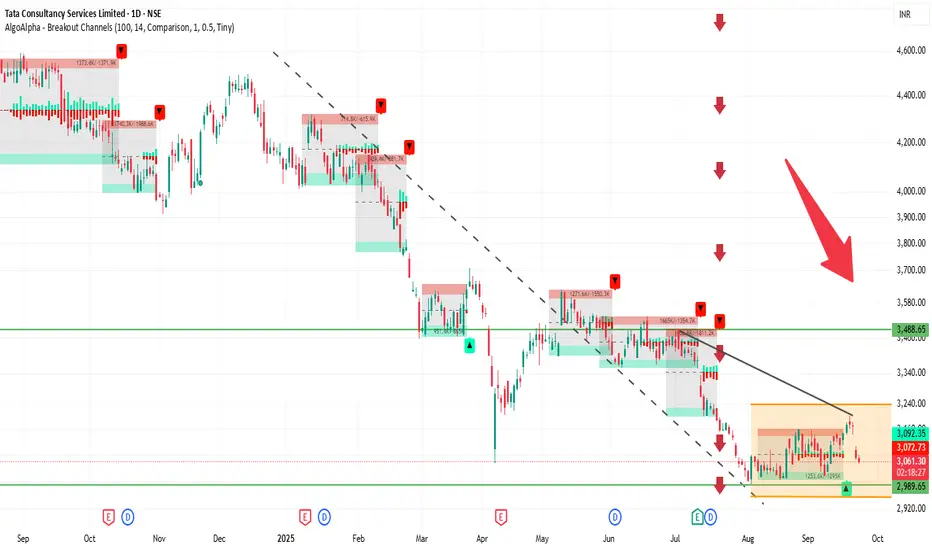
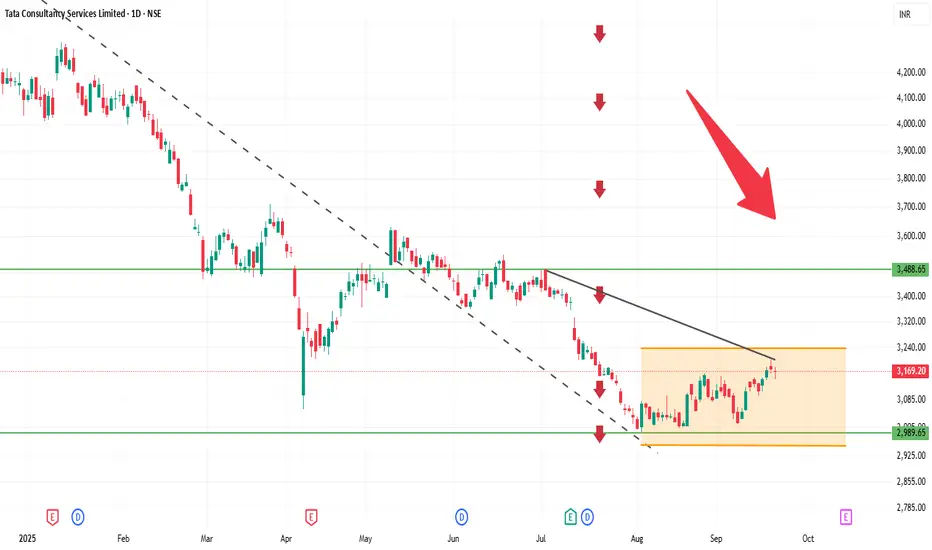
TCS 1D Time frame📍 Current Price & Range
Current price: ₹3,063.80
Day’s High / Low: ₹3,106.90 / ₹3,052.00
52-week High / Low: ₹4,494.90 / ₹2,991.60
🔍 Key Levels
Immediate resistance: ₹3,100–₹3,110
Next resistance: ₹3,200–₹3,250
Immediate support: ₹3,050–₹3,060
Psychological / strong support: ₹3,000
📊 Indicators & Momentum
Price is just below near-term resistance, showing hesitation.
Short-term trend is neutral to slightly bearish; momentum is weak.
RSI and MACD suggest neutral to weak momentum, no strong reversal yet.
Stock is trading well below its 52-week high, indicating it has already corrected significantly.
🔮 Possible Scenarios
Bullish breakout → Sustaining above ₹3,110 could push price toward ₹3,200–₹3,250.
Sideways / consolidation → Likely to trade between ₹3,050–₹3,110 if no strong catalyst.
Bearish pullback → Breaking below ₹3,050 may take price toward ₹3,000, and further down to ₹2,950–₹2,900 if weakness continues.
👉 Outlook: At the current level (₹3,073.80), TCS is in a neutral zone. The next directional move depends on either a breakout above resistance or a fall below support.
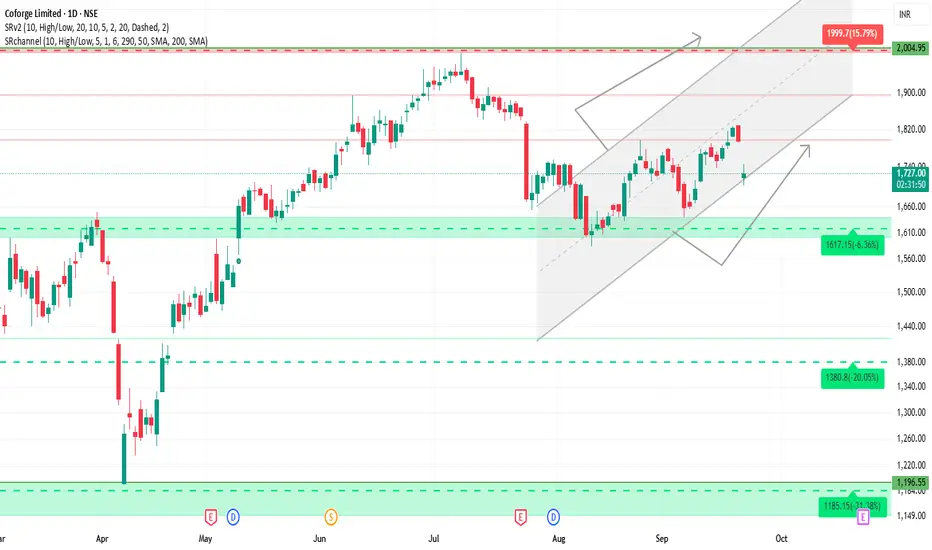
COFORGE 1D Time frame🔍 Current Price
Trading around ₹1,720 – ₹1,740
📊 Technical Indicators
Trend: Bearish — price trading below short and medium-term moving averages.
RSI (14): Around 26–27, showing oversold zone.
MACD: Negative, indicating bearish momentum.
ADX: Strong, meaning the downtrend has solid strength.
⚙️ Key Levels
Immediate Resistance 1: ₹1,780
Resistance 2: ₹1,820 – ₹1,840
Immediate Support 1: ₹1,700
Support 2: ₹1,650
Deeper Support: ₹1,620
🧮 Base Strategy
Long Setup:
Entry: Near ₹1,700 if reversal signals appear
Stop Loss: Below ₹1,650
Targets: ₹1,780 first, then ₹1,820+
Short Setup (Reversal):
If price fails near ₹1,780 zone
Targets: ₹1,700, then ₹1,650
Breakout Setup:
If price sustains above ₹1,820 – ₹1,840 with volume
Upside can extend toward higher levels
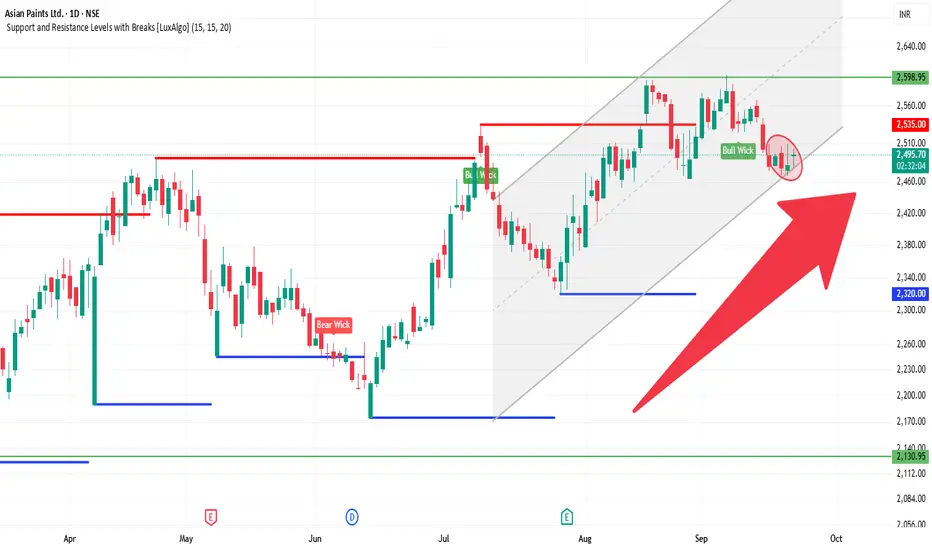
ASIANPAINT 1D Time frame🔍 Current Status
The stock is trading around ₹2,490 – ₹2,500
Recent price action has been somewhat mixed — not a strong trend, some resistance in higher zones.
🧮 Trade Strategy Ideas
Long Setup:
If price holds above ~₹2,460 and shows reversal candlestick or volume strength.
Target resistance around ₹2,505-₹2,528.
Stop-loss could be placed just below ₹2,440 or so (to protect against breakdowns).
Short / Pullback Setup:
If price gets rejected near resistance around ₹2,505-₹2,528 and bearish candlestick forms.
Potential downside toward ~₹2,460 first, then further to ~₹2,420.
Breakout Setup:
If price breaks above ~₹2,528 with good volume, could aim for ~₹2,546 or higher.
Must confirm with strength / follow-through.
✅ Summary: Asian Paints is in a consolidation / neutral phase. Key to watch is how it reacts around the resistance zone ~₹2,505-₹2,528. Holding above support ~₹2,460 is important. A clear breakout gives upside, else downside risk remains.
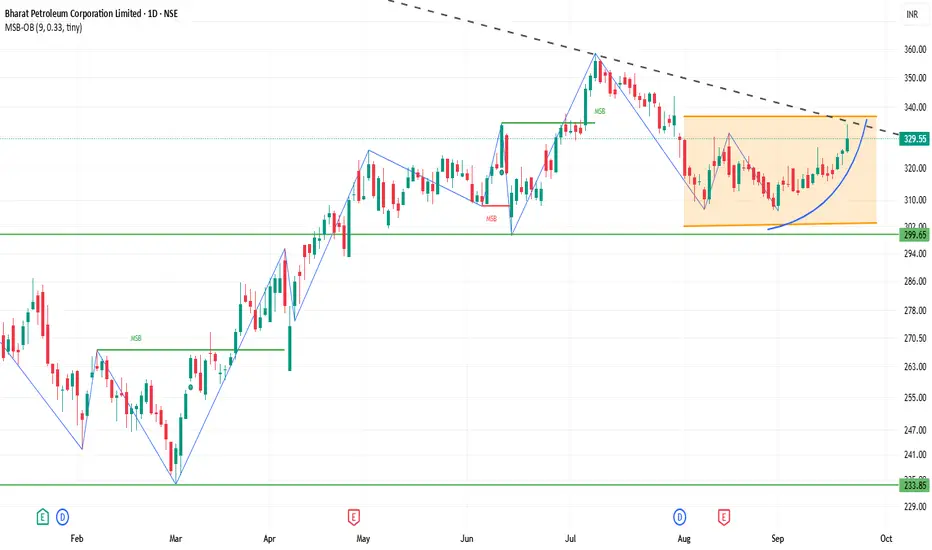
BPCL 1D Time frame📊 Current Snapshot
Closing Price: ₹329.55
Day's Range: ₹324.80 – ₹334.00
52-Week Range: ₹234.01 – ₹376.00
Market Capitalization: ₹1,42,975 Crores
Volume: Approximately 10 million shares traded
P/E Ratio: 8.14
Dividend Yield: 2.99%
⚙️ Technical Indicators
Relative Strength Index (RSI): 60.31 – Neutral to slightly bullish
Moving Average Convergence Divergence (MACD): 0.29 – Neutral
Moving Averages: Short-term averages (5, 10, 20, 50, 100, 200-day) are above the current price, indicating potential resistance.
Pivot Points: Central pivot around ₹322.30, suggesting a balanced market sentiment.
🎯 Possible Scenarios
Bullish Scenario: A breakout above ₹328.25 with strong volume could target ₹331.80 and higher levels.
Bearish Scenario: Failure to hold above ₹325.85 may lead to a decline toward ₹322.30.
⚠️ Key Considerations
Market Sentiment: BPCL has shown strong performance recently, but broader market conditions can impact its movement.
Volume Analysis: Watch for volume spikes to confirm breakout or breakdown signals.
Technical Indicators: While the RSI indicates a neutral to slightly bullish stance, the MACD and moving averages suggest caution.
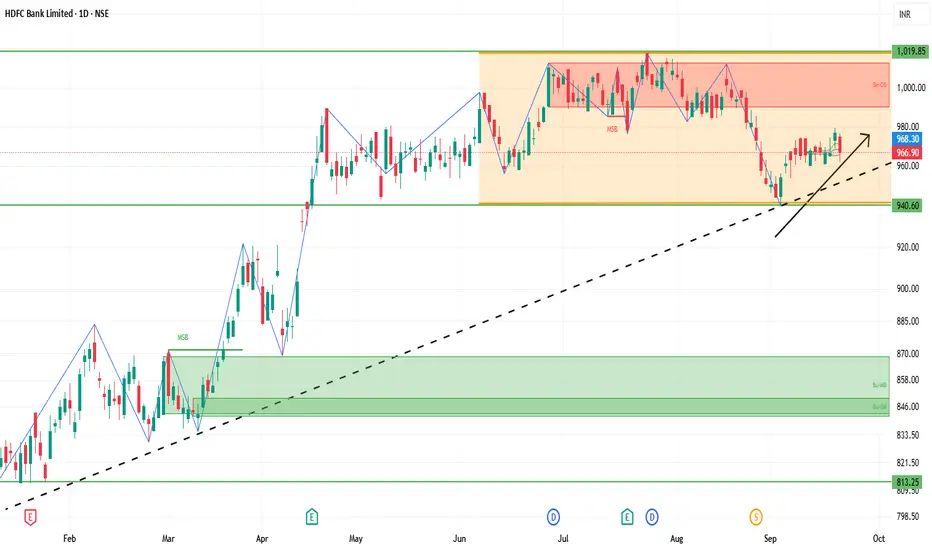
HDFCBANK 1D Time frame📊 Current Snapshot
Current Price: Around ₹967
Day Range: ₹962 – ₹976
52‑Week Range: High ~ ₹1,018, Low ~ ₹805
Volume: Slightly above recent average, showing decent trading interest
🔍 Support & Resistance
Immediate Resistance: ₹975 – ₹983
Higher Resistance: ₹989 – ₹990
Immediate Support: ₹960 – ₹954
Lower Support: ₹946
⚙️ Indicators & Trend
RSI / Stochastic: Neutral to slightly bearish, indicating mild selling pressure
Pivot Level: Around ₹968 – ₹969, meaning price is near equilibrium
Moving Averages: Mixed signals; short-term MAs under slight pressure, long-term trend still intact
🎯 Possible Scenarios
Bullish Case: Break and sustain above ₹980 → next target ₹990+
Bearish Case: Fail at resistance → pullback toward ₹960‑₹954; below ₹954 → possible drop to ₹946
⚠️ Key Points
Resistance zones are tight and need strong volume for a breakout
Price near pivot levels may lead to short-term sideways movement or volatility
Confirmation from trading volume is important for trend sustainability
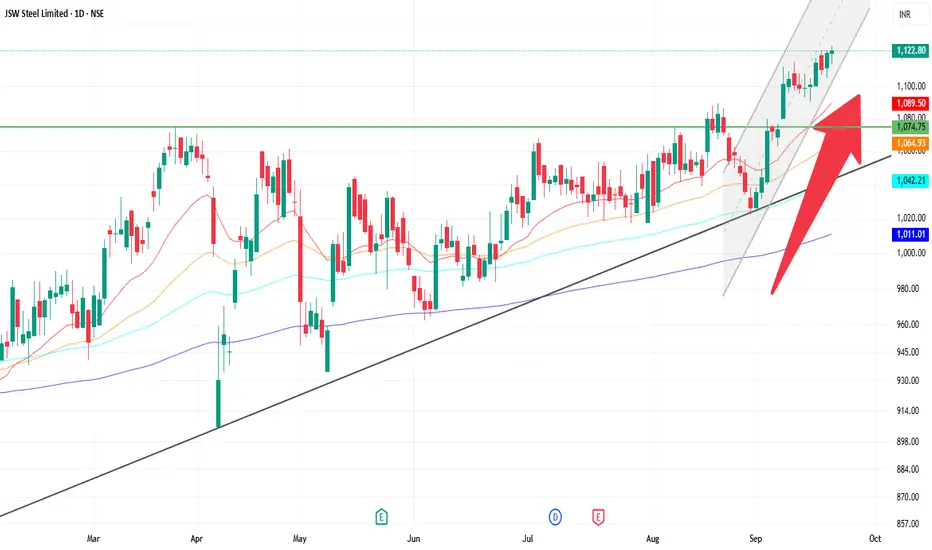
JSWSTEEL 1D Time frame📊 Current Overview
Current Price: Around ₹1,122 – ₹1,123
Recently touched 52-week high levels.
Trend is overall bullish with strong momentum.
🔍 Support & Resistance
Immediate Support: ₹1,110 – ₹1,100
Next Support: ₹1,085
Immediate Resistance: ₹1,125 – ₹1,130
Next Resistance: ₹1,140+
📈 Indicators
Moving Averages (5, 10, 20, 50, 100, 200): All pointing bullish, price is trading above them.
RSI (14): Around 67, showing strong momentum but close to overbought zone.
MACD & ADX: Both suggest continuation of uptrend.
🎯 Possible Scenarios
Bullish Side: A breakout above ₹1,130 can push towards ₹1,140 – ₹1,150.
Bearish Side: If price rejects at resistance, it may pull back to ₹1,110, and deeper towards ₹1,085.
TCS 1D Time frameCurrent Price: Around 3,174
Current Trend: Stock is in a sideways to slightly bullish phase after consolidation.
Support Zone: Strong support at 3,140 – 3,150. Buyers may defend this level.
Resistance Zone: Key resistance at 3,200 – 3,220. A breakout above 3,220 can trigger fresh upside.
Indicators: Daily candles indicate mild buying interest; volume is stable.
Outlook:
Above 3,220 → bullish momentum may extend toward 3,250+.
Below 3,140 → weakness may push toward 3,100–3,120.
👉 In short:
Range: 3,140 – 3,220.
Neutral to slightly bullish; breakout will determine next move.
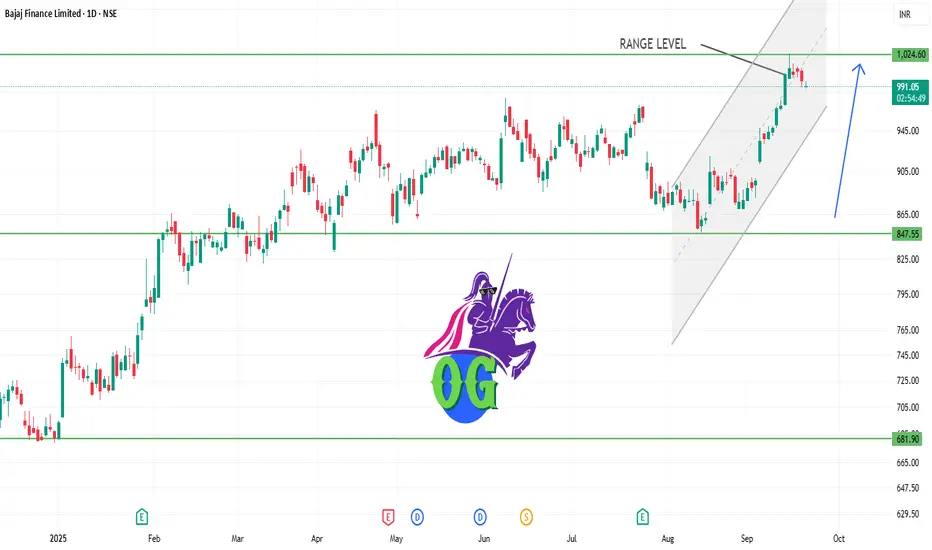
BAJFINANCE 1D Time frame1. Pivot Level
₹992 → key short-term pivot.
Above ₹992 → bullish bias.
Below ₹992 → bearish bias.
2. Bullish Setup (if price holds above ₹992)
Entry: Around ₹995–₹998 (after confirming bounce above pivot).
Target:
First target → ₹1,010–₹1,012
Second target → ₹1,020–₹1,025 (if momentum continues)
Stop Loss: ₹990 (just below pivot)
Risk/Reward: Good, roughly 2–3x potential vs stop.
3. Bearish Setup (if price falls below ₹992)
Entry: Around ₹990–₹988 (if close below pivot confirmed).
Target:
First target → ₹980
Second target → ₹965–₹960
Stop Loss: ₹995 (just above pivot)
Risk/Reward: Decent for short-term pullback trade.
4. Notes / Idea Logic
Why it works: ₹992 is acting as a short-term pivot — price respecting this shows strength; breaking it signals weakness.
Volume confirmation: If buying comes with strong volume → bullish; if selling is strong → bearish.
Time frame: This is mainly for 1–3 day trades on the daily chart.
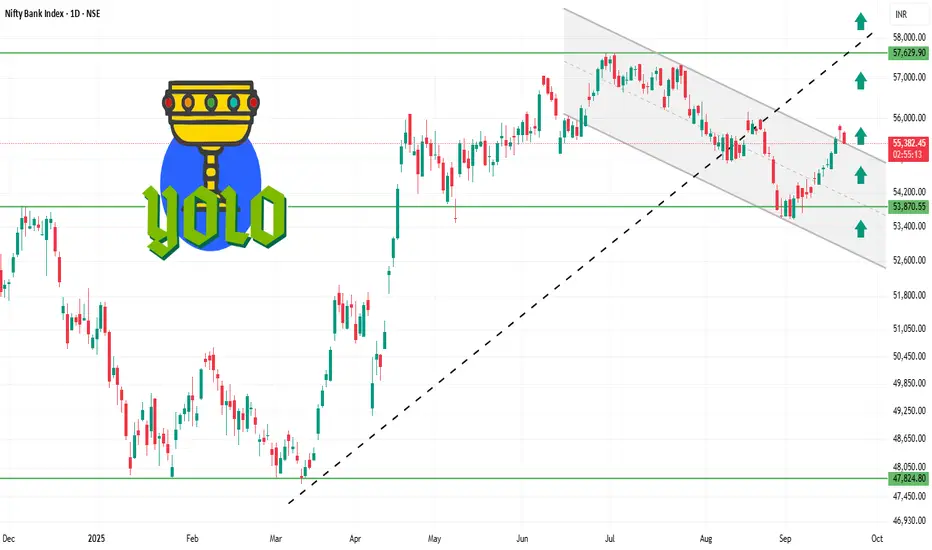
BANKNIFTY 1D Time frame✅ Current Facts
Current Level: ~ 55,400 – 55,480
Trend: Mildly bullish; trading above short-term moving averages (20-day & 50-day EMA).
Momentum Indicators:
RSI (14-day): ~61 → bullish but not overbought.
MACD: Positive → supporting the upward trend.
Price Action: Daily candles show small upper wicks → minor profit-taking near resistance.
⚙️ Outlook
Bullish Scenario:
Holding above 55,350 → retest 55,550–55,600 and possibly 55,700–55,750.
Range / Consolidation:
Price oscillates between 55,350 – 55,550 → sideways trading likely.
Bearish Scenario:
Close below 55,350 → downside risk toward 55,150–55,200 or lower.
⚠️ Key Facts
55,400 – 55,500 is acting as a short-term pivot: above it favors bulls, below it favors bears.
Resistance at 55,550–55,600 is the first hurdle; breakout here can lead to further upside.
Support at 55,300–55,350 is critical; failing to hold may lead to short-term correction.