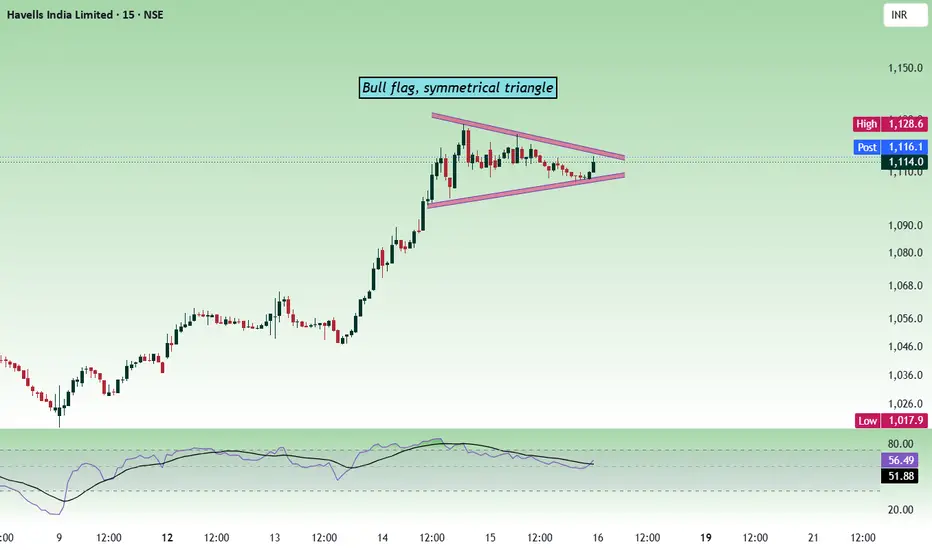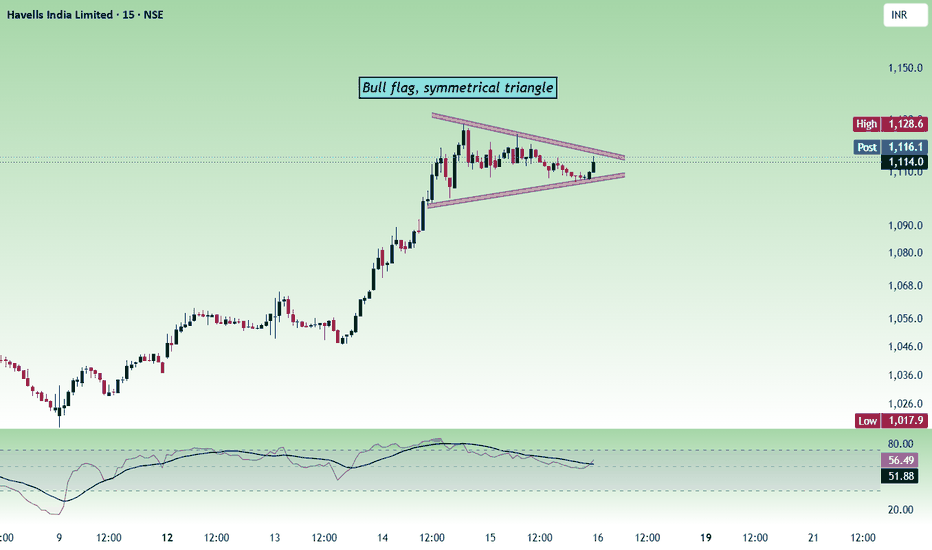
Havells - Multi time frame analysisIn the lower timeframe, the price is forming a symmetrical triangle. We can also see a bull flag formation. A symmetrical triangle is a neutral pattern, and the breakout can be in any direction. A bull flag is a bullish pattern.
On the daily timeframe, the price is forming a W pattern, which is bullish.
The price is bullish as long as it stays above 1082 - 1088.
Buy above 1110 - 1114 with a stop-loss of 1094 for the targets 1122, 1136, 1148, 1162 and 1176.
The price can face resistance at the 1
TVSSCS
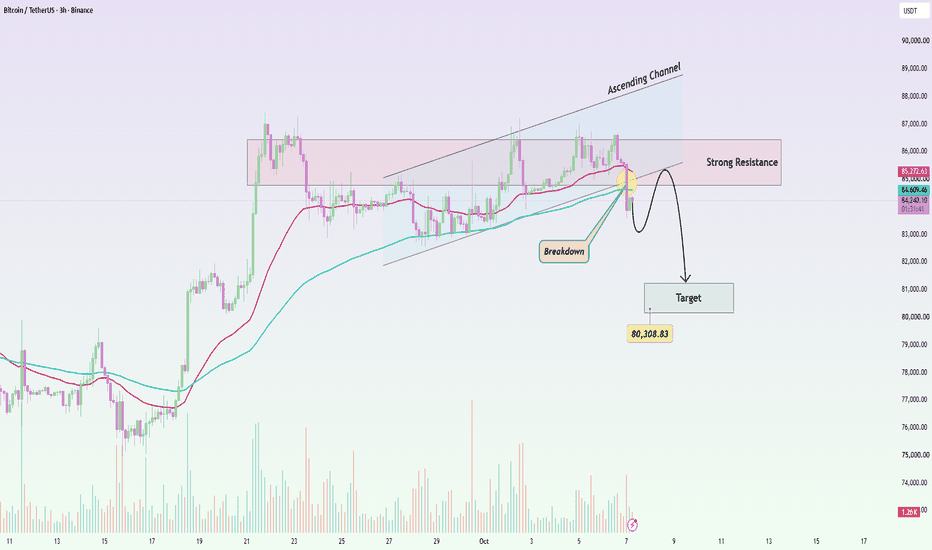
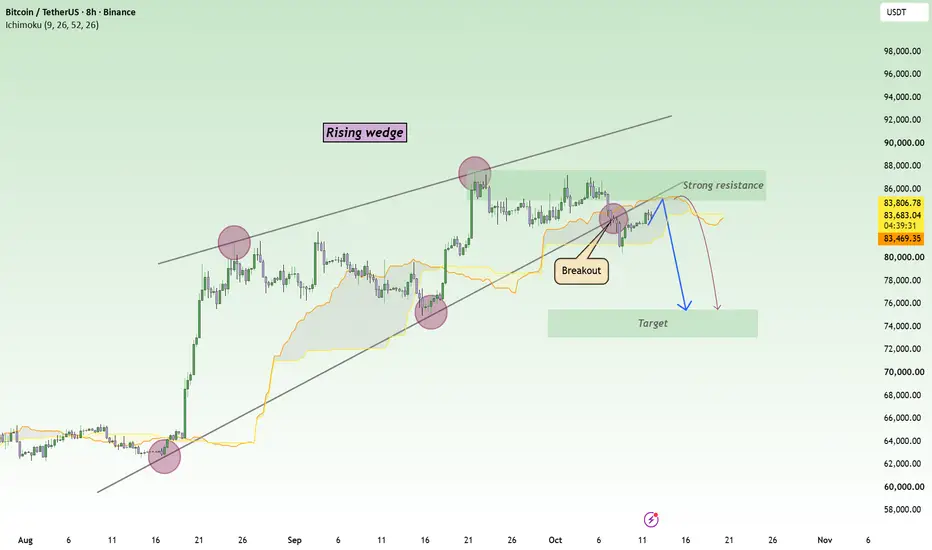
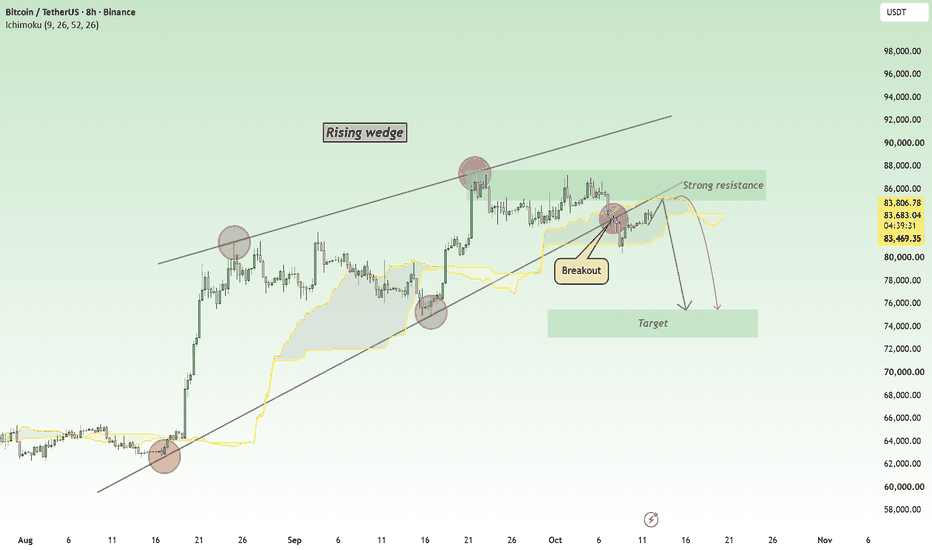
BTCUSDT: Higher Prices Are Becoming Harder to HoldWhat catches my attention in Bitcoin right now is not a single bearish candle or one isolated technical signal. Both the price structure and the broader investment environment are becoming less favorable for buyers . The rising wedge has broken to the downside, while a strong U.S. dollar and elevated U.S. Treasury yields are giving capital more reasons to remain cautious toward risk assets.
ใ
ค
From a fundamental perspective, I am paying more attention to where capital actually wants to go . Whe
Sensex - Expiry day analysis Oct 15The price is moving inside an ascending channel and now it is testing the lower trend line of the channel. In the daily chart, you can see the strong resistance at 73000 zone. The price have to sustain above that to move up further.
Buy above 72680 with the stop loss of 72540 for the targets 72820, 72960, 73120, 73280 and 73420.
Sell below 72400 with the stop loss of 72580 for the targets 72180, 72040, 71880, 71720 and 71580.
71700 is strong support, and 73000 is strong resistance. The price ca
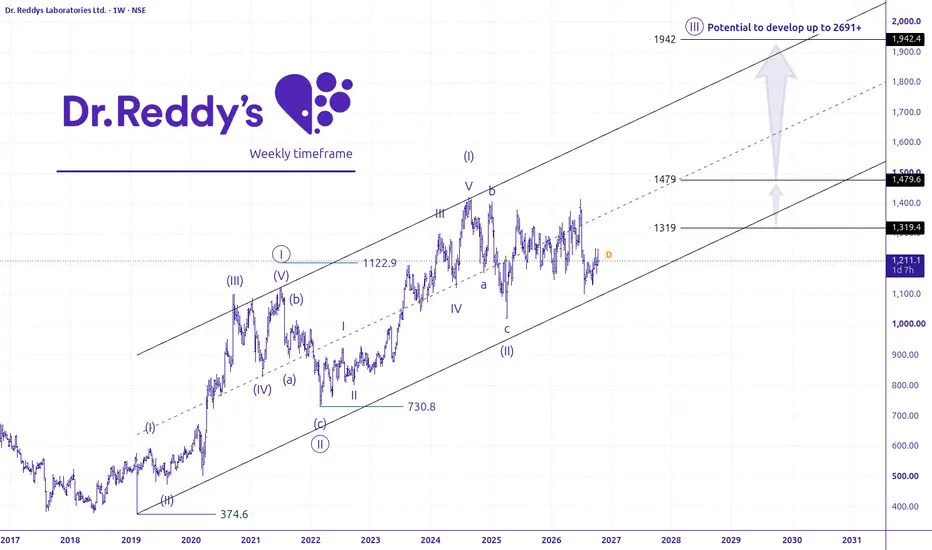
Dr. Reddy's Laboratories | Elliott Wave Analysis๐ Dr. Reddy's Laboratories | Weekly Chart | Elliott Wave Projection
NSE:DRREDDY appears to be developing a long-term bullish Elliott Wave structure within a rising parallel channel. The advance from the 2022 low could represent the beginning of a larger upward move, with the potential for an extended Wave ((III)) .
๐ฏ Elliott Wave Price Projections
- Near-Term Upside: 1319 โ 1479
- Extended Target: 1942
- Bullish Extension Scenario: 2691+ if Wave (III) develops into an extended impulse.
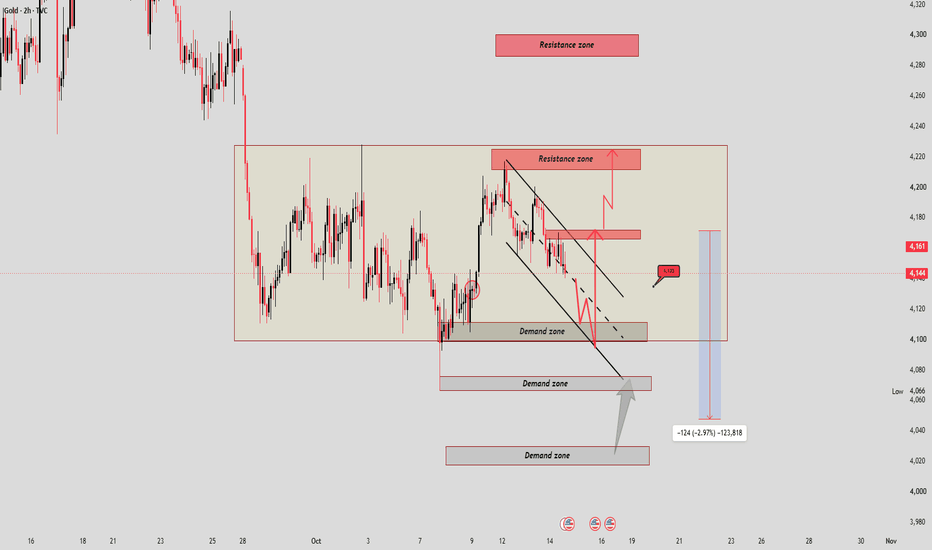
Gold: CPI โ The Biggest Battle of the Week. Who Gets Trapped?
Gold remains in a short-term H1 downtrend, while the broader market is trading within a range. CPI could trigger a liquidity sweep in either direction.
Resistance: 4,160 | 4,170 | 4,198โ4,200|4250|4300
Support: 4,140โ4,130 | 4,110โ4,100 | 4,060 | 4,020
Trading Scanner Rule
Buy bias: Focus on strong support zones, but wait for clear rejection and signs of selling pressure weakening before entering.
CPI strategy: Let volatility play out first. Avoid chasing the initial move; look for Buy opp
KPL : Strong Volume Breakout from Rectangular ConsolidationChart Analysis & Pattern:
Looking at the daily timeframe for Kwality Pharmaceuticals Ltd, the stock has spent the last several weeks moving sideways within a well-defined rectangular consolidation pattern.
The price has been bouncing strictly between a solid support base near 3,250 and a strong resistance ceiling around the 3,700โ3,750 zone.
The Breakout & Volume Confirmation:
In the most recent trading session, KPL delivered a powerful bullish breakout, piercing through the upper boundary of t
SHADOWFAX : Bullish Rectangle Breakout with Volume ConfirmationTrade Bias: Long
Chart Analysis:
As observed in Shadowfax Technologies has spent several weeks consolidating within a clear rectangular channel, bounded by support around 240.00 and resistance near 264.00.
The most recent daily price action demonstrates a definitive breakout above this resistance zone, printing a strong, full-bodied bullish candle that closed at 272.45 (+8.31%).
To satisfy the requirement of multiple technical confirmations, this pattern breakout is heavily supported by a ma
HCLTECH | Monthly Triangle, Weekly Liquidity Zone and DailyAPOORV DUBEY | SEBI Registered Research Analyst
โ ๏ธ This post is for educational purposes only. It is not a recommendation to buy, sell or hold any security.
Why this post?
The goal is not to give you a view on HCL Tech. It is to show you how to analyse a chart on your own. Always start from the biggest timeframe and work down.
1. Monthly: the big picture
-Support trendline: price has respected an ascending trendline since 2011, tested again in 2020 and in the current structure.
-Resistance
Nifty - Expiry day analysis Oct 13Today, the price opened at the important zone 22600 and was unable to sustain above it and fall. The price can find support in the 22300 - 22320 zone or in the 22180 - 22220 zone. Breaking or showing bearish strength at the 22180 - 22220 zone can lead to a big fall, as it is a crucial level in deciding the trend direction.
Buy above 22420 with the stop loss of 22360 for the targets 22480, 22520, 22560, 22600 and 22660.
Sell below 22280 with the stop loss of 22340 for the targets 22220, 22180, 2
Adani Green: Four Years of Squeeze, One Move Left?Educational wave study only. Not a buy or sell recommendation.
For four years, Adani Green has been going nowhere. Every high is lower than the last, and every low is higher. The market is slowly squeezing itself into a corner, and that shape has a name: a contracting triangle.
The big picture (monthly, log scale): Waves (1), (2) and (3) took the stock from 22.8 to 3,050. Since then, wave (4) has been moving sideways in a triangle. Four legs of it look complete, and the fifth and final leg
One Stock. Two Timeframes. A Breakout That Fooled the CrowdAPOORV DUBEY | SEBI Registered Research Analyst
A breakout is not always the opportunity. Sometimes, the location of that breakout is the real story.
This chart of New India Assurance demonstrates why I believe multi-timeframe analysis is essential for understanding market structure and potential liquidity traps.
LEFT - MONTHLY TIMEFRAME (Bird's-Eye View)
The broader chart reveals a large symmetrical triangle-like structure, with price operating between descending resistance and rising su
Arfin India (W): CONTINUATION BREAKOUTTimeframe: Weekly | Chart Scale: Logarithmic
Explosive +20.50% weekly surge backed by a massive 52.59M volume spike! ๐ฅ
Technical Highlights:
โ
Chart Pattern: Decisive breakout above a classic Flag & Pole resistance trendline, confirming the uptrend!
โ
Volume: Massive volume surge this week, continuing a steady build-up over recent weeks.
โ
Momentum: Short-term EMAs in positive crossover (Daily/Weekly). MACD & RSI rising. ๐
Key Levels to Watch:
๐ฏ Target 1: 123
๐ฏ Target
SEPC Ltd (W): MAJOR BOTTOM REVERSALTimeframe: Weekly | Chart Scale: Logarithmic
Constructive +3.94% weekly surge backed by a massive 97.38M volume spike! ๐ฅ
Technical Highlights:
โ
Reversal Pattern: Formed a classic double-bottom at multi-year support (active since Aug 2020!).
โ
Price Action: Bullish hamme r candlestick confirmed right at the support floor.
โ
Volume: Massive volume spike reversing a recent "dry volume" trend.
โ ๏ธ Caution: Short-term EMAs still negative, but MACD & RSI are curling up! ๐
Key Level
NIFTY 50: Double Bottom at 22,200 โ Is a Reversal Brewing?Timeframe: 1-Hour Chart
Market: NIFTY 50
Setup: Potential Double Bottom / W Pattern
* NIFTY 50 is showing signs of a potential reversal after an extended corrective phase on the hourly chart, with the 22,200 zone emerging as a crucial support area.
* Price action around this zone suggests the formation of a possible Double Bottom pattern. Additionally, the September-to-October transition has seen a broader W-shaped structure develop, with 22,800 acting as the key neckline resistance in this se
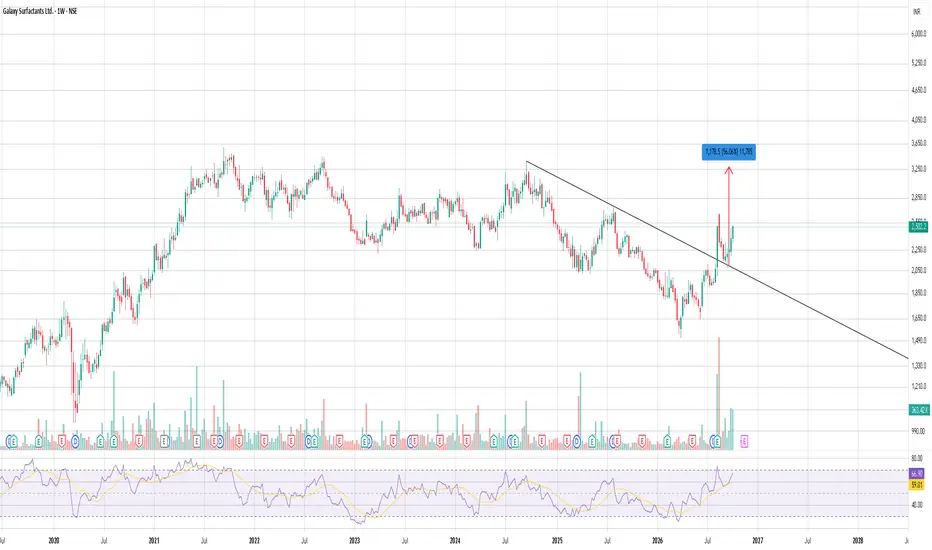
Galaxy Surfactants Ltd. โ Weekly Chart AnalysisGalaxy Surfactants has formed a Double Bottom , followed by a breakout above the neckline and a successful retest . Price has also broken above the long-term descending trendline, indicating a possible change in trend from bearish to bullish.
The stock is currently trading around โน2,502, with strong buying activity visible during the recent upward move. RSI is near 67, showing positive momentum, although some short-term consolidation is possible.
If the stock sustains above the breakout
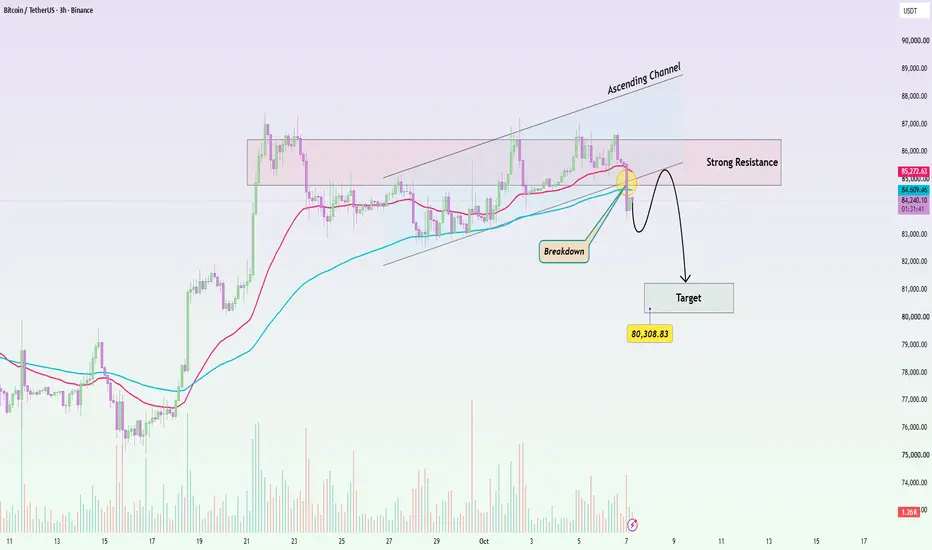
BTCUSDT: Channel Breakdown Turns Into ResistanceBitcoin has broken below the lower boundary of its ascending channel, and price is now trading around $84,200, below both short-term EMAs. That weakens the previous bullish structure and shifts attention toward a deeper correction.
The important area is now roughly $84,600โ$86,300. This zone previously supported the advance, but after the breakdown it can become resistance.
If BTC rebounds into this area and fails to reclaim the channel, I would treat that move as a retest rather than a bullis
NIFTY 50 โ Weekly Chart - 9 Oct 26 Crucial day for Indian MarketNifty has formed a Triple Top near the 24,400โ24,500 zone. The neckline around 22,216 has been broken, and price is currently retesting this breakdown level.
The 9 October 2026 closing will be very important. If Nifty gives a weekly close below 22,216, the breakdown will get stronger and a bigger fall can follow.
The first major support is at 21,743.65. This is a strong support zone and can lead to a bounce if buyers defend it. However, if 21,743 breaks decisively, the next major support is
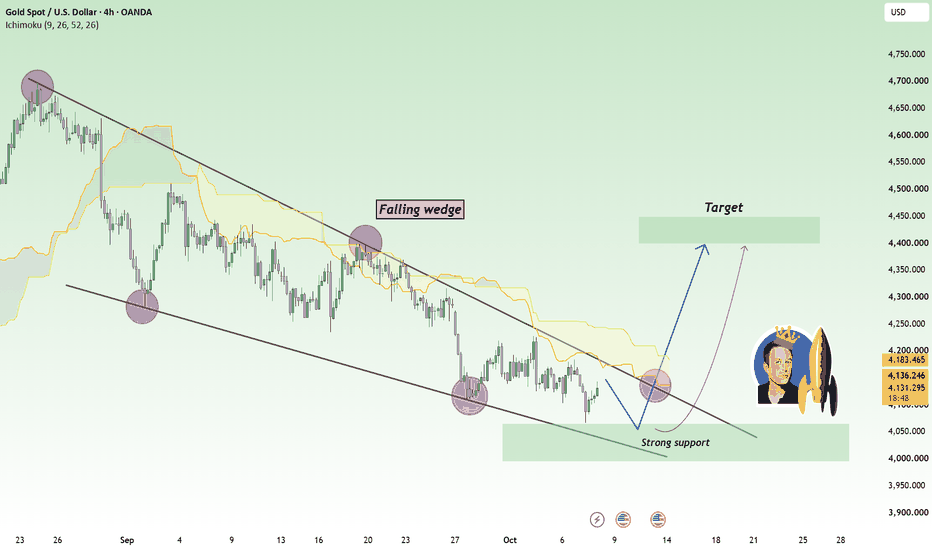
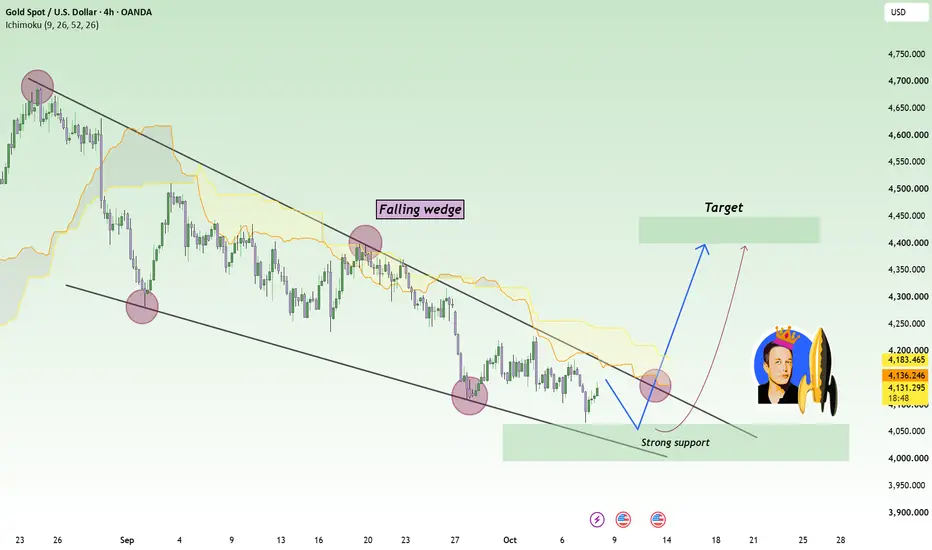
XAUUSD โ Falling Wedge Keeps the Recovery Setup AliveXAUUSD is beginning to show a more constructive setup on the H4 timeframe. Price is still trading inside a broader falling wedge, but the latest reaction from the lower boundary suggests that selling pressure is becoming less effective as Gold approaches a major support area. The current move may still need another pullback, but the structure is starting to favor a recovery rather than an extended sell-off.
From a fundamental perspective, the picture is mixed. A firm U.S. dollar, elevated Treas
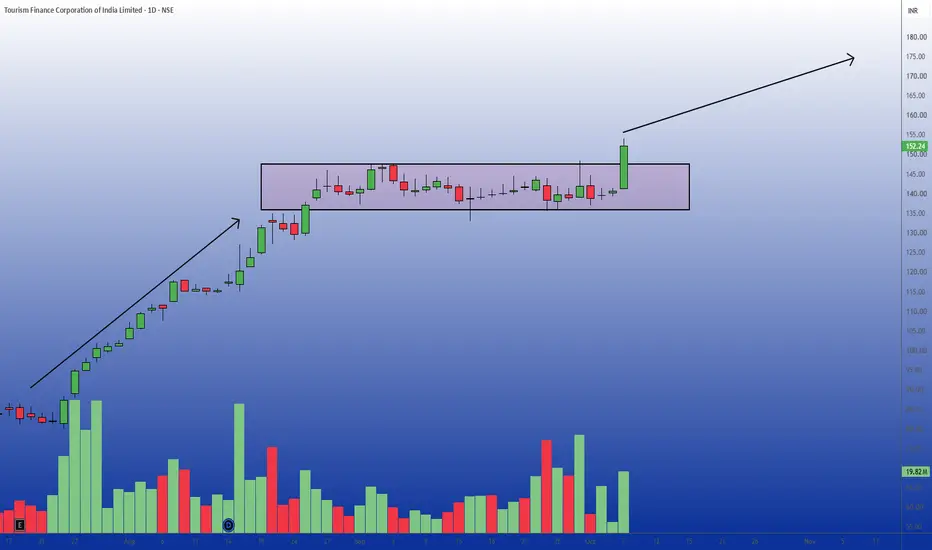
TFCILTD Bullish Breakout from Consolidation Phase on DailyOn the daily timeframe, Tourism Finance Corporation of India Limited has demonstrated a strong preceding uptrend, rallying significantly before entering a period of sideways movement.
Over the past several weeks, the price has been consolidating within a well-defined rectangular box, bouncing between structural support near 135 and resistance near 146-147.
In the most recent trading session, a strong bullish candle broke out above the upper boundary of this consolidation zone, closing at 152.2
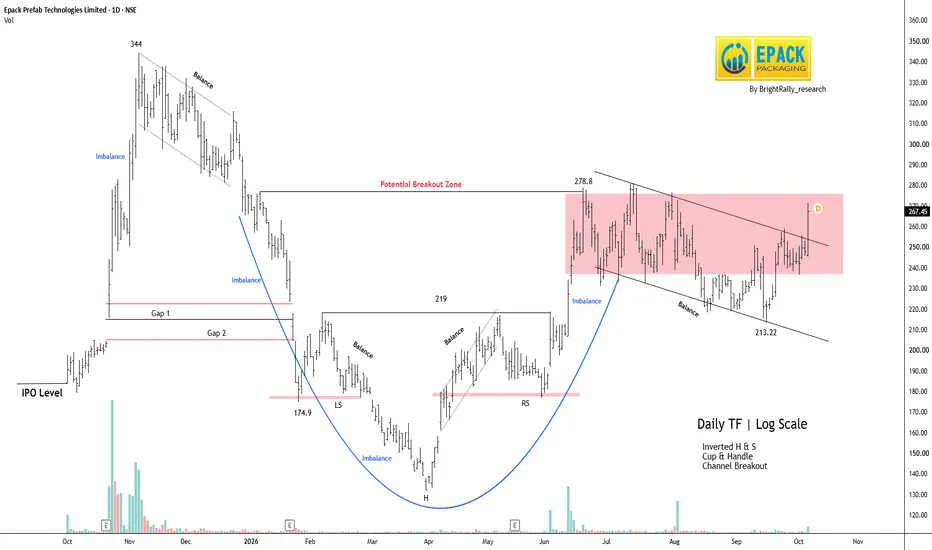
EPACKPEB: Bullish Breakout Setup, 278.8 Is the Key TriggerShort Term levels: 286 and 314
Intraday Support: 260
NSE:EPACKPEB is showing strong bullish momentum after breaking above the recent channel. Price is now near 267, with buyers clearly in control. The main hurdle is 278.8; a clean breakout can strengthen the move. Volume expansion would add confidence to the breakout.
On the downside, 250 is the first important support to watch. As long as price holds above this area, the bullish setup remains intact. A move below 240 would weaken the struc
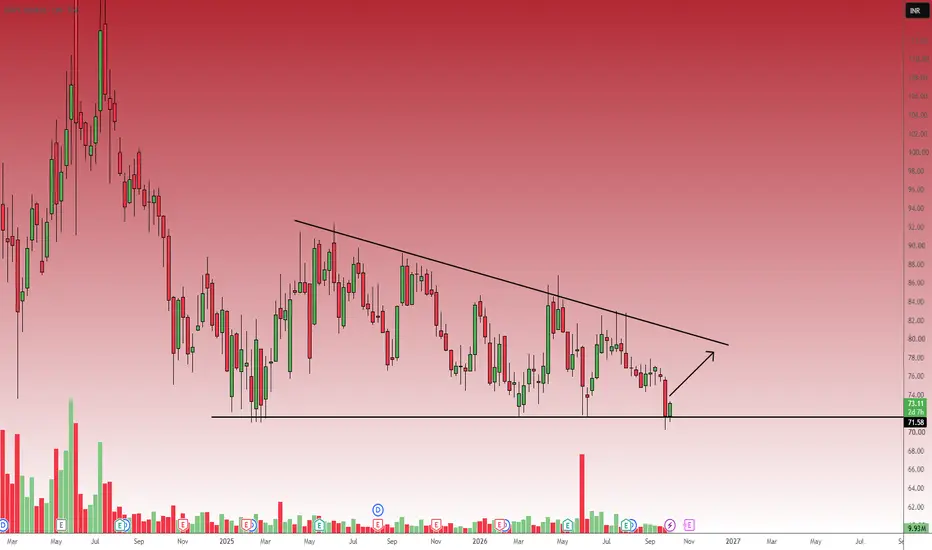
NHPC High Risk:Reward Rebound from Major Horizontal SupportBased on the weekly timeframe NHPC is currently at a critical technical juncture, compressing within a large structure bounded by declining highs and a flat support base.
Chart Analysis:
Major Support: The stock has established a highly resilient horizontal support zone around the 71.50 - 72.00 level (marked by the black horizontal line at 71.58).
The price has tested this floor multiple times over the past several months, and we are currently seeing a fresh bounce forming a bullish weekly can
Anand Rathi Wealth: Wave 5 Ahead or Bigger Wave (4)?From the March 2025 low of 797, this stock has almost tripled. The move fits a clean Elliott Wave structure.
Wave (1) and (2): Wave (1) ran from 797 to 1,660.7. Wave (2) fell to 1,353.9, taking back only 35.5% of wave (1). That's a shallow dip, which shows buyers stayed strong.
Wave (3) so far: Inside wave (3), wave 1 topped at 1,620.5 and wave 2 fell to 1,451.5. Wave 3 then ran to 2,268.4, about 3 times the size of wave 1, in five smaller waves: โ to โฅ. Wave 4 ended at 2,007.
Why the co
Urban Company (D): PATTERN BREAKOUTTimeframe: Daily | Chart Scale: Linear
Explosive +8.74% surge today backed by a massive 23.98M volume spike! ๐ฅ
Technical Highlights:
โ
Chart Pattern: Decisive breakout from a descending triangle consolidation.
โ
Volume Reversal: Volume rising over the past couple of days, breaking a recent dry spell.
โ
Momentum: Weekly EMAs in positive crossover. MACD & RSI rising (Daily/Weekly). ๐
Key Levels to Watch:
๐ฏ Target: 183
๐ก๏ธ Support / Pullback: 169 (Previous triangle resist
BHEL Strong Ascending Triangle BreakoutBased on the daily chart for Bharat Heavy Electricals Limited provided a clear bullish setup has materialized.
Technical Analysis & Reasoning:
Ascending Triangle Pattern: Since early June, the price action has steadily compressed, printing a series of higher lows along a well-defined, upward-sloping support trendline.
This accumulation pushed the price into a rigid horizontal resistance zone right at the 439.90 mark.
Confirmed Breakout: The most recent daily session resulted in a massive bulli