Neutral on BPCLBPCL can move either side.
Chart analysis shows it has broken the support zone and should head down towards 360 levels
But privatisation and fall in crude oil price can push the price up.
Due to coronavirus, the market is mostly based on the news rather than technical.
Upside target of 503
Crude Oil Brent
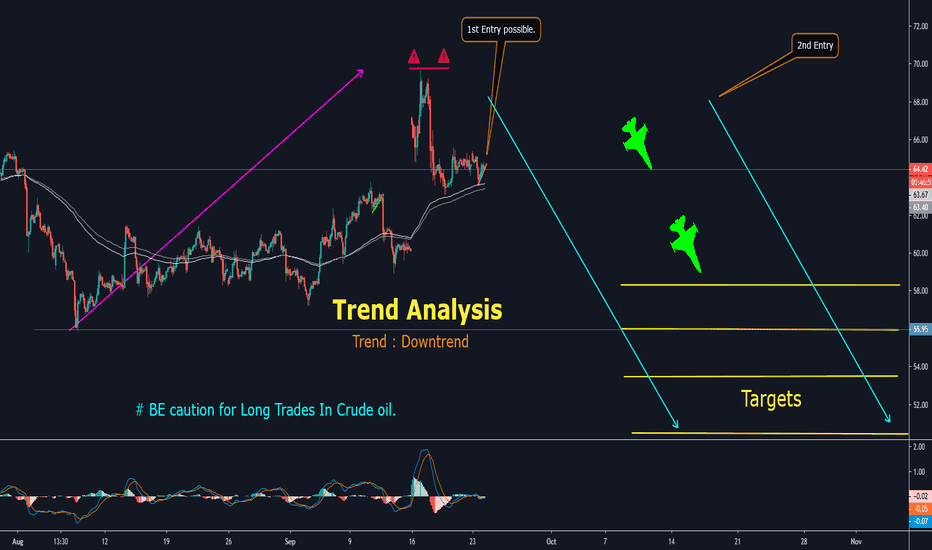
Crude Oil Trend Analysis & Trade Setup !!TREND ANALYSIS & TRADE SETUP
Follow Chart Instruction.
Do not be Hurry for entry.
Wait for Proper Entry Setup.
Buy/Sell with Best Risk Reward.
Educational Chart Only.
You can Comment and ask the TREND ANALYSIS of any STOCK/SCRIPT/INDEX/FOREX.
Wait for entry setup, if available then Long/short.
R:R is 15 to 20 times.
Crude Oil Trend Analysis & Trade Setup !!TREND ANALYSIS & TRADE SETUP
Follow Chart Instruction.
Do not be Hurry for entry.
Wait for Proper Entry Setup.
Buy/Sell with Best Risk Reward.
Educational Chart Only.
You can Comment and ask the TREND ANALYSIS of any STOCK/SCRIPT/INDEX/FOREX.
Wait for entry setup, if available then Long/short.
R:R is 8 to 12 times.
Crude Oil Downtrend & Trade Setup !!TREND ANALYSIS
Follow Chart Instruction.
Do not be Hurry for entry.
Wait for Proper Entry Setup.
Buy/Sell with Best Risk Reward.
Educational Chart Only.
You can Comment and ask the TREND ANALYSIS of any STOCK/SCRIPT/INDEX/FOREX.
Wait for 2nd entry setup, if available then short.
R:R is 8 to 15 times.
Crude | Inventory levels driving the Price -Watch EIA data todayOn the back of Crude inventories data released by American Petroleum Institute(API), according to which inventories fell less than expected, the commodity declined sharply citing lower demand. For further confirmation of the same one can watch crude inventories data about to be released by US government's Energy Information Administration (EIA) at 20:00 Hrs IST. Since the expectation is already set on a lower than expected fall in inventory, possibility of further fall in price is minimal as the information is already priced in, unless the data is unexpectedly skewed.
Technically, price drop has dragged Brent to the lower end of the Rising channel pattern and as we could observe, it still holds valid. Evaluating previous price movements we could detect a demand area around 63.60. Besides notice that 64.70 is also an influential level to which the price could react. Interestingly, the range i.e. 63.60-64.70 is also defined by 38% and 50% of Fibonacci levels thus making the space an essential level to be broken for a decisive trend.
Summing up, assuming that EIA does not throw any surprise Brent could undergo a short period of consolidation between the above mentioned range. Subsequent trend will be established in the direction of the breakout.
Trade Plan:
1. Until either of 63.60 or 64.70 is breached, Sell @ 64.70 and Buy @ 63.60 (typical range trading)
2. A close above 64.70: Buy with stop below 63.50 with targets @ 65.70, 66.70 and 67.40 (trail stop loss as we traverse through these levels)
3. A close below 63.60: Short with stop above 65 with targets @ 62.50 and 60 (trail stop loss as we traverse through these levels)
(Note: Expect higher volatility when EIA releases the data at 20:00 Hrs IST. Similar level of fall as per API is not expected to have an impact on price; a comparatively lower drop in inventories could weaken Crude further and alternatively, a comparatively higher drop in inventories will lead Crude to higher levels erasing its losses)
(Disclaimer: Our charts and contents are just for the purpose of analysis, learning and general discussion. Do not consider these as trading tips or investment ideas. Trading in Stocks, Futures and Options carry risk and is not suitable for every investor. Hence it is important to do your own analysis before making any investment or trading decisions based on you personal circumstances and it is always better to take advice from professionals)


