BHARTIARTL (Airtel) – Daily Chart | Simple Long SetupBharti Airtel is currently pulling back after a strong up-move and has reached an important support area. Price is also near an upward trendline, which often acts as support.
🔹 Trend: Overall trend is up
🔹 Support Zone: Marked grey area
🔹 Entry Idea: Buy if price holds above support
🔹 Stop Loss: Below the red zone (support break)
🔹 Target: Previous highs / upper green area
📌 Why this setup makes sense (simple):
Price is in an uptrend
It came down to a support level
Trendline support is also present
Risk is small compared to reward
📈 If the price stays above support, it can move higher again.
⚠️ If it breaks and closes below support, avoid the trade.
💡 For learning purpose only. Always use stop loss.
Uptrend

Hindustan Copper BullishNovember quarter report revenue reported- 7.18B
After a long down trend now stock is break all time high on 26 dec 2025.
Technical Analysis: after breakout stock take retracement at 225 and make a sustain up move tillrange 325-365.
support range 285-400
You can enter here 464 with a stoploss of range 285-400,
Buying Zone range : 285-400

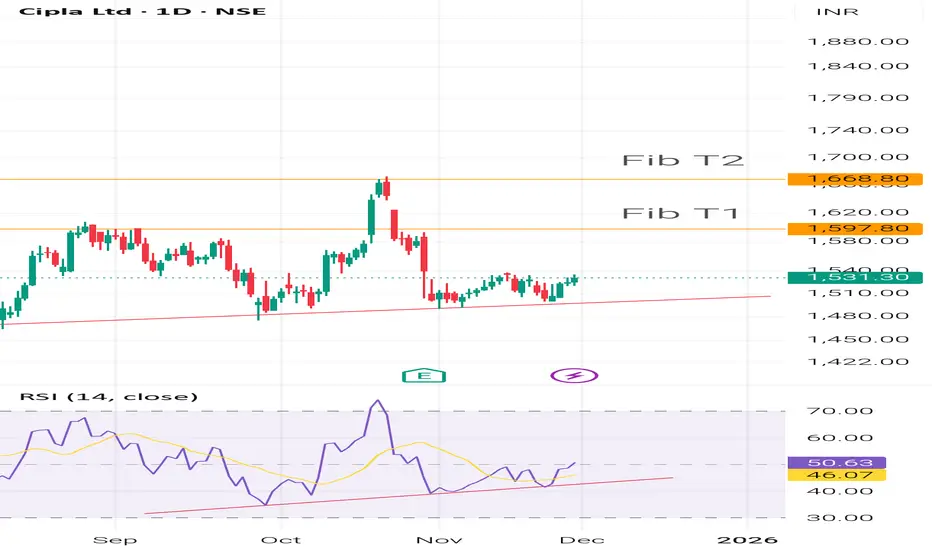
Potential Upside The Stock has potential upside for two reasons:
1. Stock is showing Uptrend with Higher lows and has taken support on trend line.
2. The Rsi of the stock is also supporting Uptrend.
The two targets can be set at the next Fibonacci Levels.
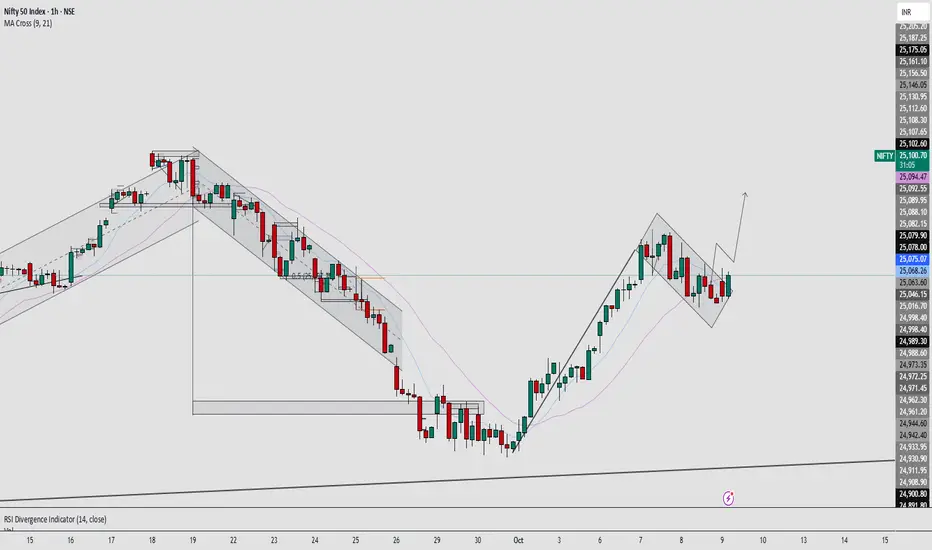
NIFTY 50 – Bullish Flag Breakout in Progress | Continuation NIFTY 50 is showing a clean bullish flag breakout on the 1H chart after a strong impulsive leg from recent lows.
This consolidation phase acted as a flag correction, where price stayed within a downward-sloping channel before breaking to the upside.
The breakout suggests a continuation of the existing uptrend , supported by price closing above the EMA cluster and reclaiming short-term momentum.
Key Observations:
🚀 Impulsive bullish rally followed by tight flag formation.
🔹 Breakout candle confirming strength above 25,080 zone.
📈 If momentum sustains, next upside targets are 25,180 → 25,250 → 25,300.
⚠️ Invalid if price falls back below 25,05 0 with strong volume.
NIFTY breaking out from a bullish flag pattern 🚀
Continuation setup in play after a strong impulse move.
🔹 Above 25,080 = bullish
🔹 Targets: 25,180 / 25,250 / 25,300
🔹 Invalidation: below 25,050
#NIFTY #PriceAction #Breakout #BullishFlag #TechnicalAnalysis #HenishMavani
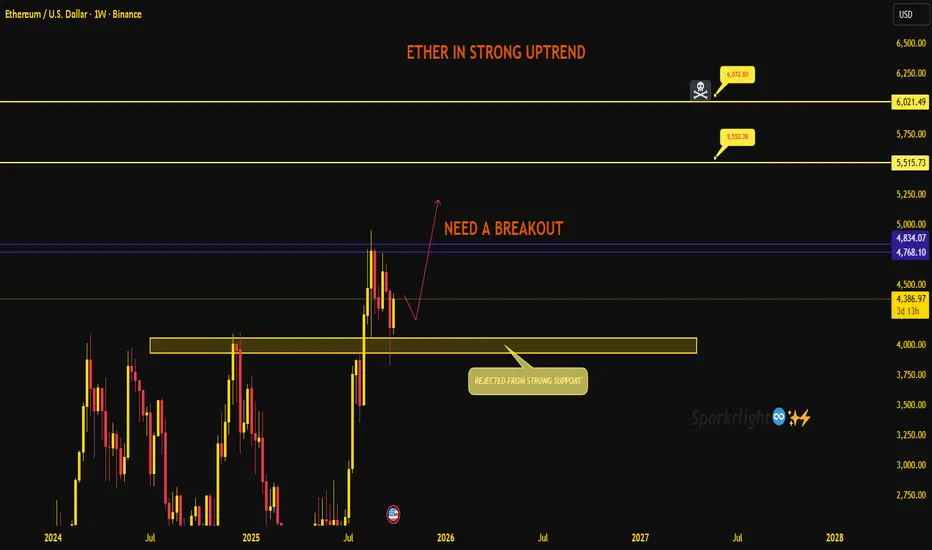
Ethereum – Strong Uptrend but Needs a Breakout!!Ether is still holding its strong uptrend, and the recent rejection from support has kept the bullish structure intact. The bigger picture remains positive, but short-term price action now demands a clear breakout to confirm continuation.
Current structure:
Price bounced cleanly from the 4000 zone, showing that buyers are defending the base.
The rally stalled just below the 4800–4850 resistance. This is the key barrier that needs to give way for the next leg higher.
Until then, we are stuck in a consolidation between strong support below and heavy resistance above.
Key levels to track:
Support: 4050–3950. As long as this zone holds, bulls keep the upper hand.
Breakout zone: 4768–4834. A weekly close above here should trigger momentum buyers.
Upside targets: 5515 → 5550, and if momentum extends, 6,000+.
Short-term view:
Ethereum is in a strong trend but needs that breakout above 4,800 to unlock the next wave higher. If buyers fail to push through, expect more back-and-forth action near support before another attempt.
The structure favors patience – wait for the breakout confirmation rather than chasing inside the range. Trade safe.
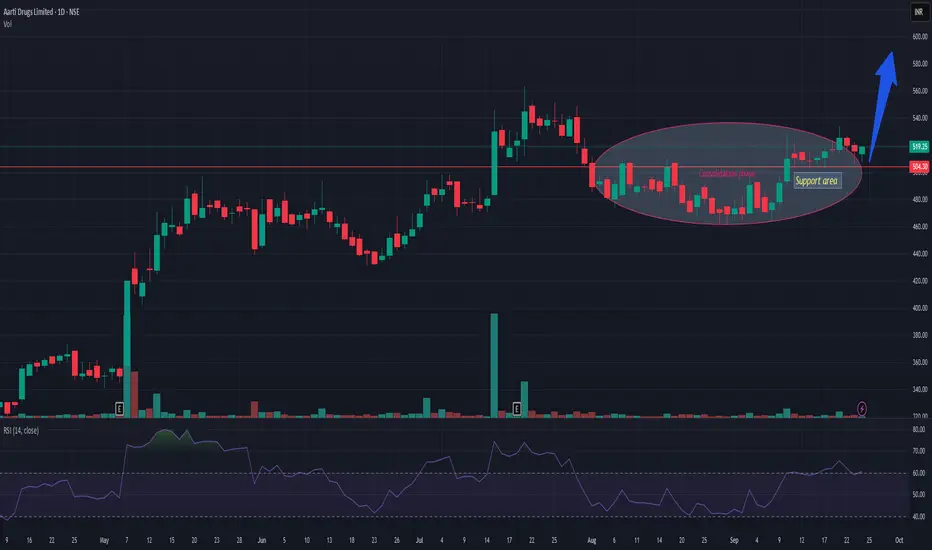
AARTIDRUGSAARTIDRUGS is trading in long consolidation zone with dried volume. Support zone is near 495-500. Currently trading near 515-17. Once it gets market participation then the probability of resuming continuation of uptrend is very high. Risk reward is quite in favor. Keep it in your watch list.
NMDC By KRS Charts9th June 2025 / 19:01
Why NMDC?
1. Dow Theory , it turned into Bullish Trend with Higher Highs & Higher lows.
2. Huge Accumulations since many Years and as I said above HHs & HLs.👆
3. In major timeframes stock is above 100EMA which is sign that more upside might possible.
4. Wave counts are picture perfect with more than 0.618 retracement for wave(2) and Reversed to upside from 0.5 Retracement between wave(2) & wave4 bottom points.
Targets & SL is mentioned in Chart.
NSE:NMDC NSE:CNXMETAL

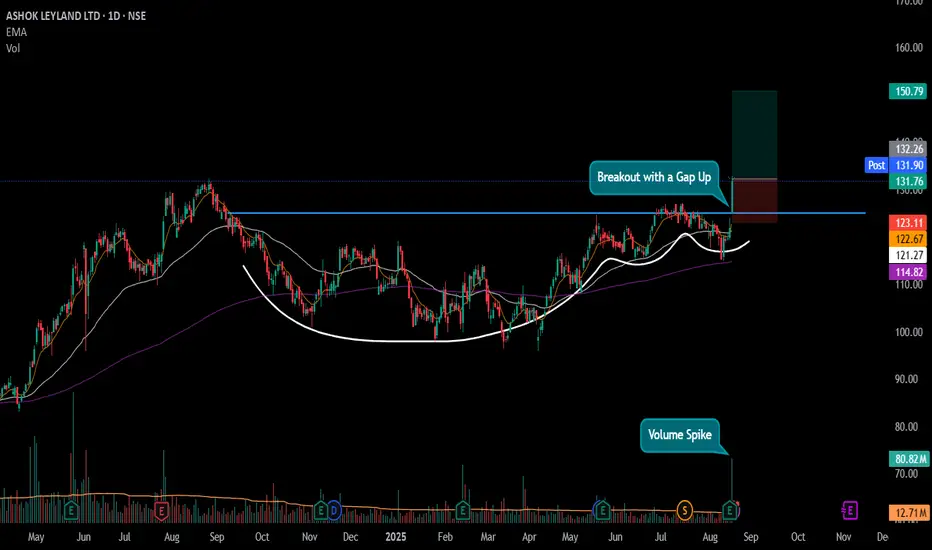
#ASHOKLEY - VCP Breakout in Daily Time Frame Script: ASHOKLEY
Key highlights: 💡⚡
📈 VCP Breakout in Daily Time Frame
📈 Price gave a Gap Up Breakout
📈 Volume spike during Breakout
📈 MACD Bounce
📈 Can go for a swing trade
BUY ONLY ABOVE 132 DCB
⏱️ C.M.P 📑💰- 131.90
🟢 Target 🎯🏆 – 14%
⚠️ Stoploss ☠️🚫 – 7%
⚠️ Important: Market conditions are Okish, Position size 50% per Trade. Protect Capital Always
⚠️ Important: Always Exit the trade before any Event.
⚠️ Important: Always maintain your Risk:Reward Ratio as 1:2, with this RR, you only need a 33% win rate to Breakeven.
✅Like and follow to never miss a new idea!✅
Disclaimer: I am not SEBI Registered Advisor. My posts are purely for training and educational purposes.
Eat🍜 Sleep😴 TradingView📈 Repeat 🔁
Happy learning with MMT. Cheers!🥂
UltraTech Cement | Pullback Opportunity after Breakout?Description:
- After breaking out of a consolidation zone, UltraTech Cement is showing a controlled throwback towards prior resistance, now acting as support.
- Weekly structure remains intact with sloping EMAs and positive momentum.
- Daily & Hourly charts show minor weakness but no structural breakdown.
- EFI suggests lower TF selling pressure, while weekly remains stable.
📌 Entry Zone: ₹12,037
📉 Stoploss: ₹11,850 (ATR-based)
🎯 Targets: ₹12,937 → ₹13,139 → ₹13,427
Cement sector is gaining strength in the broader infra rally — watching for confirmation on bounce from support.

Can HDFC Bank pull Nifty up?HDFC Bank may maintain its support in the ongoing Wave 2. If this kicks in, we may see Nifty going up again, possibly tomorrow.

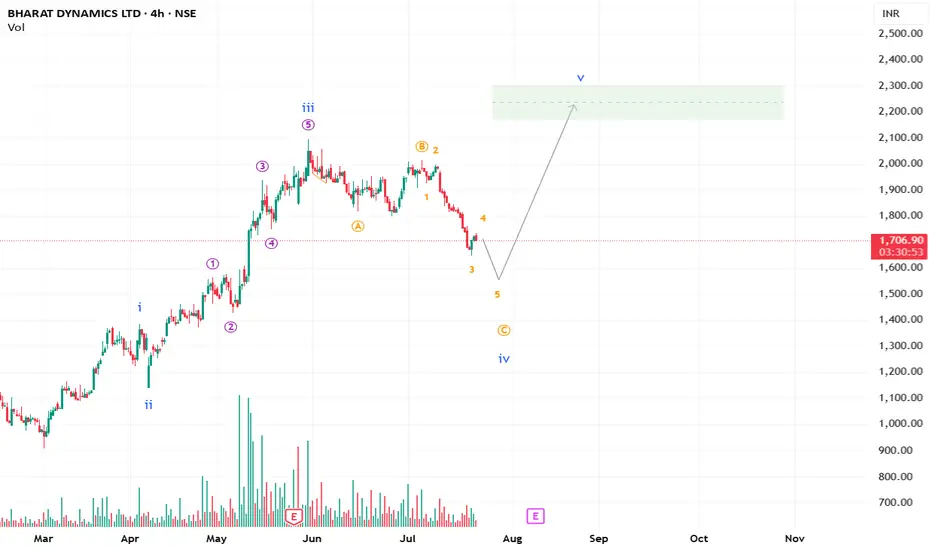
IS BDL ready to move after an intraday fall?A beautiful 5-wave structure looks to be in place for BDL. A little patience may be required to get more clarity.
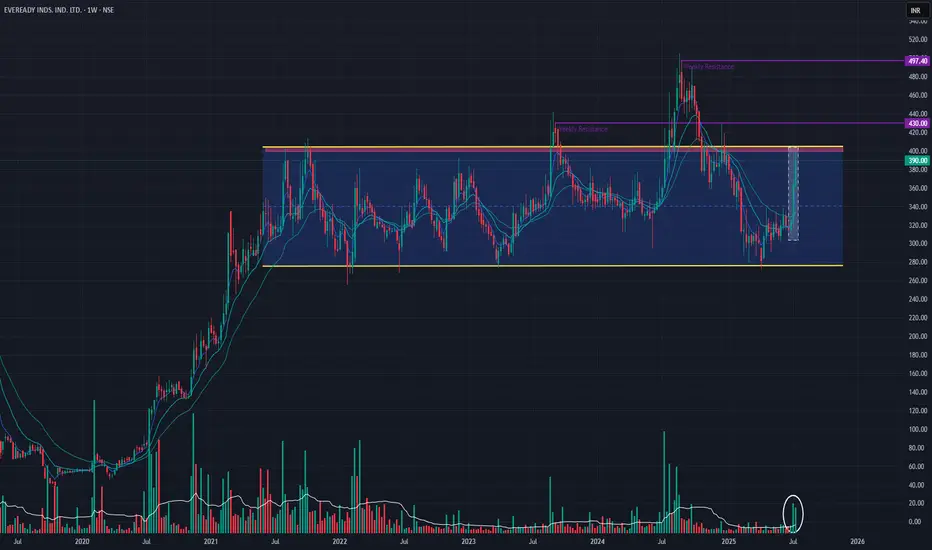
Eveready Inds. Ind. Ltd (Weekly Timeframe) - Potential BreakOutThe stock has been in a range since 2021, with couple of BreakOuts (2023 & 2024) which did not sustain momentum. Past 3 weeks the stock has gained appox: +29% with huge volume buildup . The short-term EMAs are in PCO state, indicating an uptrend . The stock may BreakOut of the resistance zone (398 - 406), if buyers show interest in the stock to take it further up.
Watchout for next week's price action!!
Parag Milk Foods Ltd - Potential BreakOutThe stock has not been able to BreakOut of one of the major resistance zone - 265 - 268 (since March 2019) for a while. Since past few weeks the volume is increasing and a potential BO could be likely. Positive Cross-Over of short term EMAs are also visible which may indicate a potential uptrend and BO.

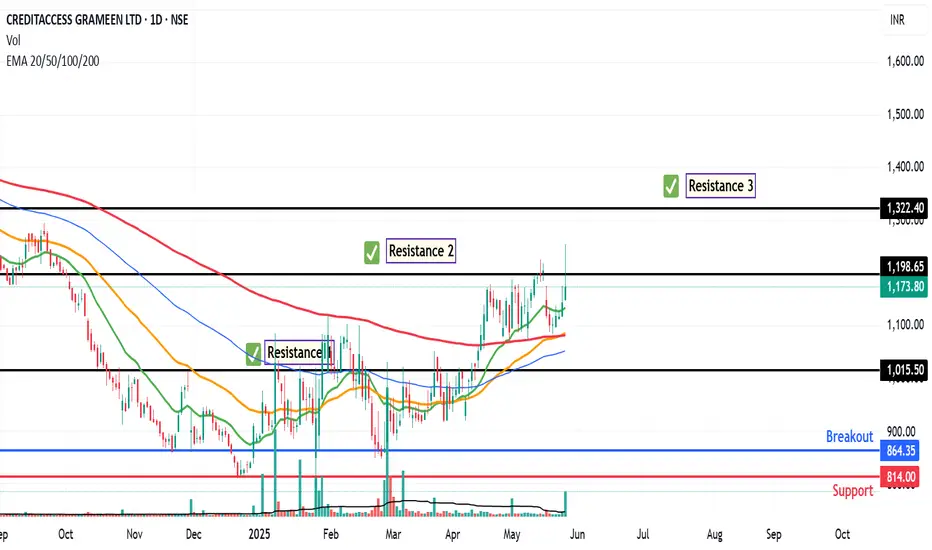
CREDITACC: The breakout setup is in playThe chart of CREDITACC provides delineates critical price thresholds that signify breakout points, along with specific support levels that serve as indicators of where buying interest may manifest.
Additionally, the chart highlights regions likely to act as ceiling points for future price ascensions, allowing for informed decisions on entry and exit strategies.
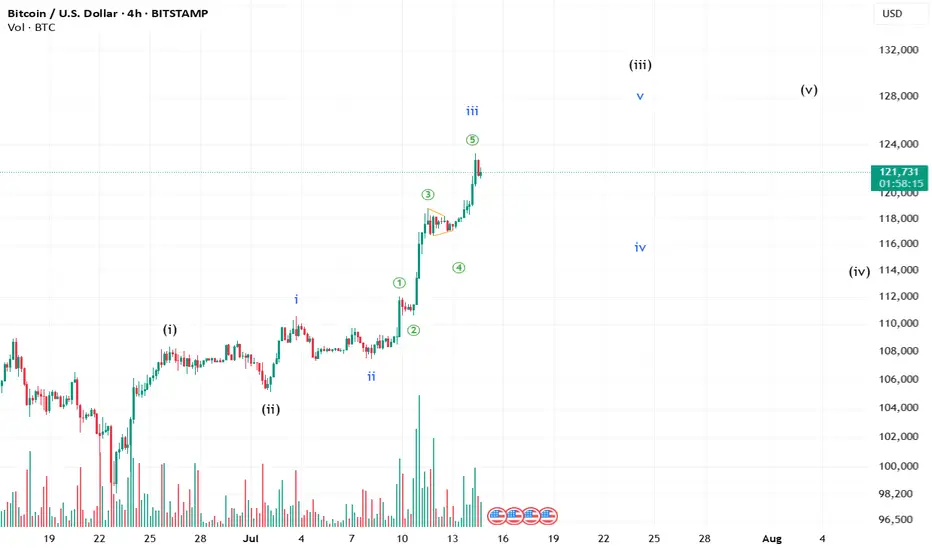
There is some steam still left in BTC!!BTC might still try again to push the levels to complete its sister waves. Whether it will sustain in the future is still yet to be answered.
**This is an educational market outlook, not investment advice. Please consult a SEBI-registered advisor before taking any investment decisions.**
Ooooo! What do we have here? #Reliance If we look at Reliance, we can see how beautiful and synced the counting may look and feel. Can it become the reason for some good news in Nifty? Fingers Crossed!!

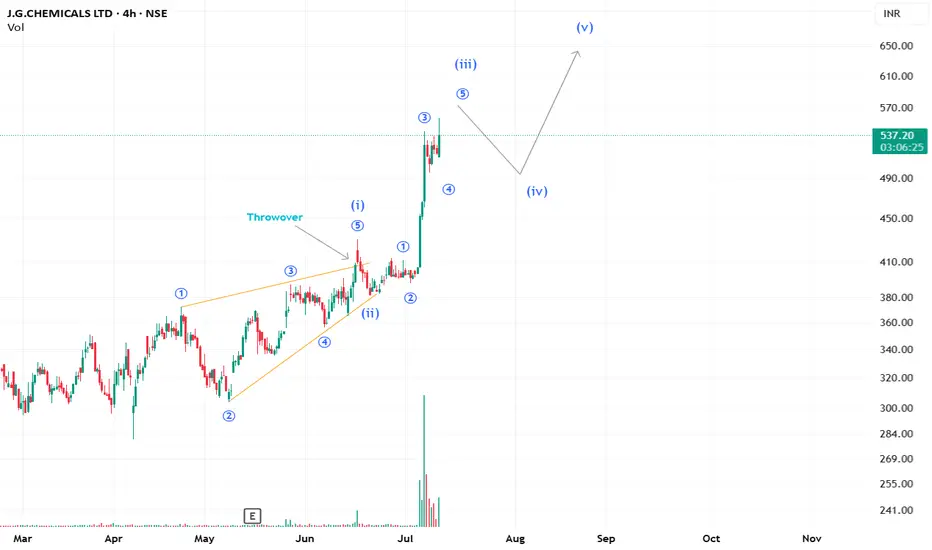
A good 5 wave patterns unfolding in J.G.ChemicalsCurrently, it seems that J.G. Chemicals is unfolding into a clear extended 3rd wave move. We may see a retracement and then a resumption of the trend.
Love,
PipVoyager
**This analysis is based on the Elliott Wave Principle.
This analysis is for educational purposes only and not investment advice.
Please consult your SEBI-registered advisor before making any investment decisions. Markets are subject to risk.**
PVR Channel Break out - Upside 5% Gain (short term)PVR INOX: Setting the Stage for a 5% Upside?
PVR INOX Ltd is showing signs of a potential breakout, with technical indicators aligning for a short-term upside of around 5%. On the hourly chart, the stock is consolidating above key EMAs (968–970 zone), forming a bullish structure supported by a rising trendline.
Current Price: ₹974.50
Upside Target: ₹1,020+
Indicators: EMA confluence, breakout from descending channel, volume uptick
Morning Doji Star - Bullish (Emerging) 1 day Time frame
What’s fueling the optimism?
- 🔥 Strong box office performance in early 2025, with collections up 39% YoY in Jan–Feb
- 🎟️ Highest-grossing February since COVID, led by hits like Chhaava
- 💼 Promoter stake increase and bullish brokerage calls (ICICI Securities sees up to 100% long-term upside)
With a robust content pipeline and improving fundamentals, PVR INOX might just be ready for its next act.

#WINDMACHIN – Swing Trade Setup Alert📊 #WINDMACHIN – Swing Trade Setup Alert
🔸 VCP setup spotted on the Daily Time Frame (DTF)
🔸 Volume spike observed
🔸 Price consolidating near Resistance (RT)
📌 If a breakout (BO) occurs with strong volume, it could present a solid swing trade opportunity.

Technical Analysis Report: SMS Pharmaceuticals Ltd1. Bullish Flag with Pole (June–July 2024)
Bullish Flag with Pole: A continuation pattern formed after a strong upward price move (the pole), followed by a short-term consolidation (the flag), signaling the potential for another breakout upward.
Price Action: Strong impulsive rally formed the flagpole, followed by a tight consolidation forming the flag 🚩.
Breakout: Confirmed with a high-volume breakout to the upside.
Target: Achieved a massive 40% gain in under a month.
Analysis: A textbook bullish continuation pattern; traders capitalized on early entry post-breakout.
2. Distribution Phase (August–October 2024)
Distribution Phase: A sideways trading range after an uptrend where smart money or institutions start offloading their holdings. Typically a precursor to a market reversal or downtrend.
Market Structure: After the sharp uptrend, price entered into a horizontal range.
Phase Characteristics: Low volatility, repeated rejections at resistance, high volume on down days—signs of distribution.
Interpretation: Institutions likely booking profits, signaling a potential trend reversal.
Trader Sentiment: Shifted from bullish to neutral/bearish.
3. Triple Top Formation (Within Distribution Phase)
Triple Top Pattern: A bearish reversal pattern marked by three failed attempts to break above a resistance level, indicating weakening momentum and a potential downtrend.
Resistance Level: Same peak tested three times without breaking.
Breakdown: Confirmed after the third top with a decisive drop.
Target: Achieved a "30% downside" move via "short selling", all within a month.
Insight: Classic reversal pattern, effectively timed with distribution.
4. Bearish Flag with Pole (During Triple Top Breakdown)
Bearish Flag with Pole: A continuation pattern during a downtrend. It starts with a sharp decline (pole), followed by a minor upward consolidation (flag), suggesting further downside.
Formation: Sharp decline (pole) followed by a brief upward consolidation (flag).
Breakdown: Continuation to the downside, achieving projected target.
Target: Fully achieved within the same downtrend cycle.
Conclusion: Reinforced the bearish sentiment and amplified the down move.
---
5. Accumulation Phase + Triple Bottom (December 2024–April 2025)
Accumulation Phase: A market phase where a stock trades in a range after a downtrend, as buyers (often smart money) gradually build positions, typically leading to a bullish reversal.
A Triple Bottom is a bullish reversal chart pattern that forms after a downtrend, marked by three equal lows indicating strong support and a potential trend reversal to the upside.
Phase: 5-month Accumulation Phase
Pattern: Triple Bottom during this period indicated strong support and buyer presence.
Breakout: Occurred with a bullish breakout post third bottom.
Target: 20% upside achieved within a month post-breakout.
Observation: Long-term investors and smart money potentially entering positions.
6. Rounding Bottom in Progress (May 2025)
Pattern: Rounding Bottom (Still Forming)
Current Price Action: Gradual curve formation with decreasing volume on the left and increasing volume near the neckline— a bullish sign.
Expectation: Anticipated upside breakout in the coming days.
Outlook: If confirmed, this could mark the start of a new bullish cycle.
📌 Summary:
SMS Pharmaceuticals Ltd. has shown a textbook series of technical patterns—from trend continuations to reversals, distribution to accumulation, and now a potential new uptrend. Each phase was actionable, with clear breakout/breakdown points and well-achieved targets.

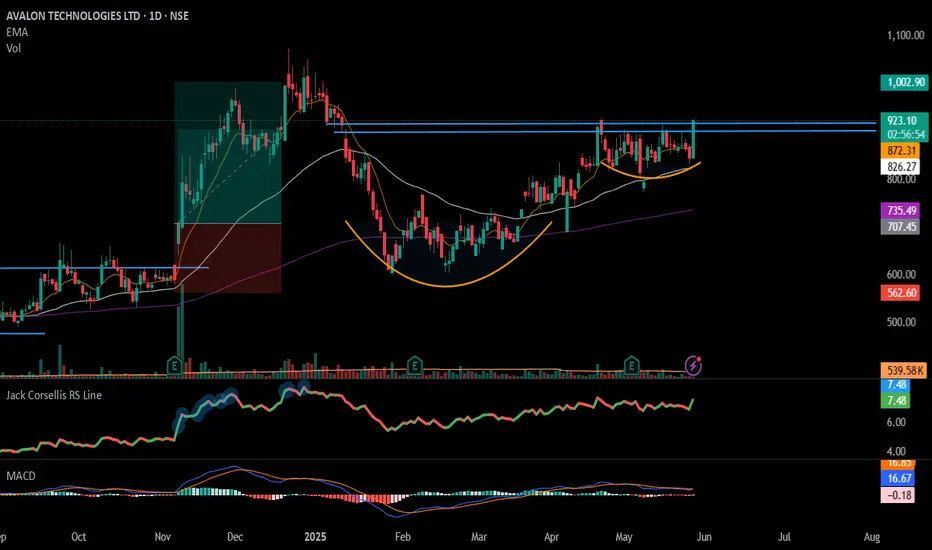
#AVALON - Cup & Handel Potential BreakOut / Keep In WatchList📊 Script: AVALON
Key highlights: 💡⚡
📈 Cup & Handel Potential BreakOut in Daily Time Frame.
📈 Price consolidating near Resistance.
📈 Wait for Volume spike during Breakout
📈 MACD Bullish
📈 Can go for a swing trade
BUY ONLY ABOVE 930 DCB
⏱️ C.M.P 📑💰- 915
🟢 Target 🎯🏆 – NA%
⚠️ Stoploss ☠️🚫 – NA%
⚠️ Important: Market conditions are Okish, Position size 50% per Trade. Protect Capital Always
⚠️ Important: Always Exit the trade before any Event.
⚠️ Important: Always maintain your Risk:Reward Ratio as 1:2, with this RR, you only need a 33% win rate to Breakeven.
✅Like and follow to never miss a new idea!✅
Disclaimer: I am not SEBI Registered Advisor. My posts are purely for training and educational purposes.
Eat🍜 Sleep😴 TradingView📈 Repeat 🔁
Happy learning with MMT. Cheers!🥂
IGL looks good to buy at 205 levelsDate: 24-May-25
After hovering around 201 levels IGL has closed above 205. Trapped short sellers may rush to cover their positions if IGL sustains above 202 to 205 region.
In the coming week of 26th May onwards it is likely to touch 207.4 to 212.4

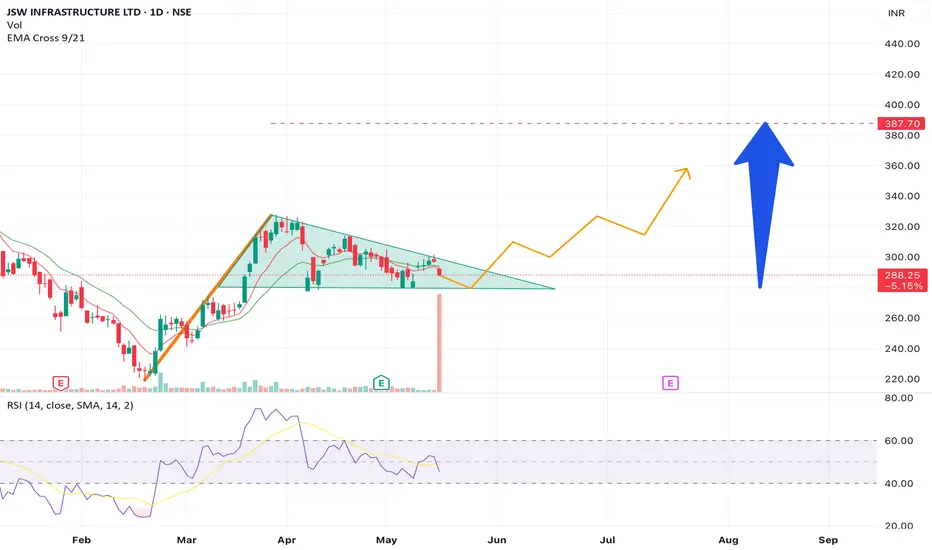
JSW Infrastructure got a huge volume transaction. Long probableA super huge volume transaction has happened in JSW infra. It has formed flag and pole pattern in recent times breakout from the pattern has a probable upside with significant return.