#BTCUSDWhat’s Next in Bitcoin? 🚀💡
After completing its 5-wave bull run 📈, Bitcoin entered a corrective phase starting on October 3, 2025, which recently completed its A wave on February 5, 2026.
🔍 Breaking down the A wave:
1️⃣ Wave 1: Low formed on October 11
2️⃣ Wave 2: Flat correction completed on October 30
3️⃣ Wave 3: Sharp decline to $80K on November 21 ⚠️
4️⃣ Wave 4: Flat correction rebound, completed on January 13, 2026 🔄
5️⃣ Wave 5: Final drawdown to $60K 💥📉
✨ What’s next?
Bitcoin is now poised to enter its B wave, a classic ABC 3-wave structure:
⚡ Initial bounce: sharp and fast
⏳ Followed by grinding upward momentum
🎯 Potential target: $95K zone
💬 This corrective rally will be crucial in shaping sentiment, positioning traders, and setting the stage for the larger C wave. Stay alert, watch the signals 👀, and prepare for volatility ahead 🌊.
Us100

NAS100 – Range extension Play from discount area.🔍 Market Context
Nasdaq is currently reacting from a discount area with confluence from the 24700 support zone and the lower trendline support. Price has shown signs of holding this level, indicating a potential bullish pullback toward premium levels.
📘 Trade Idea (Long Bias)
Entry: 24700
Stop-Loss: 24550 (below structural support + trendline)
Take-Profit Targets:
TP1: 25000
TP2: 25175
This setup anticipates a reaction from the discount zone back toward equilibrium and previous supply levels.
📌 Notes
Confluence of discount pricing, trendline support, and horizontal support increases probability.
Structure remains bearish overall, so this is a counter-trend pullback long—manage risk accordingly.
⚠️ Disclaimer
For educational purposes only. Not financial advice. Follow for more ideas.

US100 | 15MNarrative Overview:
Following an aggressive sell-side liquidity raid, price delivered a reactive displacement from a higher-timeframe demand cluster, signaling the presence of institutional buy orders defending discount pricing. The rejection wick into the demand zone suggests a classic liquidity engineering event rather than genuine bearish continuation.
Market Structure:
The broader intraday flow remains rotational; however, the recent reaction establishes a potential short-term structure shift. The failure to achieve sustained acceptance below the demand zone implies seller exhaustion and the likelihood of a mean reversion toward premium.
Liquidity Map:
Sell-Side Liquidity: Resting below 25,250, now partially mitigated after the sweep.
Internal Liquidity: Compression above current price indicates stop accumulation from early longs.
Buy-Side Targets: 25,380 to 25,420 aligns with prior distribution and inefficient pricing.
Imbalance & Order Flow:
The impulsive bullish candle emerging from the zone created a micro fair value gap, reinforcing the probability of algorithmic repricing higher. When displacement originates from discount, it often signals smart money transitioning from accumulation to expansion.
Trade Logic:
The optimal execution model favors continuation toward premium, provided price maintains acceptance above the reclaimed demand.
Bullish Path:
A controlled retracement into the imbalance or the upper boundary of demand could offer refined entries targeting external liquidity. This would complete a discount-to-premium delivery cycle.
Risk Scenario:
A decisive break with displacement below the demand zone would invalidate the accumulation thesis and expose deeper sell-side liquidity, likely inviting bearish continuation.
Key Insight:
What appears to be a simple bounce is structurally more significant; institutions rarely defend a level without intent. Monitor how price behaves during pullbacks. Strong markets do not revisit deeply mitigated demand unless distribution is underway.

US100 LONG SETUP — “Major Liquidity Sweep Into Demand US100 has aggressively dropped into a major higher-timeframe demand zone, sweeping liquidity below previous lows and tapping into a strong bullish reaction block. This move also aligns perfectly with the rising trendline support from recent structure.
The sharp sell-off looks like a liquidity grab / stop-hunt, making this a high-probability long setup.
Description:
Price broke down impulsively and cleared all buy-side liquidity sitting below 25,350–25,300 levels. After the sweep, US100 has entered a clean demand zone highlighted in red, which was a strong origin of previous bullish expansion.
This is a classic smart-money setup:
✔ Liquidity sweep
✔ Entry in demand
✔ Trendline confluence
✔ Price in deep discount
A bullish reversal from here is highly likely if buyers defend this zone.
Trade Plan (Suggestive)
Entry Zone: 25,230 (inside the demand zone)
Stop Loss: Below demand zone at 25,080
TP1: 25,550
Risk–Reward: ~1:2

US100 – Rejection From Discoun Zone + Trendline TapBias: Bullish Reversal (Counter-Trend Move Toward Premium)
Strategy Basis: SMT / Premium–Discount / Liquidity Sweep
📖 Trade Idea Description
US100 has tapped into a higher-timeframe ascending trendline support after delivering a sharp sell-off. Price swept the recent sell-side liquidity, reacted from the discount zone, and instantly showed strong bullish displacement.
This rejection aligns perfectly with:
✔ Retest of previous demand zone
✔ Liquidity grab below equilibrium
✔ Rejection wick forming bullish orderflow
✔ Discount pricing inside the PD Array
✔ Premium to discount rebalancing setup
Price has now reclaimed structure and is respecting the trendline, indicating possible continuation higher toward the premium zone.
🟢 Long Setup
Entry: 25,152 (after trendline rejection)
Stop Loss: Below discount zone – 24986
Take Profit: 25,500 (mid-range liquidity
🎯 Trade Narrative
Market has entered a deep discount after taking out major liquidity. The violent wick gives a clue that smart money stepped in. As long as price sustains above the demand + trendline, we anticipate a bullish push toward the imbalance and premium area.
This setup remains valid as long as price holds above the trendline and discount block.
For Educational purpose only.

GBPUSD - 15M (IDEA)FOREXCOM:GBPUSD
Hello traders , here is the full multi time frame analysis for this pair, let me know in the comment section below if you have any questions, the entry will be taken only if all rules of the strategies will be satisfied. wait for more Smart Money to develop before taking any position . I suggest you keep this pair on your watchlist and see if the rules of your strategy are satisfied...
Keep trading
Hustle hard
Markets can be Unpredictable, research before trading.
Disclaimer: This trade idea is based on Smart money concept and is for informational purposes only. Trading involves risks; seek professional advice before making any financial decisions. Informational only!!!

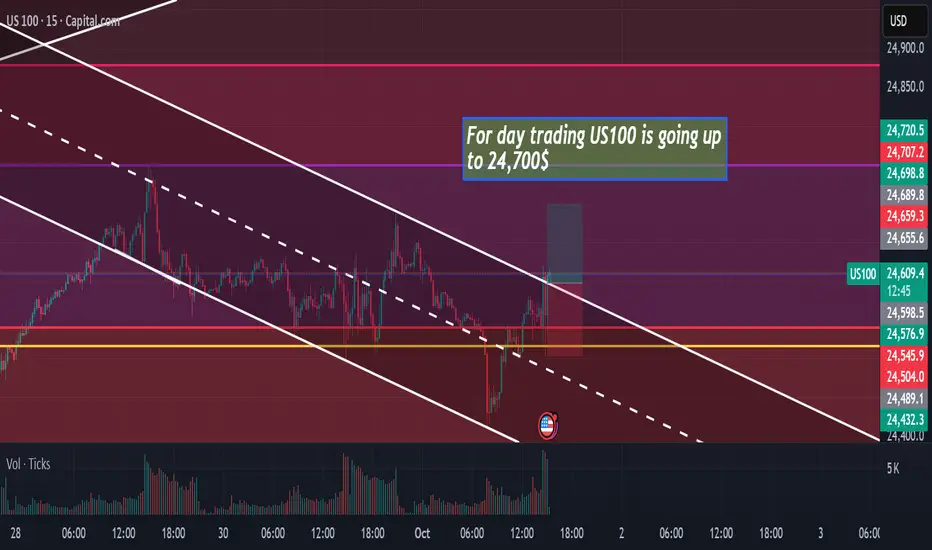
US100 is going UP TO 24,700$hello.
US100 is going up to 24,700$ in few minutes !! it's a buy opportunity on 15MIN time frame
Trade Idea: BUY GOLD (XAUUSD) at 2,993 – Target 3,035🔍 Technical Analysis (1H Chart):
Strong support zone at 2,993 – 2,984 USD:
This area has held well multiple times in recent sessions.
Confluence with the EMA33 low (2,998 USD) acting as dynamic support.
Price previously rebounded from this zone with a noticeable increase in volume.
Structure:
After a pullback to 2,993, the price rebounded to 3,017, indicating bullish demand.
A retracement back to 2,993 would offer a good entry point for a trend continuation buy.
Resistance / Profit Target at 3,035 USD:
This is the most recent local high and aligns with the downtrend line and higher EMA levels.
If price breaks above 3,035, the next potential target zone would be around 3,045–3,050 USD.
🧾 Trade Setup:
Entry: Buy Limit @ 2,993 USD
Stop Loss: Below 2,984 USD
Take Profit:
TP1: 3,031 – 3,033 USD (minor resistance)
TP2: 3,035 USD (major resistance)
🎯 Risk-to-Reward Ratio (R:R): ~1.8 to 2.5 – suitable for intraday or short swing trade setups.
⚠️ Risk Management Tips:
If price doesn't pull back to 2,993 and breaks 3,035 directly, wait for a retest of 3,031 for a breakout-entry strategy.
Keep an eye on upcoming U.S. economic news or Fed events, which could bring volatility.
Adjust stop-loss or secure partial profits during U.S. session for safety.

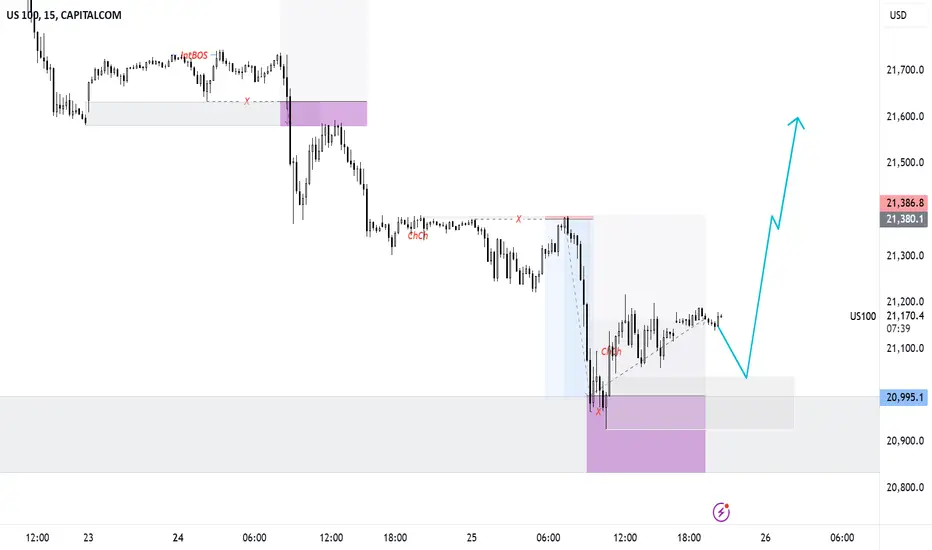
US100 View for feb last weekUS100 is reversing from the demand zone and waiting for the confirmation to enter buy side.
Here is the view for educational purposes
Buy zone is marked between 20926.5 - 21040.8. It will be the high probability area. So, wait for the confirmation before entry.
Trade with 1:3 RR and it might touch all time high again. Trade accordingly.
It might be weak below the marked zone.
Trade after the confirmation.
EURUSD - 1H LONGFOREXCOM:EURUSD
Hello traders , here is the full multi time frame analysis for this pair, let me know in the comment section below if you have any questions, the entry will be taken only if all rules of the strategies will be satisfied. wait for more Smart Money to develop before taking any position . I suggest you keep this pair on your watchlist and see if the rules of your strategy are satisfied...
Keep trading
Hustle hard
Markets can be Unpredictable, research before trading.
Disclaimer: This trade idea is based on Smart money concept and is for informational purposes only. Trading involves risks; seek professional advice before making any financial decisions. Informational only!!!

EURUSD LONGFOREXCOM:EURUSD
Hello traders , here is the full multi time frame analysis for this pair, let me know in the comment section below if you have any questions, the entry will be taken only if all rules of the strategies will be satisfied. wait for more Smart Money to develop before taking any position . I suggest you keep this pair on your watchlist and see if the rules of your strategy are satisfied...
Keep trading
Hustle hard
Markets can be Unpredictable, research before trading.
Disclaimer: This trade idea is based on Smart money concept and is for informational purposes only. Trading involves risks; seek professional advice before making any financial decisions. Informational only!!!

US100Dow has been reeling upwards post Trump Victory..
Can the rally extend upto 47K+ before Mr. Trump attains his office...
Probability are more...
But chances of being in a range bound trade are likely....
On a daily basis every dip near 43940 (CB) will be bought into.....
If closes below 43940 then possibility of lower levels (as marked)
watch out for more update....
Like.... Share... Comment

NASDAQ 100 Recession Price Analysis (Inverted Chart)- US100 is currently trading at 18,309
- We saw massive sell-offs last week in the US100 and other indices too
- It's approaching crucial areas and if it doesn't respect that and if we continue to see these expansionary candles towards the downside don't expect NASDAQ to pump anytime soon every pump is going to be a sell on rise
- However, before the CPI this can be a market reaction too and we can draw two conclusions from it
1) World Indices especially US Indices are factoring in bad CPI or a CPI above estimates
2) The CPI publication will be below the estimates so post that only we will see a bounce back the after 18th Sep that happens to be the FOMC rate decison

XAUUSD 1H ANALYSIS (TRADE SETUP)FOREXCOM:XAUUSD - 1H ANALYSIS
FOREXCOM:XAUUSD 1-Hour Analysis: Bullish Outlook
but Following Counter-Trend Trade
Chart Overview:
This FOREXCOM:XAUUSD 1-hour chart analysis highlights a bearish outlook following the break of a significant consolidation zone and a series of 1H High (HH) and 1H Low (HL).
***Key Points***
1. create Liquidity:
The chart making create liqudity with falling slowly
2. Lower Highs and Lower Lows in 5m :
Following the consolidation, the price action formed a series of Lower highs (LH) and Lower lows (LL), indicating a temporary Downtrend for Built Liquidity
3.Trend Line and Break:
A Falling trend line, shown in grey, connects the Lowe lows (LL). The recent price action broke below this trend line, suggesting a shift in momentum from bearish to bullish untill reach our Order-block.
4. Suppy and Demand Levels:
Supply Level : The Supply area around 2387.5 and 2389.7, is highlighted with a Red shaded zone. This level is expected to Short side Trade as a counter-trend trade.
Demand Level : The next significant Demand level is marked around 2357.9, indicated by another Green shaded zone.
5. Price Projection:
The analysis suggests a bearish as a retracement and Bullish as a Pro-Trend
6. Market Sentiment:
The sentiment is Bullish following the 1D Bullish Candle, with expectations of further downside
Retracement movement.
****Trading Plan****
Look for shorting opportunities on retracements towards the Supply zone around 2387.5 and 2389.7
Consider placing stop-losses just above the Supply zone to manage risk.
Target the Order-Flow level around 2362.61 for take-profits.
This analysis suggests a Short-Term bearish outlook for
FOREXCOM:XAUUSD , with a potential shorting opportunity on 50% retracementsof the Structure. Traders should ensure proper risk management and stay updated with any external economic factors that may influence the price
movement.

US OIL SHORTFX:USOILSPOT
Hello traders , here is the full multi time frame analysis for this pair, let me know in the comment section below if you have any questions, the entry will be taken only if all rules of the strategies will be satisfied. wait for more Smart Money to develop before taking any position . I suggest you keep this pair on your watchlist and see if the rules of your strategy are satisfied...
Keep trading
Hustle hard
Markets can be Unpredictable, research before trading.
Disclaimer: This trade idea is based on Smart money concept and is for informational purposes only. Trading involves risks; seek professional advice before making any financial decisions. Informational only!!!!

EURUSD TRADE SETUPFOREXCOM:EURUSD FX:EURUSD OANDA:EURUSD
Hello traders , here is the full multi time frame analysis for this pair, let me know in the comment section below if you have any questions, the entry will be taken only if all rules of the strategies will be satisfied. wait for more Smart Money to develop before taking any position . I suggest you keep this pair on your watchlist and see if the rules of your strategy are satisfied...
Keep trading
Hustle hard
Markets can be Unpredictable, research before trading.
Disclaimer: This trade idea is based on Smart money concept and is for informational purposes only. Trading involves risks; seek professional advice before making any financial decisions. Informational only!!!!

GBPUSD SHORTFOREXCOM:GBPUSD
Hello traders , here is the full multi time frame analysis for this pair, let me know in the comment section below if you have any questions, the entry will be taken only if all rules of the strategies will be satisfied. wait for more Smart Money to develop before taking any position . I suggest you keep this pair on your watchlist and see if the rules of your strategy are satisfied...
Keep trading
Hustle hard
Markets can be Unpredictable, research before trading.
Disclaimer: This trade idea is based on Smart money concept and is for informational purposes only. Trading involves risks; seek professional advice before making any financial decisions. Informational only!!!!

NASDAQ - IDEA - SETUPFOREXCOM:NAS100
Hello traders , here is the full multi time frame analysis for this pair, let me know in the comment section below if you have any questions, the entry will be taken only if all rules of the strategies will be satisfied. wait for more Smart Money to develop before taking any position . I suggest you keep this pair on your watchlist and see if the rules of your strategy are satisfied...
Keep trading
Hustle hard
Markets can be Unpredictable, research before trading.
Disclaimer: This trade idea is based on Smart money concept and is for informational purposes only. Trading involves risks; seek professional advice before making any financial decisions. Informational only!!!!

NASDAQ100NASDAQ100 may fall hard, I am expecting it go up a little so I can be comfortable to place my positions. Use proper risk managements. Lets Download Success.


NAS100RESIST 18400-1840 all time hgh
support 18300-18200
first plan down then monitor price at 18300-18200
market sentiment is bullish i will update on US seasson up side one stay tunned

