USDCAD on 1hr time frame As you can see market is following trend line and if it breaks we can see massive fall. After getting lower time frame confirmation we can enter.
Plan your trade accordingly.
Usdcadlong

USDCAD - Breakout Will Flip the Trend BullishUSDCAD has been sliding inside a well-defined descending channel, completing a full five-wave drop toward the support zone. The structure from the top looks corrective rather than impulsive. That means the downtrend is weakening as it reaches its final leg.
Your count shows Wave 3 finishing at the dashed red line zone, followed by a small Wave 4 bounce, and now the market is pushing into the last Wave 5. This final drop is expected to target the Fibonacci levels near 1.3915 and 1.3895 . Nothing suggests strength until those levels are tested.
The price is still trapped inside the downward channel, and every bounce has been getting sold. That confirms sellers are still in control for now. Wave (C) is close to completion, but buyers haven’t proven anything yet.
The bullish outlook only becomes valid after a clean breakout above the channel. Without that break, any upside move is just noise inside a bearish structure. The breakout must hold with a higher low to confirm a trend reversal.
If the channel breaks decisively, a strong bullish reversal toward 1.40+ becomes possible. The entire structure suggests the downtrend is aging, so a major upside swing is likely once sellers exhaust. Until then, downside targets remain open and caution is necessary.
Stay Tuned!
@Money_Dictators

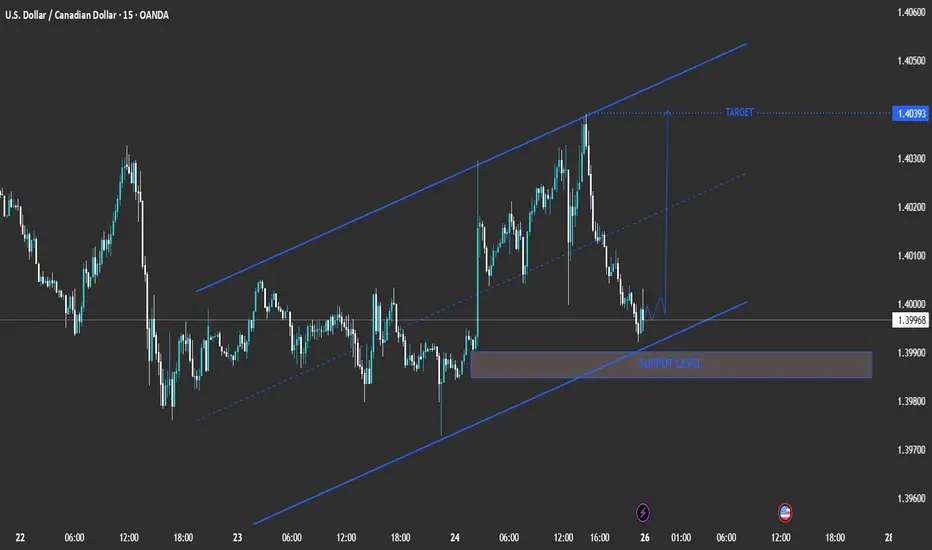
technical analysis of your chart for USD/CAD (15-minute timeframMarket Structure
The pair is moving within an ascending channel, indicating short-term bullish momentum.
Higher highs and higher lows confirm the ongoing uptrend structure.
🟦 Key Zone
Support Level: 1.3985 – 1.3990
This shaded zone represents a demand area where price previously found strong buying interest.
As long as this level holds, the short-term bullish bias remains valid.
🔹 Price Action Outlook
Price is currently testing the lower trendline of the channel and near the support zone.
A bullish reaction from this level could trigger a bounce toward the mid-channel and potentially the upper resistance.
🎯 Target
Upside Target: 1.4039
This corresponds to the upper boundary of the channel and a previous swing high area.
⚠️ Invalidation / Risk Level
A break below 1.3980 would invalidate the bullish setup and could lead to a bearish correction toward 1.3965 or lower.
📈 Trading Signal (Summary)
Bias: Bullish (short-term)
Entry Zone: 1.3985 – 1.3995 (support area)
Target: 1.4039
Stop-Loss: Below 1.3980 FX:EURUSD OANDA:EURUSD OANDA:GBPUSD FX:USDJPY OANDA:USDJPY OANDA:AUDUSD OANDA:GBPJPY OANDA:USDCAD OANDA:USDCHF FX_IDC:USDINR FOREXCOM:EURUSD OANDA:EURNZD
USD/CAD(20250912)Today's AnalysisMarket News:
U.S. initial jobless claims surged to 263,000 in the week ending September 6, reaching a near four-year high. Traders are fully pricing in three Federal Reserve interest rate cuts by the end of 2025.
Technical Analysis:
Today's Buy/Sell Levels:
1.3848
Support and Resistance Levels:
1.3911
1.3887
1.3872
1.3824
1.3809
1.3785
Trading Strategy:
If the price breaks above 1.3848, consider entering a buy position, with the first target at 1.3872.
If the price breaks below 1.3824, consider entering a sell position, with the first target at 1.3809.

USD/CAD(20250905)Today's AnalysisMarket News:
① Waller: I believe we should cut interest rates at the next meeting. Multiple rate cuts are possible in the future, but the exact pace depends on the data.
② Musallem: Current interest rates are appropriate, but there are risks in the job market.
③ Bostic: Concerned about inflation, I still believe one rate cut this year is appropriate.
④ The Federal Reserve will hold a payments innovation conference on October 21st, which will discuss stablecoins, artificial intelligence, and tokenization.
⑤ Fed Governor nominee Milan: If confirmed, I will maintain the independence of the FOMC.
⑥ Kashkari: There is room for a modest rate cut.
⑦ The Federal Reserve Beige Book: Economic activity is roughly flat, with businesses and households feeling the impact of tariffs.
Technical Analysis:
Today's Buy/Sell Levels:
1.3791
Support and Resistance Levels:
1.3824
1.3812
1.3804
1.3778
1.3770
1.3757
Trading Strategy:
If the price breaks above 1.3804, consider entering a buy position, with the first target price at 1.3824.
If the price breaks below 1.3791, consider entering a sell position, with the first target price at 1.3778

USD/CAD - longStep-by-Step Breakdown
Liquidity Sweep: The price drops sharply below a recent low, triggering stop-losses from traders who were buying at higher levels. This move is often called a "liquidity sweep": big players intentionally push prices below support to collect liquidity from retail traders.
Order Block: After the sweep, price quickly reverses and enters a highlighted zone (Order Block), where large buy orders likely came into play. This zone represents a price area where institutions or smart money accumulated positions, causing a shift in momentum. Look to enter trades when price retests this zone, expecting the order block to act as support.
Change of Character (ChoCh): The chart marks a "Change of Character" when price breaks above the last lower high, switching the market structure from bearish to bullish. This structural shift signals increasing buyer control, suggesting the market may continue higher.
Liquidity Target: The top yellow box is labeled "Liquidity" and sits above previous highs. This area is important because many stop-losses from short sellers and buy stop orders are likely placed there, making it a natural price target if the uptrend continues.
Trading Logic: The setup combines the sweep (liquidity grab), order block confirmation, and bullish structure shift, aiming for price to move toward the liquidity pool above. Traders could enter a long position after seeing these signals, with stop-loss below the order block and take-profit at the upper liquidity zone.
Why This Works: These methods are popular because they follow institutional logic: markets often move to collect liquidity before trending, and price respects zones where large orders have been placed. Confirmation from structure change and volume helps reduce risk and improves trade quality.

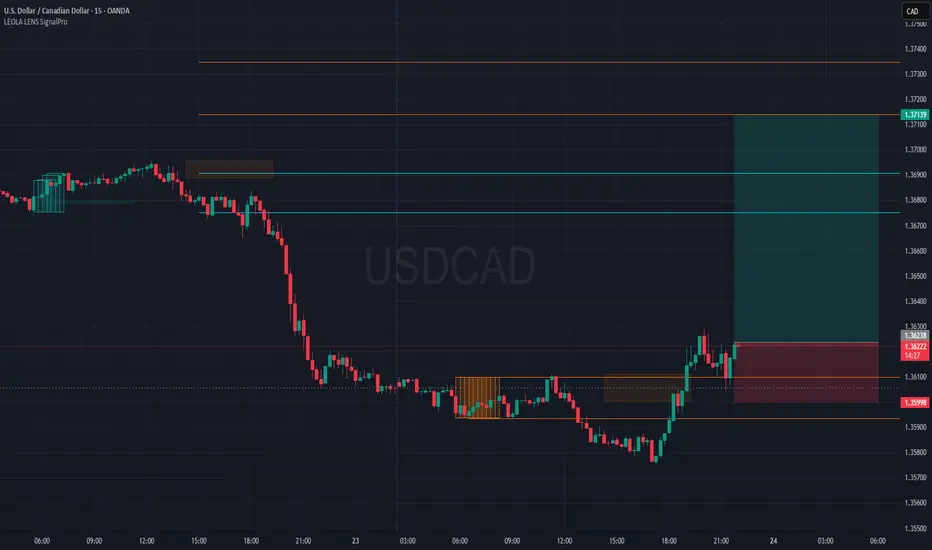
USDCAD Bullish Setup-Shift from Accumulation to ExpansionPrice has broken above recent accumulation range marked by Liquidity Control Boxes.
SignalPro long setup activated with:
🔶 Smart accumulation zone breakout
🔁 Minor retest at 1.361 area holding
🎯 Targeting upper liquidity levels around 1.37139
Price structure shows a bullish microtrend reversal with risk capped below last demand block.
Key Elements on Chart:
📦 Leola Lens SignalPro's control zones provided context for consolidation and breakout
📈 Breakout aims toward untested supply zones above
⏳ Timeframe: 15-min
🧠 Educational Use Only – No financial advice.
Tool used: Leola Lens SignalPro
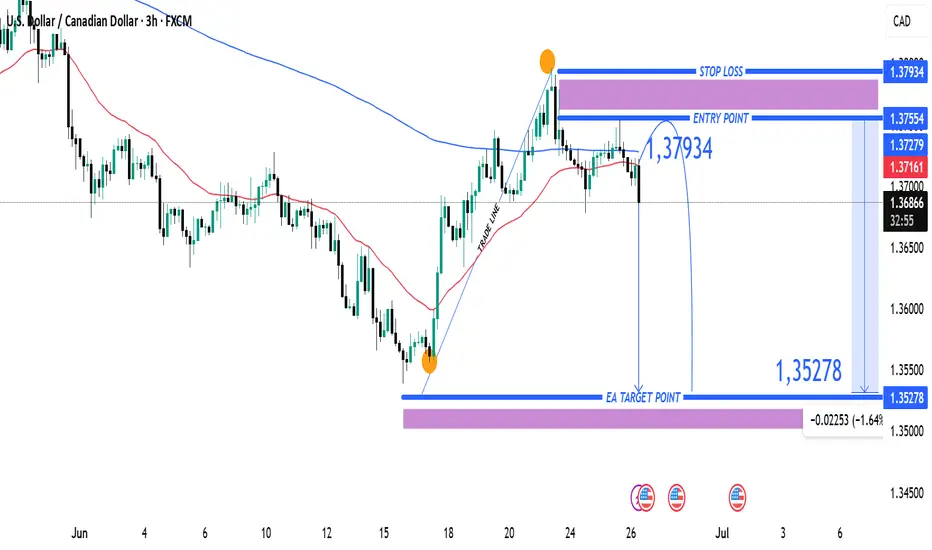
USDCAD Bearish Reversal Trade Setup – 3H Chart Analysis (June 26 Entry Zone: 1.37279 – 1.37554
🔹 Stop Loss: 1.37934
🔹 Target: 1.35278
🔹 Risk-to-Reward (RR): ~1:2.5
🧠 Technical Breakdown
Trend Overview:
Overall trend shows a downtrend from earlier June, followed by a corrective bullish move.
Price failed to sustain above the 200 EMA (blue line), indicating continued bearish pressure.
Trade Line Break:
A steep bullish trendline was broken, signaling a potential trend reversal or deeper pullback.
Bearish Rejection Zone:
The purple zone (1.37279 – 1.37554) acted as resistance.
Price formed a lower high and rejected this zone, confirming selling interest.
Entry Strategy:
Short entry is ideally within or just below the rejection zone.
Aggressive entry already in play at current market price (1.36909) after confirmation.
Target Zone:
Projected towards 1.35278, aligning with previous support and fib retracement zone.
Large purple support zone near the target suggests a potential reversal area.
⚠️ Risk Notes
Be cautious of USD volatility due to upcoming economic events (noted with icons on the chart).
Stop loss above previous swing high minimizes risk of fakeouts.
✅ Summary:
This is a bearish swing setup aiming for a significant drop toward 1.35278. The clean rejection from resistance and trendline break supports a high-probability short opportunity with favorable risk-reward.
USDCAD - IS A BULLISH TREND REVERSAL BREWING?Symbol - USDCAD
USDCAD is staging a recovery supported by the recent strength in the US dollar. A potential return to the prior demand zone could reinforce the bullish case for the pair and present an opportunity to establish long positions.
Amid the backdrop of dollar strength, the market appears to be transitioning into a new phase. The pair has ceased making lower lows and is now forming an EQL structure, from which it is attempting to break out of the prevailing downtrend. While the initial liquidity retest may lead to a brief correction, a swift rebound and sustained consolidation above this level would confirm the emergence of a bullish market structure.
Resistance levels: 1.3700, 1.3730
Support levels: 1.3660, 1.3648
Despite the recent breakout above descending resistance, selling pressure remains evident, with sellers likely to re-enter near the 1.3686 level. A clear breakout above this area, followed by a shift in market sentiment and consolidation above the 1.3675–1.3686 zone, would validate bullish intent and signal readiness for a broader recovery.

Trade Recommendation – USDCAD Buy Position (30-Minute Chart)PAIR: USDCAD
TRADE TYPE: BUY
TIMEFRAME: 30-Minute (M30)
ANALYSIS TIME: 10:35 AM, April 25, 2025 (UTC+7)
STRATEGY: Trend-following + EMA33 (High/Low) + Pullback Signal
✅ Trade Setup:
Entry: BUY around 1.3865
Stop Loss (SL): 1.3838
Take Profit (TP): 1.3957
Risk-Reward Ratio: 1:3.2 (high reward-to-risk setup)
🔍 Technical Analysis:
Short-term trend: Price is in a mild uptrend, forming higher lows.
EMA 33 (High/Low): Price is hovering near EMA33, showing a potential pullback bounce.
Price Structure: After a short-term correction, USDCAD is consolidating and showing signs of a potential breakout above recent highs.
Volume: Increased buying volume during bullish moves indicates strong buying interest.
📌 Trade Management Tips:
Hold the position if price breaks above 1.3885 with strong volume.
Consider trailing stop or move SL to breakeven once price hits 1.3900.
This setup is suitable for short-term swing trading within M30–H1 timeframe.

USDCAD EA MAN UPDATE >READ THE CHAPTIANKey Observations:
Support Zone & Trendline: The price is currently pulling back to a support zone, aligning with the ascending trendline, which may provide a bullish reaction.
EMA Confluence: The price is positioned above the 30 EMA (1.43193, red) and approaching the 200 EMA (1.43167, blue), indicating strengthening bullish momentum.
Target Point: If the price holds at the support and resumes its uptrend, the next target is around 1.43803 - 1.43689.
A break and close above the recent high could confirm further bullish movement towards the target zone. However, if the support fails, a deeper retracement may occu

USDCAD_1HUSDCAD_1H BULLISH
Everything is mentioned on Charts.
Please always look for double confirmation before entry
Wish you Happy & safe Trading.
Trade as per your own RISK
Please Note:
My studies are for educational purpose only.
Please consult your financial advisor before Trading or Investing.
I'm not responsible for any kinds of your Profits & Losses.


USDCAD 1D Timeframe ProjectionUSDCAD 1D Timeframe Projection
The market right now created a range and running inside the range.
I waiting to break above level for Buy.

USD/CAD 4h BUllish Order Block i saw a liq Grab on 4h time frame also with choch with imbalnace candle
with valid order block
entry 1.35043
SL : 1.34847
TP : 1.36153
Note: Do Your own analysis before entering trade im not professional
if you are not sure about this analysis dont trade at all
be Decipline trader

USDCADFX:USDCAD
As you can see that, USDCAD has created a Double bottom pattern. If it breaks the drawn neck line level then we can plan for buy side and it is for monday (07-08-2023) Plan your trade accordingly...

USDCAD Reacts to CPI & Debt Ceiling WoesUSDCAD Reacts to CPI & Debt Ceiling Woes
Two big events affecting the USD/CAD pair include the CPI reading from Canada this week as well as the ongoing debt ceiling crisis in the US.
In April, the monthly Canadian headline CPI surged by 0.7%, resulting in an annual rate of 4.4% compared to the previous 4.3%. This increase exceeded the consensus estimates by three-tenths of a percent in both instances. Consequently, the USD/CAD experienced a 0.4% decrease, reaching 1.3404, before rebounding to a high of 1.3535 USD/CAD has now also breached its 200-day simple moving average on the downside, closing below it to reinforce the bearish signal.
Strengthening this assertion is that the Bank of Canada had recently put a halt to its tightening campaign, having raised interest rates by 425 basis points since March 2022. However, they indicated that this pause was dependent on the inflation outlook aligning with the forecasted trajectory. It is unlikely that this week's CPI data meets this requirement.
Offsetting the positive news for the Canadian dollar is the prevailing optimism in the United States regarding the government's ability to avoid defaulting on its debt.
Following emergency discussions at the White House, President Joe Biden and Republican leaders cautiously expressed hope for a potential agreement to raise the US debt ceiling. The agreement must be reached and approved by both houses of Congress before the federal government exhausts its funds to cover expenses, which could occur as soon as June 1 (only two weeks away). Despite House of Representatives Speaker Kevin McCarthy stating that the two parties remain considerably apart, he believes that a deal could be achieved by the end of the current week.


USDCAD possibility long with slDear Trader USDCAD possibility long with sl Olny After Break Out Trade. Enjoy Your Trade


usdcadFX:USDCAD
As you can see in USDCAD in 1Hr Time frame has formed Inverted Head and Shoulder. if it breaks the Neck line and retest the neckline level then we can go for buy side. Plane your trade accordingly....


